OPEN-SOURCE SCRIPT
Updated TTP QFL Optimiser
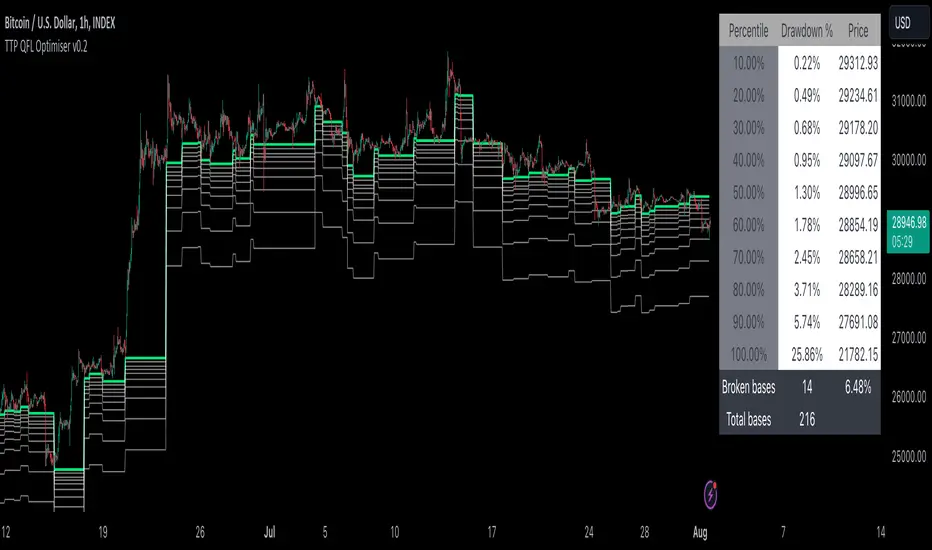
This tool is designed to help finding the best take profit and stop loss levels when trading with QFL bases (Quick Fingers Luc).
You can use it to see the average drawdown among all historic bases broken for an asset and then find the drawdowns that are more frequent using the percentile parameters provided.
For example, by knowing that 98% of the bases got broken with a drawdown of up to 5% can become extremely useful for deciding where to place your take profit or stop loss levels.
It supports QFL 1H, 2H and 4H but make sure to set the chart timeframe to a lower timeframe than QFL to obtain valid results.
Two percentiles are provided to be able to evaluate potential TP and SL at the same time.
Steps:
- Load an asset in the 15min TF
- Select the QFL version: 1H more deals / lower quality vs 4H less deals/ better quality
- Find a percentile that triggers enough deals (example: 70) and then another percentile that doesn't get hit too much (example: 98)
- Confirm the values p1 and p2 provided in the table and the white and grey lines for the results of which drawdown percentages correspond to such selection of percentiles
Once having p1 and p2 use your backtesting and forward testing tools to confirm and adjust accordingly.
Release Notes
Added Percentile bands. It offers 10 percentiles, 10% groups.- What is the distribution of drawdowns from each version of QFL bases broken?
- What percentage of bases have been broken and price still doesn't manage to recover above the base?
You can work with the two supported modes:
- Percentile bands, divide all drawdowns from base broken in 10 percentiles 10%, 20%, 30%....100%. Bands are drawn and a table displayed with all gathered statistics
- Twin percentile, the user picks 2 custom percentiles and a table is shown with data
Release Notes
small bugRelease Notes
bug fixOpen-source script
In true TradingView spirit, the creator of this script has made it open-source, so that traders can review and verify its functionality. Kudos to the author! While you can use it for free, remember that republishing the code is subject to our House Rules.
Join our membership to gain access to the private scripts.
patreon.com/c/thetradingparrot
patreon.com/c/thetradingparrot
Disclaimer
The information and publications are not meant to be, and do not constitute, financial, investment, trading, or other types of advice or recommendations supplied or endorsed by TradingView. Read more in the Terms of Use.
Open-source script
In true TradingView spirit, the creator of this script has made it open-source, so that traders can review and verify its functionality. Kudos to the author! While you can use it for free, remember that republishing the code is subject to our House Rules.
Join our membership to gain access to the private scripts.
patreon.com/c/thetradingparrot
patreon.com/c/thetradingparrot
Disclaimer
The information and publications are not meant to be, and do not constitute, financial, investment, trading, or other types of advice or recommendations supplied or endorsed by TradingView. Read more in the Terms of Use.