Editors' picksOPEN-SOURCE SCRIPT
Economic Calendar (Import from Spreadsheet)
Updated
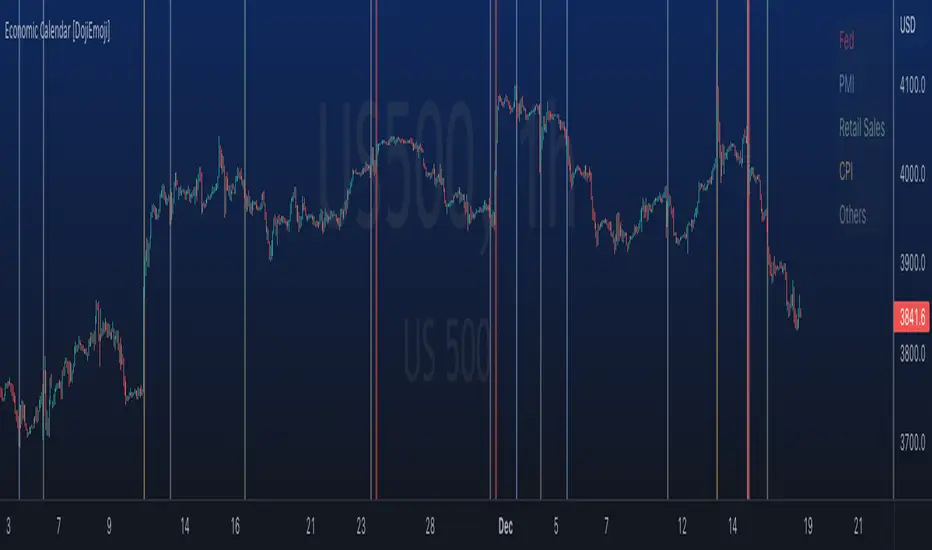
This script draws vertical lines to mark Economic Calendar Events.
Datetime of events is defined by user in Settings via a standardized line of text.
Motivation for coding this script:
All traders should be aware of economic calendar events. At times, when you really need to pay attention to an upcoming major event, you might even decide to use the vertical-line drawing tool to mark it. However, this takes manual effort.
This script provides a solution to performing mundane tasks such as drawing vertical lines and dragging them ever so slightly, just to have them approximately aligned with exact time.
Parameters:
(1) Source data - String representation of collection of datetime referencing to Economic Calendar Events
(2) Line color, & (3) Width of line - For displaying vertical lines drawn by script.
Standardized format for Source Data:
Example:
If 'GMT;2022,6,1,14,0,0;2022,6,2,12,15,0;' is provided to PineScript, then two vertical lines will be drawn on June 6, 2022 according to the exact time in 'YYYY,MM,DD,hh,mm,ss' format at the specified timezone (GMT in this case).
Template for Source Data:
Included here, link below, is a shared Google Sheet that systematically processes Economic Calendar data provided in the 'Raw Data' tab.
https://drive.google.com/drive/folders/14DUDbPBFqhDI84rMbaVXAnkP2H7L8v86
Users are advised to use their preferred methods* to format the string (for source data param.), and apply their own criteria to sort down the Events. (ie. only include Events of High Impact, etc.)
* Preferred methods (as mentioned above) does not mean being limited to using the template as provided in this post.
Release Notes
- Code clean up- Adjusted settings UI with 'text_area'
Release Notes
(1) Refactored,(2) Implemented fail-safe approach to ensure most recent lines get drawn, ignoring oldest events when n > 500 (max no. of lines allowed to shown on chart by pine)
Release Notes
Fix: To adjust for potential timing differences. Original Unix time might cause lines to offset when chart viewed on other timeframes (ie 12hour).Thanks to jdehorty for pointing this out and letting me use his logic for converting Unix time.
Release Notes
changes to docstring Release Notes
New feature: Multiple categories; option to show/hide, rename, and select colors for each grouping.Release Notes
Added table showing legend for line colorsRelease Notes
- Added new events covering up to 1H23
- Also sharing a Python script that does the preprocessing by filtering the data provided by Fxstreet:
https://colab.research.google.com/drive/146DLEXSHuHF9T4bNxEVA6b1LvuyW7TqN
Release Notes
Updated the calendar:- Source: colab.research.google.com/drive/1UiKaRR0cHAdbeiXcxJ4bAlgPVYE_6nJs
- Start date: 01/01/2023
- End date: 10/23/2023
Open-source script
In true TradingView spirit, the author of this script has published it open-source, so traders can understand and verify it. Cheers to the author! You may use it for free, but reuse of this code in publication is governed by House rules. You can favorite it to use it on a chart.
Want to use this script on a chart?
Read faster with getcoralai.com//?ref=dojiemoji
Disclaimer
The information and publications are not meant to be, and do not constitute, financial, investment, trading, or other types of advice or recommendations supplied or endorsed by TradingView. Read more in the Terms of Use.