Editors' picksOPEN-SOURCE SCRIPT
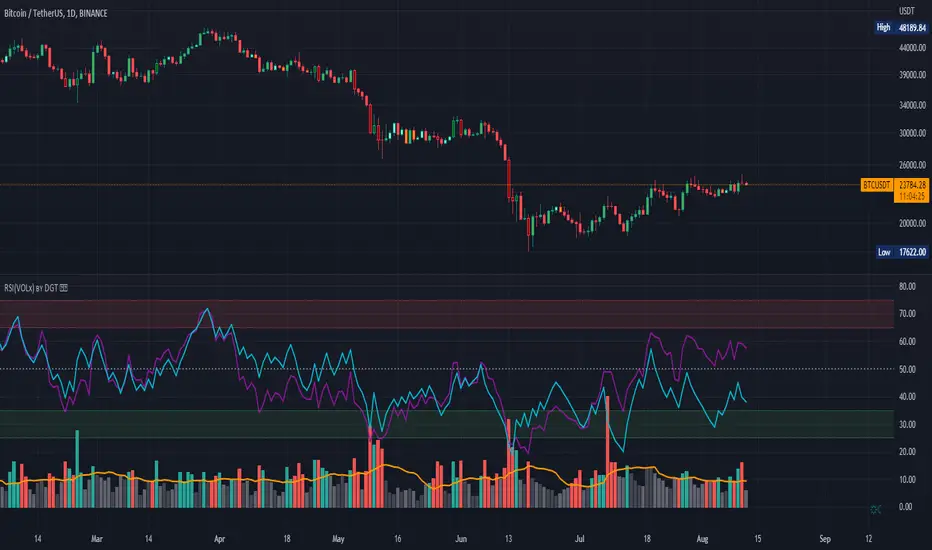
Relative Strength of Volume Indicators by DGT
Updated
The Relative Strength Index (RSI), developed by J. Welles Wilder, is a momentum oscillator that measures the speed and change of price movements.
• Traditionally the RSI is considered overbought when above 70 and may be primed for a trend reversal or corrective pullback in price, and oversold or undervalued condition when below 30. During strong trends, the RSI may remain in overbought or oversold for extended periods.
• Signals can be generated by looking for divergences and failure swings. If underlying prices make a new high or low that isn't confirmed by the RSI, this divergence can signal a price reversal. If the RSI makes a lower high and then follows with a downside move below a previous low, a Top Swing Failure has occurred. If the RSI makes a higher low and then follows with an upside move above a previous high, a Bottom Swing Failure has occurred
• RSI can also be used to identify the general trend. In an uptrend or bull market, the RSI tends to remain in the 40 to 90 range with the 40-50 zone acting as support. During a downtrend or bear market the RSI tends to stay between the 10 to 60 range with the 50-60 zone acting as resistance
This study aim to implement Relative Strength concept on most common Volume indicators, such as
• Accumulation Distribution is a volume based indicator designed to measure underlying supply and demand
• Elder's Force Index (EFI) measures the power behind a price movement using price and volume
• Money Flow Index (MFI) measures buying and selling pressure through analyzing both price and volume (used as it is)
• On Balance Volume (OBV), created by Joe Granville, is a momentum indicator that measures positive and negative volume flow
• Price Volume Trend (PVT) is a momentum based indicator used to measure money flow
Plotting will be performed for regular RSI and RSI of Volume indicator (RSI(VOLX)) selected from the dialog box, where the possibility to apply smoothing is provided as option. Additionally, labels can be added optionally to display the value and name of selected volume indicator
Secondly, ability to present Volume Histogram within the same study along with its Moving Average or Volume Oscillator based on selection
Finally, Volume Based Colored Bars, a study of Kıvanç Özbilgiç is added to emphasis volume changes on top of the bars
Nothing excessively new, the study combines RSI with;
- RSI concept applied to some of the common Volume indicators presented with a highlighted over/under valued threshold area, optional labeling and smoothing,
- added Volume data with additional information and
- colored bars based on volume
Thanks Vishant_Meshram for the inspiration 🙏
Disclaimer:
Trading success is all about following your trading strategy and the indicators should fit within your trading strategy, and not to be traded upon solely
The script is for informational and educational purposes only. Use of the script does not constitute professional and/or financial advice. You alone have the sole responsibility of evaluating the script output and risks associated with the use of the script. In exchange for using the script, you agree not to hold dgtrd TradingView user liable for any possible claim for damages arising from any decision you make based on use of the script
Release Notes
Despite volume being measured numerically, the actual individual quantitative value of volume is not relevant. Instead, traders and analysts shall look to the volume changes over time, which carries all of the weight of analysis. with this study, a normalization is applied to volume histogram so to be able to plot it meangfully in conjunction with relative strenght index lines. For whom interested with the the actual quantitative value of volume, on specific exchange, a label is added displaying the quantitative value of volume at the time being under investigation
Release Notes
small fixRelease Notes
volume histogram size made adjustable from user dialog boxto reverse the histogram, simply setting negative numbers will be enough
thanks @adrianbrevig for your valuable suggestion
Release Notes
4 color coded relative volume histogram display addedvolume increases above the moving average will be presented in green and red, and average volume values with back and gray.
hence this updated is adding ability to emphasis notable increases in the volume
Release Notes
color code corrected when volume histogram is reversedthanks for the warning hardmangames77
Release Notes
Buying/Selling relative volume histogram option added, Performance optimization,
Pine Script v5 update
Lables removed
Release Notes
bug correctionOpen-source script
In true TradingView spirit, the author of this script has published it open-source, so traders can understand and verify it. Cheers to the author! You may use it for free, but reuse of this code in publication is governed by House rules. You can favorite it to use it on a chart.
Want to use this script on a chart?
Disclaimer
The information and publications are not meant to be, and do not constitute, financial, investment, trading, or other types of advice or recommendations supplied or endorsed by TradingView. Read more in the Terms of Use.