Editors' picksOPEN-SOURCE SCRIPT
Hancock - RSI Volume
Updated
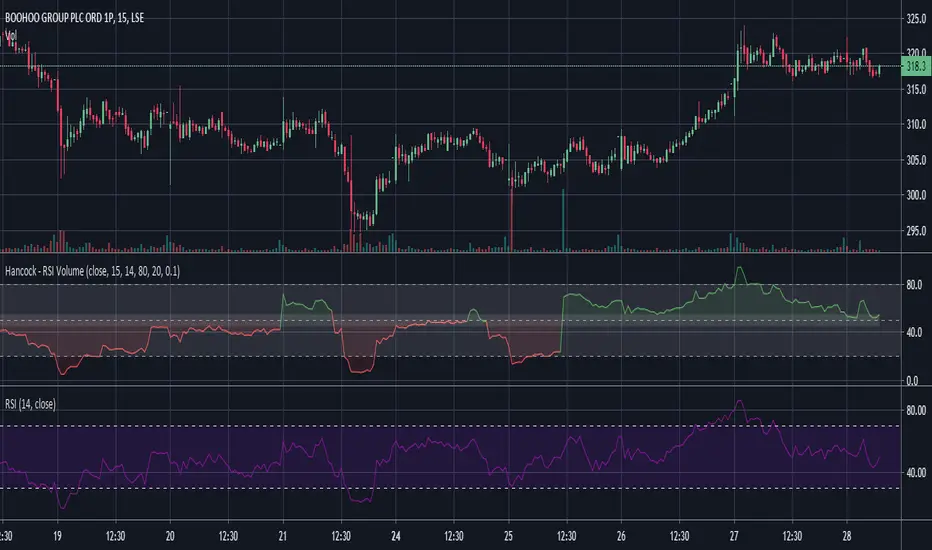
The Volume RSI (Relative Strength Index) is quite similar to the price based RSI with difference that up-volume and down-volume are used in the RSI formula instead changes in price. If price RSI shows relation between up-moves and down-moves within an analyzed period of time by revealing which moves are stronger, the Volume RSI indicator shows the relation between volume traded during these price up-moves and down- moves respectfully by revealing whether up-volume (bullish money flow) or down-volume (bearish money flow) is stronger.
This indicator estimates the buy and sell volume of each candle by using a configurable lower time-frame and uses the buy and sell volume in the calculation of the RSI Volume (VoRSI)
Happy trading
Hancock
This indicator estimates the buy and sell volume of each candle by using a configurable lower time-frame and uses the buy and sell volume in the calculation of the RSI Volume (VoRSI)
Happy trading
Hancock
Release Notes
Various fixes for NA values breaking the reliability of the volume weighted RSIHappy trading
Hancock
Release Notes
Updated screen shotRelease Notes
Updated UI to be more visual.Added threshold values for RSI to indicate trend change.
Happy trading
Hancock
Open-source script
In true TradingView spirit, the author of this script has published it open-source, so traders can understand and verify it. Cheers to the author! You may use it for free, but reuse of this code in publication is governed by House rules. You can favorite it to use it on a chart.
Want to use this script on a chart?
Disclaimer
The information and publications are not meant to be, and do not constitute, financial, investment, trading, or other types of advice or recommendations supplied or endorsed by TradingView. Read more in the Terms of Use.