Editors' picksOPEN-SOURCE SCRIPT
Auto Trendline Indicator (based on fractals)
Updated

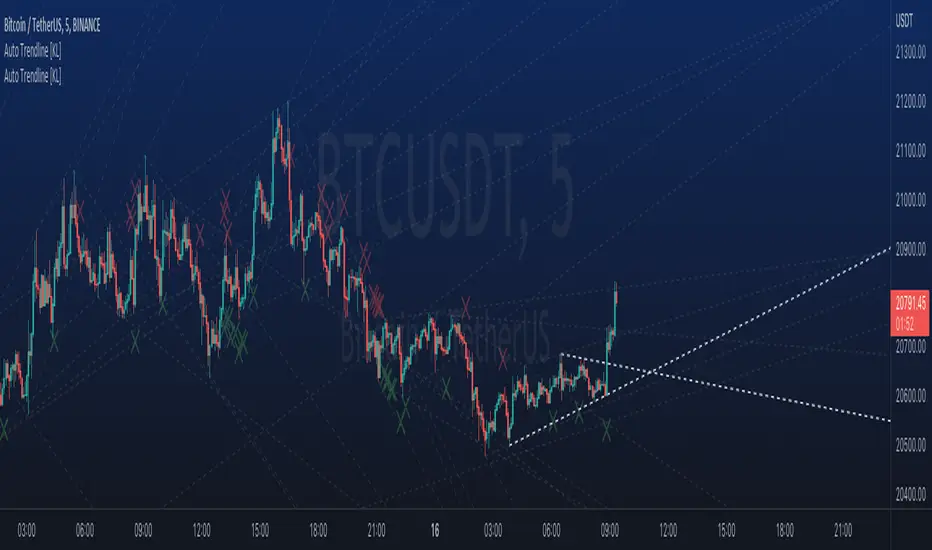
A tool that automatically draws out trend lines by connecting the most recent fractals.
Description:
The process of manual drawing out trend lines is highly subjective. Many times, we don’t trade what we see, but what we “want to see”. As a result, we draw lines pointing to the direction that we wishfully want price to move towards. While there are no right/wrong ways to draw trend lines, there are, however, systematic/unsystematic ways to draw trend lines. This tool will systematically draw out trend lines based on fractals.
Additional feature:
This tool will also plot out symbols (default symbol “X”) to signify points of crossings. This can be useful for traders considering to use trend lines as part of their trading strategies.
Here is an interesting observation on the price actions of NASDAQ futures on a 5 second chart during regular trading hours on July 14, 2022.

It’s a phenomenon. People like to see straight lines connecting HL/LH, etc., so it's possible for the market as a whole to psychologically react to these lines. However, it is important to note that is is impossible to predict the direction of price. In the case above, price could have tanked below auto-drawn trend line. Fractal based trend lines should only be taken as references and regarded as price levels. No studies have ever proven that the slope of trend lines can indicate price's future direction.
More about fractals:
To understand more about fractals:
Contrary to what it sounds like, fractal in "technical analysis" does not refer to the recursive self-repeating patterns that appear in nature, such as the mesmerizing patterns found in snowflakes. The Fractal Markets Hypothesis claims that market prices exhibit fractal properties over time. Assuming this assertion to be true, then fractals can be used a tool to represent the chaotic movements of price is a simplified manner.
The purpose of this exercise is to take a tool that is readily available (ie. in this case, TradingView’s built-in fractals tool), and to create a newer tool based on it.
Parameters:
Description:
The process of manual drawing out trend lines is highly subjective. Many times, we don’t trade what we see, but what we “want to see”. As a result, we draw lines pointing to the direction that we wishfully want price to move towards. While there are no right/wrong ways to draw trend lines, there are, however, systematic/unsystematic ways to draw trend lines. This tool will systematically draw out trend lines based on fractals.
Additional feature:
This tool will also plot out symbols (default symbol “X”) to signify points of crossings. This can be useful for traders considering to use trend lines as part of their trading strategies.
Here is an interesting observation on the price actions of NASDAQ futures on a 5 second chart during regular trading hours on July 14, 2022.
It’s a phenomenon. People like to see straight lines connecting HL/LH, etc., so it's possible for the market as a whole to psychologically react to these lines. However, it is important to note that is is impossible to predict the direction of price. In the case above, price could have tanked below auto-drawn trend line. Fractal based trend lines should only be taken as references and regarded as price levels. No studies have ever proven that the slope of trend lines can indicate price's future direction.
More about fractals:
To understand more about fractals:
- investopedia.com/articles/trading/06/fractals.asp
- tradingview.com/support/solutions/43000591663-williams-fractal/
Contrary to what it sounds like, fractal in "technical analysis" does not refer to the recursive self-repeating patterns that appear in nature, such as the mesmerizing patterns found in snowflakes. The Fractal Markets Hypothesis claims that market prices exhibit fractal properties over time. Assuming this assertion to be true, then fractals can be used a tool to represent the chaotic movements of price is a simplified manner.
The purpose of this exercise is to take a tool that is readily available (ie. in this case, TradingView’s built-in fractals tool), and to create a newer tool based on it.
Parameters:
- Fractal period (denoted as ‘n’ in code): It is the number of bars bounding a high/low point that must be lower/higher than it, respectively, in order for fractal to be considered valid. Period ‘n’ can be adjusted in this tool. Traditionally, chartists pick the value of 5. The longer it is, the less noise seen on the chart, and the pivot point may also be exhibited in higher timeframes. The drawback is that it will increase the period of lag, and it will take more bars to confirm the printed fractal.
- Others: Intuitive parameters such as whether to draw historical trend lines, what color to use, which way to extend the lines, and whether or not to show points of crossings.
Release Notes
Adjusted settings UI. Release Notes
Added new features:- generic alerts
- adjustable line width
- separate line formats for new & old lines
- can specify maximum number of trend lines to show
Release Notes
New feature: Shows fractals by plotting HL/LH/HH/LL in any user defined comboRelease Notes
Refactor: Handle for fractal -> UDTOpen-source script
In true TradingView spirit, the author of this script has published it open-source, so traders can understand and verify it. Cheers to the author! You may use it for free, but reuse of this code in publication is governed by House rules. You can favorite it to use it on a chart.
Want to use this script on a chart?
Read faster with getcoralai.com//?ref=dojiemoji
Disclaimer
The information and publications are not meant to be, and do not constitute, financial, investment, trading, or other types of advice or recommendations supplied or endorsed by TradingView. Read more in the Terms of Use.