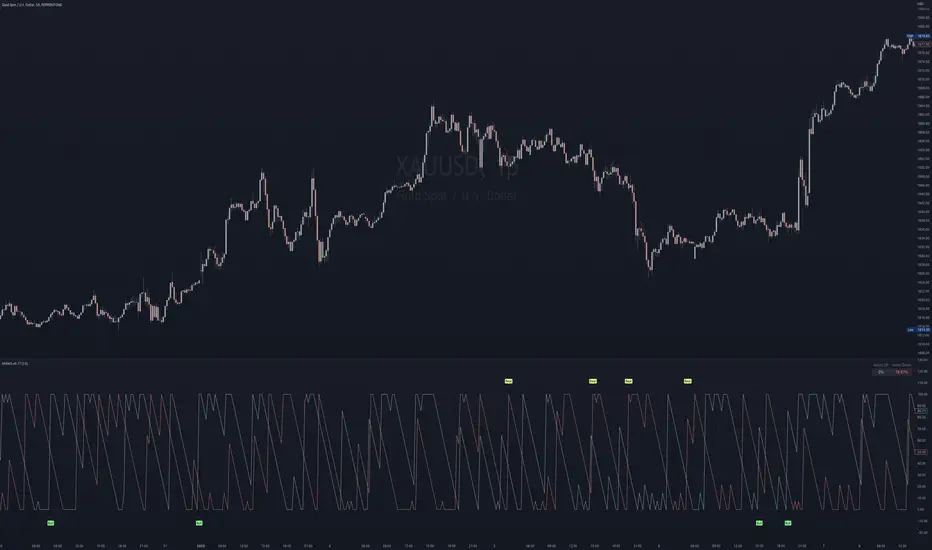
Arron Meter With Alerts [Skiploss]Arron Meter With Alerts is an indicator to identify the trend, and a meter shows the percentage of AroonUP and AroonDown.
Alert Settings
It will be part of a display of bullish and bearish signals by using the condition of the upper line cross lower line and HMA 200 cross under/over EMA 12, and also upper/lower line must be higher than 70%
Aroonindicator
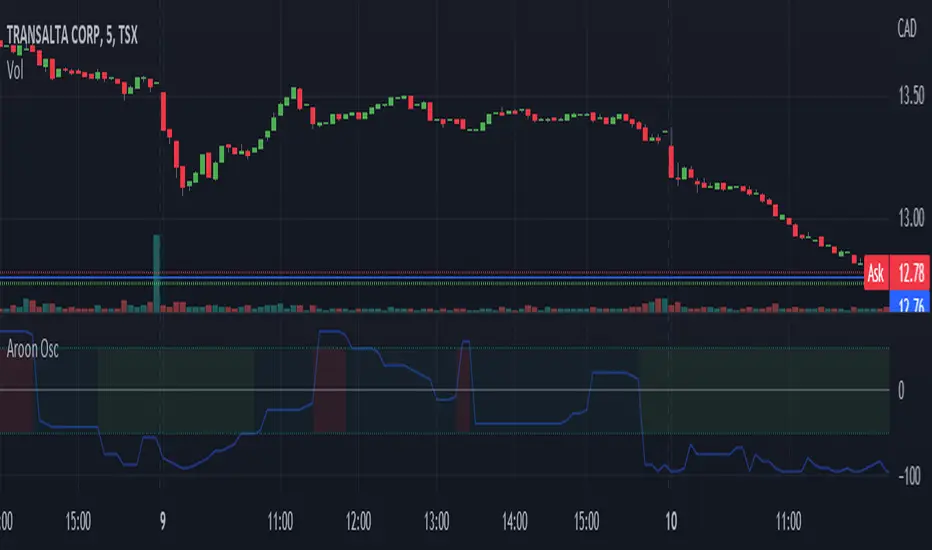
Aroon Oscillator [bkeevil]The Aroon Oscillator is intended to highlight short-term trend changes by comparing the number of periods since the last high with the number of periods since the last low.
Since the crossover rules for this oscillator frequently give false signals, I have opted for a more general approach: When the oscillator passes above the 50 line, the background of the indicator will turn green, indicating a general short term buy condition. When the oscillator passes below the -50 line, the background of the indicator will turn red, indicating a general short term sell condition. Use this indicator in combination with other indicators and price signals to identify short term trend changes.
This version improves on existing versions by:
Adding background colors to indicate general buy/sell conditions
More visually appealing
Uses the latest version 5 features
Well documented source code that conforms to the style guide
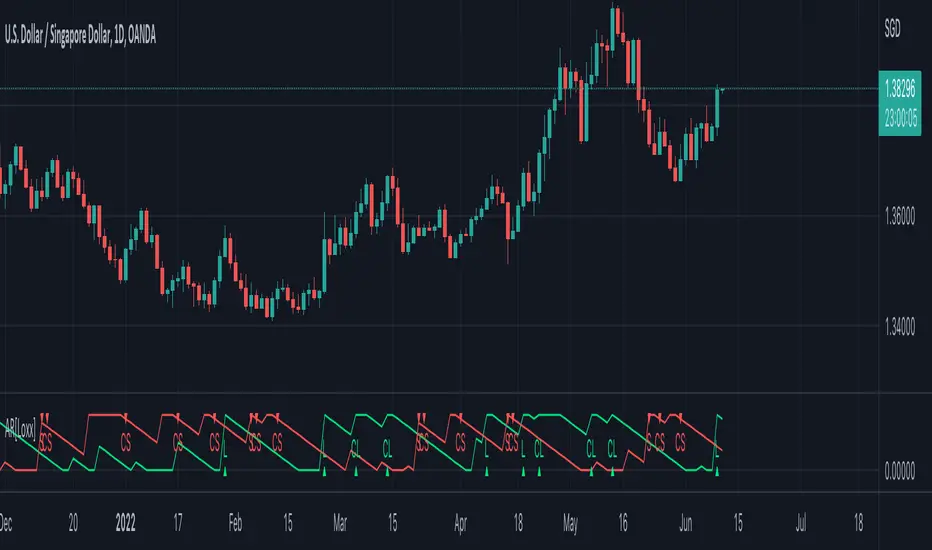
Aroon [Loxx]The Aroon indicator is a technical indicator that is used to identify trend changes in the price of an asset, as well as the strength of that trend. In essence, the indicator measures the time between highs and the time between lows over a time period. The idea is that strong uptrends will regularly see new highs, and strong downtrends will regularly see new lows. The indicator signals when this is happening, and when it isn't.
Included:
-Long and short signal cross entries
-Continuation long and shorts entries calculated by lagged same-signal cross-ups and cross-downs
This is an exact clone of the "Aroon" for MT4 indicator
Bollinger Bands And Aroon Scalping (by Coinrule)Many technical indicators can be profitable in certain market conditions while failing in others. No indicator is perfect alone.
All the best trading strategies involve multiple indicators and leverage the benefit of each of them. The following is an optimised strategy based on Bollinger Bands and the Aroon indicator.
The Bollinger Bands are among the most famous and widely used indicators. They can suggest when an asset is oversold or overbought in the short term, thus provide the best time for buying and selling it.
A strategy buying dips can work well during times of uptrend. Downtrends will result in a drawdown for the P&L of the strategy. The suggested approach minimises the drawdowns, ensuring that the system trades only when it's more likely to close the trade in profit.
The Setup
ENTRY
The price crosses below the basis line of the Bollinger Band indicator
The Aroon Indicator is above 90
EXIT
The price crosses below the upper Bollinger Band
The Aroon Indicator drops below 70
The Aroon Indicator plays a key role in this strategy. It acts as a confirmation that the asset is currently in an uptrend. On the other hand, it acts as a stop if market conditions deteriorate. The strategy uses an Aroon Indicator set to 288 periods to provide a longer-term view on market conditions, not being heavily dependent on short-term volatility.
The best time frame for this strategy based on our backtest is the 4-hr . The 1-hr can work well with three times more trades, on average. As trades increase, the profitability decreases. Yet again, this is the confirmation that trading more does not mean gaining more.
To make the results more realistic, the strategy assumes each order to trade 30% of the available capital. A trading fee of 0.1% is taken into account. The fee is aligned to the base fee applied on Binance, which is the largest cryptocurrency exchange.

Aroon VariantArron Variant is based on the original Arron but with a twist, Arron Variant measures the difference between highs and lows over a time period, opposed to the original Arron who measures the time (bars) between highs and lows over a time period.
Also added a few optional moving averages like EMA, HMA and JMA. (Default JMA - Jurik Moving Average)
===== Color Explained =====
Bright Green: Column is above zero and ascending or equal from previous column. (Stronger uptrend)
Darker Green: Column is above zero and descending or equal from previous column. (Weakening uptrend)
Bright Red: Column is below zero and descending or equal from previous column. (Stronger downtrend)
Darker Green: Column is below zero and ascending or equal from previous column. (Weakening downtrend)
==== Notes =====
Support different multi time frames (recommended to use higher time frames than chart time frame to avoid unrealistic results)
Bar colors are disabled by default.
For other coders: Using Latest Pinescript color framework (Link in code)
Like if you Like and Follow me for upcoming indicators/strategies: www.tradingview.com

MTF Aroon [Takazudo]Multi Timeframe Aroon implementation. This study highlights the background when the strong signal is detected.
This study was intented to use as a part of buy/sell strategies.
