Basis Divergence OscillatorBasis Divergence Oscillator — TradingView publication description
## Overview
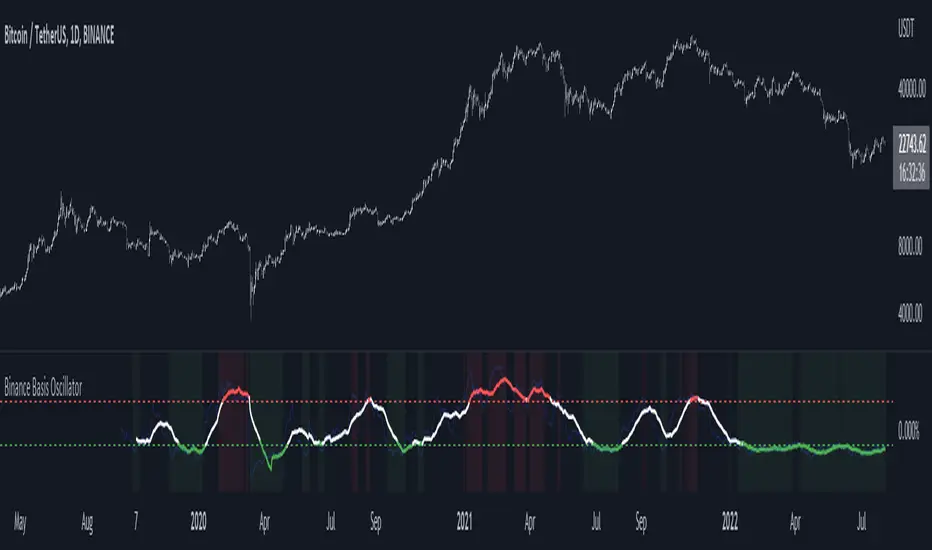
The Basis Divergence Oscillator turns the **futures-versus-spot basis** (the premium or discount of a future to its cash market) into a standardized, bounded oscillator, and then looks for **divergence between price and that basis**. The idea it tests is simple: when price makes a new extreme but the premium does not confirm it, the move is more likely leverage being unwound than fresh demand.
It is a single-pane oscillator. By default it pairs NSE NIFTY index futures with the NSE:NIFTY cash index, but every data input is user-configurable, so it runs on any future that has a cash/spot counterpart, in any market and on any timeframe.
## What it plots
- A z-scored **basis oscillator** (premium expanding = up, premium shrinking toward discount = down), with a glow line and σ-based overbought/oversold levels.
- **Extreme-zone bands** (default ±3σ) with a gradient fill that deepens toward the edge.
- **Divergence lines and labels** drawn on the oscillator — regular (reversal) and hidden (continuation), in two colors.
- **In-band reversal dots** where the oscillator turns inside an extreme zone.
- Optional **price-pane marks** at the confirmation bar (all generated by this one indicator).
- A **background-adaptive status dashboard** (oscillator value in σ, zone, last divergence, last reversal, live basis in points).
## Why these components are combined (mashup rationale)
This script deliberately combines a **cross-symbol calculation**, a **normalization stage**, a **divergence engine** and a **reversal read**, because each one answers a question the others cannot, and none of them is useful here on its own:
1. **Cross-symbol basis (two instruments → one series).** The basis is `chart price − cash/spot reference`. It isolates the small premium/discount component of price, which is driven by cost of carry, financing and leverage/positioning demand — information that the instrument's own price and its own volume do not contain. This is the whole reason a second symbol is pulled: remove either symbol and the basis is undefined. The two-symbol construction is intrinsic, not decorative.
2. **Standardization (rolling z-score).** The raw basis drifts slowly with time-to-expiry and carry, and its scale differs by instrument. The z-score detrends that drift and expresses the basis in standard-deviation units, so "overbought/oversold" and the extreme bands mean the same thing on NIFTY, on a commodity future, or on a crypto perpetual. Without this step the divergence thresholds would not transfer between symbols.
3. **Divergence engine.** A plotted basis line is already common; the original payload here is reading **price-versus-basis disagreement at confirmed pivots**. The engine pairs each new price pivot with the basis oscillator's value, then requires (a) a genuine new price extreme, (b) the basis failing to confirm it, (c) a minimum oscillator gap scaled to the oscillator's own stdev, (d) the two pivots within a maximum bar distance, and (e) optionally an overbought/oversold reading at the pivot. These gates exist so the combination produces meaningful signals rather than noise.
4. **Reversal read.** Independently, the engine flags oscillator turns that occur inside the extreme bands — a complementary "exhaustion" cue to the divergence cue.
In short, the components form one pipeline: **build an independent signal (basis) → make it comparable (z-score) → surface where price and that signal disagree (divergence) and where it exhausts (reversal).** They are read together; each is incomplete alone.
## How it works (method)
- `basis = price − request.security(reference, close)` on the chart's timeframe (no lookahead).
- `oscillator = z-score(basis, normalization window)`, optionally EMA-smoothed.
- Regular and hidden divergence are detected from confirmed `pivothigh`/`pivotlow` pivots and filtered by the gates above.
- Reversals are oscillator pivots that print within the ±extreme bands.
- Pivots confirm a few bars after they occur, so a printed signal does not repaint afterward. The confirmation lag equals the pivot length.
## How to use it
1. Put the indicator on a **future** (e.g. NIFTY index futures).
2. In **Data source**, set **Reference (cash/spot) symbol** to that instrument's spot (default NSE:NIFTY). A mismatched reference makes the basis meaningless.
3. Read divergence as **context, not a trigger**: a bearish divergence (price higher high, basis lower high) says the advance is not backed by premium; a bullish divergence says the opposite. Confirm with your own structure, levels and risk process.
4. Tune the **pivot length**, **max gap** and **min oscillator gap** to your timeframe; raise them for fewer, cleaner signals.
## Originality
This is an original implementation. It is not a basis line and not a generic divergence script: it is the specific combination of a cross-symbol basis, σ-standardization that makes the read portable across markets, a multi-gate divergence engine (magnitude + distance + extreme-zone), hidden-divergence and in-band reversal detection, and a background-adaptive dashboard. The code is written from scratch; helper functions use only their arguments and built-ins.
## Credits
The basis (futures premium/discount) is explained by the **cost-of-carry / theory-of-storage** framework in futures-pricing economics — foundational work by N. Kaldor (1939) and H. Working (1948–49). **Price/oscillator divergence** is a long-established, publicly documented technical-analysis technique. This script is not affiliated with, nor endorsed by, any third party.
## Notes / limitations
- The basis needs a clean reference feed and a matched contract; on illiquid or mismatched references, or when spot and future trade on different clocks, it is noisy.
- Divergence is descriptive context, never a guarantee of reversal.
- If the reference symbol is unavailable the oscillator holds flat and the dashboard shows "n/a".
## Disclaimer
Research and educational tool only. NOT financial advice and no guarantee of profitability or accuracy. Indicators describe past behaviour; they do not predict the future. Trading carries risk of loss. Test out-of-sample and make your own decisions. The author accepts no liability for any use of this script.
Indicator

Perpetual Basis Drift Map [AGPro Series]Perpetual Basis Drift Map
🧠 Core Idea
Is the perpetual market quietly drifting away from spot, or is the basis relationship compressing back toward neutral?
📌 Overview / What it does
Perpetual Basis Drift Map is a crypto derivatives context tool designed to monitor how the active perpetual or futures market behaves against a matching spot reference.
The script compares the active chart price with an automatically selected spot reference, measures basis percentage, basis drift, normalized basis z-score, drift velocity, persistence, and trend context. It converts that relationship into an open three-rail basis drift meter, state labels, right-side tags, alerts, and an AG Pro dashboard.
It does not read official funding payments, automate trades, predict future price direction, or promise that basis must mean-revert. It is a structured visual map for interpreting perpetual premium, perpetual discount, basis expansion, basis compression, reset, and spot-reference mismatch conditions.
🎯 Purpose & Design Philosophy
This script was built to separate basis drift from generic funding or premium talk.
Funding pressure can be noisy, and a raw premium number is often not enough. Traders need to know whether the relationship between perp/futures and spot is widening, compressing, persisting, or simply resetting.
The design goal is to make basis behavior visible as a chart story, not just a number in a panel.
⚡ Why This Script Is Different
Most tools show a spread or premium value and leave the interpretation to the user.
This script does NOT treat basis as a simple buy or sell signal, does NOT claim that premium must reverse, and does NOT hide reference mismatch risk.
Instead, it maps the basis relationship into states: Positive Drift, Negative Drift, Basis Expansion, Basis Compression, Reset, and Check Spot Ref, while the chart labels use Premium Drift, Discount Drift, Spread Expansion, and Basis Compression for faster visual reading. It uses spot-reference comparison, baseline drift, z-score, velocity, persistence, and trend context together.
⚙️ Methodology
1. Context Detection
The script builds a spot reference from the active chart base currency, selected exchange, and selected quote.
2. Reference Mapping
It compares the active market against the spot reference and calculates basis percentage.
3. Reaction Evaluation
The model evaluates basis drift from baseline, normalized basis z-score, drift velocity, persistence, and trend context.
4. Visual Output
The result is shown as a compact open basis drift meter, centered meter label, right-side tags, event labels, and dashboard panel.
🗺️ How to Read the Chart
The basis drift meter separates the current read into three visible layers: state rail, basis value rail, and pressure score rail. It is intentionally open-ended rather than a closed corridor, so the visual story feels different from zone-first tools.
Labels mark state changes such as Premium Drift, Discount Drift, Spread Expansion, and Basis Compression. Optional compact pulse markers add additional context when premium, discount, expansion, or compression pressure appears without turning the script into a signal engine.
Colors communicate context:
• Teal = positive/perp-premium drift pressure
• Pink = negative/perp-discount drift pressure
• Yellow = spread expansion or reference warning
• Indigo = compression/reset regime
The panel summarizes state, score, basis, basis z-score, velocity, persistence, direction, quality, spot reference, trend, and meter values.
🚦 Signals & States
• Positive Drift → perpetual/futures market is drifting above the spot reference
• Negative Drift → perpetual/futures market is drifting below the spot reference
• Basis Expansion → basis deviation and drift velocity are widening
• Basis Compression → basis deviation is compressing back toward neutral
• Reset → no active drift state is strong enough to dominate the read
• Check Spot Ref → selected spot reference appears mismatched or unavailable
🔔 Alerts Logic
Alerts trigger when the script transitions into selected basis states.
Positive Basis Drift alerts mark meaningful upward perp-versus-spot drift.
Negative Basis Drift alerts mark meaningful downward perp-versus-spot drift.
Basis Expansion alerts mark widening basis deviation and drift velocity.
Basis Compression alerts mark movement back toward a neutral basis relationship.
Alerts are attention markers, not trade instructions.
🧩 Confluence Logic
The strongest context appears when multiple components align:
Basis percentage + normalized basis z-score + drift velocity + persistence + trend context.
When basis widens and persists, the relationship may deserve closer attention. When basis compresses, the market may be returning toward a more neutral perp-versus-spot condition.
📊 When to Use
• Crypto perpetual and futures charts
• Markets where spot reference comparison is meaningful
• Perp/spot monitoring on BTC, ETH, and liquid crypto pairs
• Basis expansion, basis compression, and drift-context analysis
• Sessions where derivatives premium or discount behavior matters
⚠️ When NOT to Use
• Symbols with poor spot-reference alignment
• Illiquid markets with unreliable pricing
• Spot-only charts if the user expects a derivatives basis story
• Extreme news events where spread behavior can become unstable
• Markets where the active symbol and selected reference are not comparable
🎛️ Key Inputs
• Auto Spot Reference → automatically builds a matching spot reference
• Basis Baseline Length → controls how quickly the normal basis relationship adapts
• Basis Normalization Lookback → controls how unusual basis drift must be
• Drift Velocity Lookback → measures whether basis is widening or tightening
• Persistence Window → measures whether basis behavior continues across bars
• Reference Mismatch Guard % → prevents mismatched references from being interpreted as real basis drift
• Visual Settings → control meter projection, labels, right-side tags, and font sizes
🖥️ Interface & Visual Design
The interface is designed around a premium chart-first story.
The basis drift meter provides the main visual anchor. Centered meter text explains the state without relying on weak transparent labels or a large corridor box. Right-side tags keep the current state, basis, and score visible near the active price area.
The panel follows the AG Pro standard with a merged blue header row, adjustable location, adjustable theme, and adjustable font size.
🧪 Practical Usage Workflow
1. Apply the script to a crypto perpetual or futures chart.
2. Keep Auto Spot Reference enabled for the first pass.
3. Confirm the Spot Ref row matches the active market base currency.
4. Read State, Score, Basis, Basis Z, and Velocity.
5. Inspect whether basis is drifting, expanding, compressing, or resetting.
6. Confirm the read with broader market structure, liquidity, volatility, and risk management.
🔍 Interpretation Guidelines
Positive basis drift can show perp premium building, but it does not automatically mean price must fall.
Negative basis drift can show perp discount building, but it does not automatically mean price must rise.
Basis expansion is a context marker, not a trade instruction.
Basis compression can indicate normalization, but normalization does not guarantee direction.
🚫 What This Script Is NOT
This script is not a prediction engine.
This script is not financial advice.
This script is not an auto trading system.
This script is not a guaranteed signal engine.
This script does not read official funding payments directly.
This script does not claim that basis drift must immediately reverse.
⚠️ Limitations & Transparency
The script estimates basis from active-symbol versus spot-reference price behavior.
Reference quality matters. If the selected reference is wrong or unavailable, the script shows Check Spot Ref rather than presenting the spread as valid basis drift.
Different exchanges, contract types, liquidity conditions, and timeframes can produce different basis behavior.
Very low basis values can be visually clean but may not produce a dramatic story.
🧠 Market Context Notes
Perpetual basis can help traders understand whether derivatives pricing is leaning above or below spot.
The value of this tool is strongest when combined with structure, volatility, liquidity, open interest, and disciplined risk management.
Basis tells context. It does not create certainty.
🧾 Use Case Examples
When a perpetual chart trades persistently above spot and basis velocity expands, the script may classify Positive Drift or Basis Expansion.
When a perpetual chart trades persistently below spot and basis velocity expands downward, the script may classify Negative Drift.
When basis returns toward its baseline, Basis Compression can help show normalization.
🧱 System Philosophy
Perpetual Basis Drift Map follows the AGProLabs principle of building decision-support maps rather than prediction tools.
The script is designed to make hidden derivatives context easier to see, not to replace judgment.
🔐 Non-Promise Statement
No basis model can guarantee future price direction.
No drift score removes uncertainty.
This tool helps organize context; it does not create certainty.
📉 Risk Disclosure
Trading involves risk.
Crypto derivatives can be highly volatile and may involve leverage, liquidation risk, exchange risk, funding-cost changes, and rapid market movement.
This script is for educational and analytical purposes only.
It does not provide financial advice or guaranteed trading outcomes.
Users remain responsible for their own decisions.
📚 Educational Note
Use the script as a learning layer for understanding how perpetual premium, perpetual discount, basis drift, basis velocity, and spot-reference behavior can combine into a cleaner derivatives-context read.
Indicator

Funding Carry Stress Map [AGPro Series]Funding Carry Stress Map
🧠 Core Idea
Is the market carrying a hidden derivatives premium or discount that is becoming crowded enough to matter?
📌 Overview / What it does
Funding Carry Stress Map is a crypto derivatives context tool designed to estimate when perpetual-style premium, carry pressure, basis drift, and volatility-adjusted crowding are becoming structurally relevant on the chart.
The script compares the active chart symbol against a user-selected spot reference, builds a smoothed carry baseline, measures premium/discount deviation, evaluates persistence, and converts the result into a visual carry stress framework. It produces a projected carry stress corridor, state labels, right-side tags, alerts, and a compact AG Pro dashboard.
It does not read official exchange funding payments, automate trades, predict future price direction, or promise that elevated carry stress must reverse. It is a structured analytical layer for reading derivatives pressure, premium imbalance, discount imbalance, carry squeeze risk, and cooling behavior.
🎯 Purpose & Design Philosophy
This script was built to fill a gap in the public AGProLabs lineup: most chart tools focus on trend, volume, support/resistance, momentum, or volatility. Crypto traders also need a clean way to think about derivatives-side pressure without turning the chart into a noisy data terminal.
The design goal is to make carry stress visible as a chart story. Instead of showing only a raw spread number, the script asks whether premium/discount is large, unusual, persistent, and supported by enough volatility context to deserve attention.
It is built for traders who want to monitor crowded long carry, crowded short carry, squeeze risk, and stress cooling while still making their own decisions from broader market context.
⚡ Why This Script Is Different
Most tools either show generic premium/basis values or treat funding-related pressure as a simple bullish/bearish signal.
This script does NOT claim to know the next candle, does NOT treat carry pressure as an automatic reversal signal, and does NOT depend on official funding-rate feeds that may not be available on every chart.
Instead, it converts spot-vs-active-symbol premium behavior into a structured carry stress map: premium size, normalized basis deviation, persistence, volatility rank, price reaction, and cooling behavior are combined into one visual decision-support framework.
⚙️ Methodology
1. Context Detection
The script reads the active chart price and a spot reference. By default, it automatically builds that reference from the chart base currency, selected exchange, and selected quote.
2. Reference Mapping
The premium series is smoothed into a carry baseline. The script then measures how far current premium/discount has moved away from that baseline.
3. Reaction Evaluation
The model evaluates basis z-score, absolute premium percentage, persistence across a recent window, volatility rank, and whether price is starting to reject the crowded side.
4. Visual Output
The result is displayed as a carry stress corridor, event labels, right-side tags, and a dashboard panel showing state, stress score, premium, basis z-score, persistence, volatility rank, and current interpretation.
🗺️ How to Read the Chart
The carry stress corridor represents the active price area where derivatives-side pressure is being monitored.
Labels mark important state transitions such as premium stress, discount stress, carry squeeze risk, and carry cooling.
Colors communicate state:
• Pink = positive carry / long-crowding stress
• Teal = negative carry / short-crowding stress
• Yellow = squeeze-risk reaction
• Indigo = cooling or neutralization
The panel summarizes the current condition so the user can quickly read whether carry pressure is low, watch-level, elevated, or extreme.
🚦 Signals & States
• Premium Stress → positive premium/carry pressure is active and persistent enough to monitor
• Discount Stress → negative premium/discount pressure is active and persistent enough to monitor
• Carry Squeeze Risk → elevated carry pressure is present while price begins reacting against the crowded side
• Carry Cooling → previously meaningful carry stress has faded below the model’s cooling zone
• Reset → no active carry imbalance is strong enough to dominate the current read
🔔 Alerts Logic
Alerts trigger when the internal state changes into one of the selected alert conditions.
Premium Stress alerts mark a transition into meaningful positive carry pressure.
Discount Stress alerts mark a transition into meaningful negative carry pressure.
Carry Squeeze Risk alerts mark a transition where crowded carry pressure and adverse price reaction align.
Carry Cooling alerts mark a transition where carry stress has materially faded.
Alerts are attention markers, not trade instructions.
🧩 Confluence Logic
The strongest context appears when multiple components align:
When premium size + basis z-score + persistence + volatility rank align, the carry stress score becomes more meaningful.
When that elevated score also appears with price rejection against the crowded side, the context shifts from simple premium/discount monitoring into potential squeeze-risk awareness.
📊 When to Use
• Crypto perpetual and futures markets where a spot reference can be selected
• Perpetual charts compared against their closest spot market
• High-interest crypto pairs where basis and carry pressure can influence behavior
• Volatile sessions where crowded positioning may matter more than usual
• Market regimes where traders want to monitor long-crowd or short-crowd pressure
⚠️ When NOT to Use
• Illiquid symbols with unreliable spot or futures pricing
• Charts where the selected spot reference is not comparable to the active symbol
• Markets with very noisy or fragmented data
• Extreme news events where spread behavior can become unstable
• Non-crypto symbols unless the user deliberately selects a meaningful reference
🎛️ Key Inputs
• Auto Spot Reference → automatically builds the spot reference from the chart base currency, selected exchange, and selected quote
• Carry Baseline Length → controls how quickly the premium baseline adapts
• Stress Normalization Lookback → controls how far back the script looks to judge unusual basis behavior
• Persistence Window → measures whether carry pressure persists across several bars
• Premium Stress Threshold % → defines the minimum premium/discount level required for active stress
• Reference Mismatch Guard % → prevents mismatched symbols from being interpreted as real carry stress
• Basis Z-Score Threshold → defines how unusual the spread must be before stress can activate
• Visual Settings → control corridor projection, labels, right-side tags, bar colors, and font sizes
🖥️ Interface & Visual Design
The interface is designed around a premium first-glance chart story.
The corridor gives the chart an active visual anchor. The centered label explains the current stress read without forcing the user to inspect every panel row. Right-side tags keep the current state visible near the active price area.
The panel uses the AG Pro layout standard with a blue merged header row, adjustable location, adjustable theme, and adjustable font size.
🧪 Practical Usage Workflow
1. Apply the script to a perpetual or futures chart.
2. Keep Auto Spot Reference enabled, or manually select the closest matching spot market.
3. Read the panel state and stress score.
4. Check whether the corridor is neutral, premium-stressed, discount-stressed, or showing squeeze risk.
5. Evaluate price reaction around the corridor together with broader market structure, volatility, and risk rules.
🔍 Interpretation Guidelines
Treat carry stress as a context layer.
Premium stress can mean long-side carry is becoming crowded, but it does not automatically mean price must fall.
Discount stress can mean short-side carry is becoming crowded, but it does not automatically mean price must rise.
Carry squeeze risk is stronger when elevated stress and adverse price reaction appear together, but it still requires confirmation from broader market context.
🚫 What This Script Is NOT
This script is not a prediction engine.
This script is not financial advice.
This script is not an auto trading system.
This script is not a guaranteed signal engine.
This script does not read official funding payment data directly.
This script does not claim that premium or discount must immediately mean-revert.
⚠️ Limitations & Transparency
The script estimates carry stress from active-symbol versus spot-reference behavior. It is a proxy framework, not an official exchange funding-rate feed.
Results can vary by exchange, symbol mapping, liquidity, timeframe, and data quality.
The selected reference must match the active market. Auto Spot Reference is enabled by default to help keep ETH charts on an ETH reference, BTC charts on a BTC reference, and similar mappings aligned.
Fast market moves, low liquidity, stale references, or mismatched symbol selections can affect the accuracy of the stress interpretation.
Market conditions change, and the same stress score may behave differently across different volatility regimes.
🧠 Market Context Notes
In crypto markets, derivatives pressure can matter because perpetual traders may become crowded on one side when premium, basis, and volatility remain elevated.
This does not create certainty. It creates context.
The value of the script is strongest when the user combines carry stress with structure, liquidity, trend quality, volatility, and disciplined risk management.
🧾 Use Case Examples
When price trades above the spot reference with persistent premium and the panel shifts into Premium Stress, the user may monitor whether long-side carry is becoming crowded.
When price trades below the spot reference with persistent discount and the panel shifts into Discount Stress, the user may monitor whether short-side pressure is becoming crowded.
When elevated carry stress appears and price starts rejecting the crowded side, the Carry Squeeze Risk state can help highlight a context worth closer attention.
🧱 System Philosophy
Funding Carry Stress Map follows the AGProLabs principle of building decision-support maps rather than prediction tools.
The script is designed to make hidden context easier to see, not to replace judgment.
Its purpose is to organize information into a cleaner visual workflow: read the state, inspect the corridor, evaluate reaction, and confirm with broader context.
🔐 Non-Promise Statement
No script can guarantee market direction.
No carry stress model can remove uncertainty.
This tool helps organize context; it does not create certainty.
📉 Risk Disclosure
Trading involves risk.
Crypto derivatives can be highly volatile and may involve leverage, liquidation risk, exchange risk, funding-cost changes, and rapid market movement.
This script is for educational and analytical purposes only.
It does not provide financial advice or guaranteed trading outcomes.
Users remain responsible for their own decisions.
📚 Educational Note
Use the script as a learning layer for understanding how premium, discount, persistence, volatility, and price reaction can combine into a more complete derivatives-pressure read.
Indicator

Crypto Futures Basis Tracker (Annualized)🧩 What is Basis Arbitrage
Basis arbitrage is a market-neutral trading strategy that exploits the price difference between a cryptocurrency’s spot and its futures markets.
When futures trade above spot (called contango), traders can buy spot and short futures, locking in a potential yield.
When futures trade below spot (backwardation), the reverse applies — short spot and go long futures.
The yield earned (or cost paid) by holding this position until expiry is called the basis. Expressing it as an annualized percentage allows comparison across different contract maturities.
⚙️ How the Indicator Works
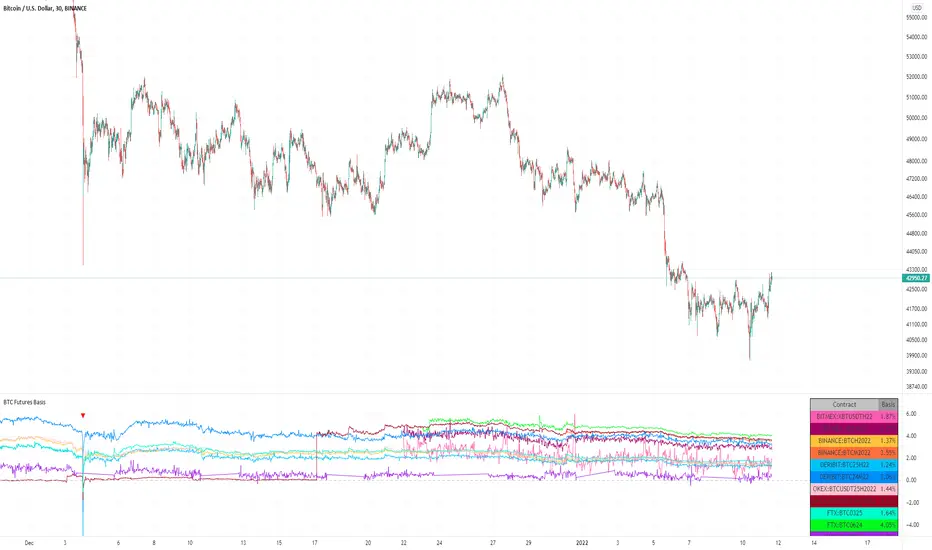
This tool calculates the annualized basis for up to 10 cryptocurrency futures against a chosen spot price.
You select one spot symbol (e.g., BITSTAMP:BTCUSD) and up to 10 futures symbols (e.g., DERIBIT:BTCUSD07X2025, DERIBIT:BTCUSD14X2025, etc.).
The script automatically computes the days-to-expiry (DTE) and the annualized basis for each future.
A table displays for each contract: symbol, expiry date, DTE, last price, and annualized basis (%) — making it easy to compare the forward curve across maturities.
⚠️ Risks and Limitations
While basis arbitrage is often considered low-risk, it’s not risk-free:
Funding and financing costs can erode returns, especially when borrowing or using leverage.
Exchange or counterparty risk — if one leg of the trade fails (e.g., exchange default, margin liquidation), the hedge breaks.
Execution and timing risk — the basis can tighten or invert before both legs are opened.
Liquidity differences — thin futures may have large bid-ask spreads or slippage.
Use this indicator for analysis and monitoring, not as an automated trading signal.
Disclaimer: Please remember that past performance may not be indicative of future results. Due to various factors, including changing market conditions, the strategy may no longer perform as well as in historical backtesting. This post and the script don't provide any financial advice.
Indicator

Indicator

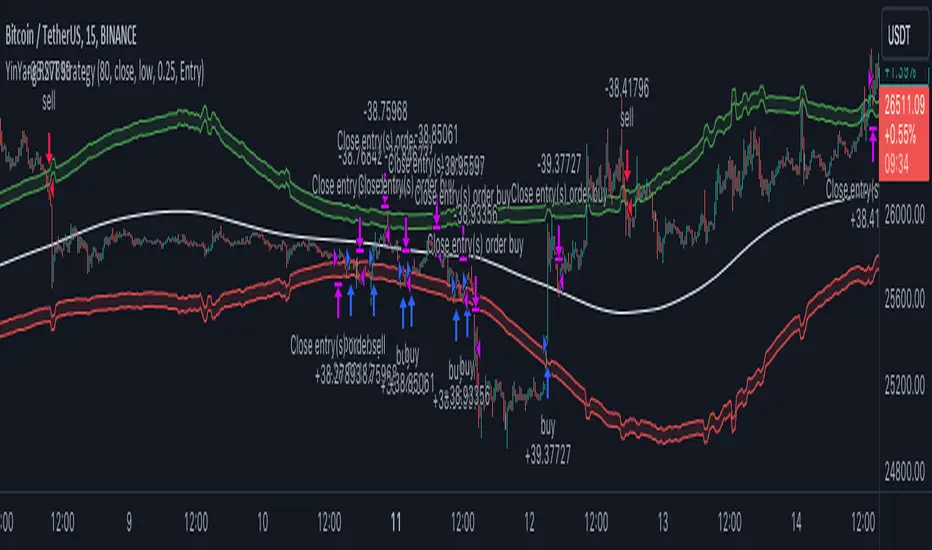
YinYang RSI Volume Trend StrategyThere are many strategies that use RSI or Volume but very few that take advantage of how useful and important the two of them combined are. This strategy uses the Highs and Lows with Volume and RSI weighted calculations on top of them. You may be wondering how much of an impact Volume and RSI can have on the prices; the answer is a lot and we will discuss those with plenty of examples below, but first…
How does this strategy work?
It’s simple really, when the purchase source crosses above the inner low band (red) it creates a Buy or Long. This long has a Trailing Stop Loss band (the outer low band that's also red) that can be adjusted in the Settings. The Stop Loss is based on a % of the inner low band’s price and by default it is 0.1% lower than the inner band’s price. This Stop Loss is not only a stop loss but it can also act as a Purchase Available location.
You can get back into a trade after a stop loss / take profit has been hit when your Reset Purchase Availability After condition has been met. This can either be at Stop Loss, Entry or None.
It is advised to allow it to reset in case the stop loss was a fake out but the call was right. Sometimes it may trigger stop loss multiple times in a row, but you don’t lose much on stop loss and you gain lots when the call is right.
The Take Profit location is the basis line (white). Take Profit occurs when the Exit Source (close, open, high, low or other) crosses the basis line and then on a different bar the Exit Source crosses back over the basis line. For example, if it was a Long and the bar’s Exit Source closed above the basis line, and then 2 bars later its Exit Source closed below the basis line, Take Profit would occur. You can disable Take Profit in Settings, but it is very useful as many times the price will cross the Basis and then correct back rather than making it all the way to the opposing zone.
Longs:
If for instance your Long doesn’t need to Take Profit and instead reaches the top zone, it will close the position when it crosses above the inner top line (green).
Please note you can change the Exit Source too which is what source (close, open, high, low) it uses to end the trades.
The Shorts work the same way as the Long but just opposite, they start when the purchase source crosses under the inner upper band (green).
Shorts:
Shorts take profit when it crosses under the basis line and then crosses back.
Shorts will Stop loss when their outer upper band (green) is crossed with the Exit Source.
Short trades are completed and closed when its Exit Source crosses under the inner low red band.
So, now that you understand how the strategy works, let’s discuss why this strategy works and how it is profitable.
First we will discuss Volume as we deem it plays a much bigger role overall and in our strategy:
As I’m sure many of you know, Volume plays a huge factor in how much something moves, but it also plays a role in the strength of the movement. For instance, let’s look at two scenarios:
Bitcoin’s price goes up $1000 in 1 Day but the Volume was only 10 million
Bitcoin’s price goes up $200 in 1 Day but the Volume was 40 million
If you were to only look at the price, you’d say #1 was more important because the price moved x5 the amount as #2, but once you factor in the volume, you know this is not true. The reason why Volume plays such a huge role in Price movement is because it shows there is a large Limit Order battle going on. It means that both Bears and Bulls believe that price is a good time to Buy and Sell. This creates a strong Support and Resistance price point in this location. If we look at scenario #2, when there is high volume, especially if it is drastically larger than the average volume Bitcoin was displaying recently, what can we decipher from this? Well, the biggest take away is that the Bull’s won the battle, and that likely when that happens we will see bullish movement continuing to happen as most of the Bears Limit Orders have been fulfilled. Whereas with #2, when large price movement happens and Bitcoin goes up $1000 with low volume what can we deduce? The main takeaway is that Bull’s pressured the price up with Market Orders where they purchased the best available price, also what this means is there were very few people who were wanting to sell. This generally dictates that Whale Limit orders for Sells/Shorts are much higher up and theres room for movement, but it also means there is likely a whale that is ready to dump and crash it back down.
You may be wondering, what did this example have to do with YinYang RSI Volume Trend Strategy? Well the reason we’ve discussed this is because we use Volume multiple times to apply multiplications in our calculations to add large weight to the price when there is lots of volume (this is applied both positively and negatively). For instance, if the price drops a little and there is high volume, our strategy will move its bounds MUCH lower than the price actually dropped, and if there was low volume but the price dropped A LOT, our strategy will only move its bounds a little. We believe this reflects higher levels of price accuracy than just price alone based on the examples described above.
Don’t believe us?
Here is with Volume NOT factored in (VWMA = SMA and we remove our Volume Filter calculation):
Which produced -$2880 Profit
Here is with our Volume factored in:
Which produced $553,000 (55.3%)
As you can see, we wen’t from $-2800 profit with volume not factored to $553,000 with volume factored. That's quite a big difference! (Please note previous success does not predict future success we are simply displaying the $ amounts as example).
Now how about RSI and why does it matter in this strategy?
As I’m sure most of you are aware, RSI is one of the leading indicators used in trading. For this reason we figured it would only make sense to incorporate it into our calculations. We fiddled with RSI for quite awhile and sometimes what logically seems to be the right way to use it isn’t. Now, because of this, our RSI calculation is a little odd, but basically what we’re doing is we calculate the RSI, then turn it into a percentage (between 0-1) that can easily be multiplied to the price point we need. The price point we use is the difference between our high purchase zone and our low purchase zone. This allows us to see how much price movement there is between zones. We multiply our zone size with our RSI multiplication and we get the amount we will add +/- to our basis line (white line). This officially creates the NEW high and low purchase zones that we are actually using and displaying in our trades.
If you found that confusing, here are some examples to why it is an important calculation for this strategy:
Before RSI factored in:
Which produced 27.8% Profit
After RSI factored in:
Which produced 553% Profit
As you can see, the RSI makes not only the purchase zones more accurate, but it also greatly increases the profit the strategy is able to make. It also helps ensure an relatively linear profit slope so you know it is reliable with its trades.
This strategy can work on pretty much anything, but you should tweak the values a bit for each pair you are trading it with for best results.
We hope you can find some use out of this simple but effective strategy, if you have any questions, comments or concerns please let us know.
HAPPY TRADING! Strategy

Indicator

Indicator

Indicator

Indicator

Indicator