Hash RibbonsBuying during Miner Capitulation yields wonderful returns.
The best buy signals occur on Hash Rate "recovery", and when price momentum is also positive.
Historically, this strategy has yielded average returns to cycle peak of >5000%, with max Drawdown of -15%.
Follow me to learn more about this indicator.
Bitcoin (Cryptocurrency)

Fabonacci Trailer - [Alerts]This script comes with the following indicators and features:
ADX indicator
Chop indicator
Super Trend indicator
Trailing Take Profit and Stop Loss
Entry, Take Profit, and Stop Loss Alerts
Renko chart support
And a few more indicators in the back-end to increase accuracy and optimize entries
This script works really well as a scalper on lower Time Frames as well as on higher Time Frames. Besides that you can also use it on pretty much any coin or asset.
This script is not repainting. We advise to use alerts on “Once Per Bar Close”.
If you’d like to automate this script you can do that by using AutoView, ProfitView, ProfitTrailer, CryptoHopper etc.
Please note that this script is based on invite only.

BTC Volume absolute (fiat vs Tether vs futures)BTC volume split by fiat, Tether and futures in USD
fiat = COINBASE + BITFLYER + BITSTAMP + KRAKEN
Tether = BITFINEX + BINANCE + HUOBI + HITBTC
futures = BITMEX + BYBIT

MA Crossover [Alerts]This is a Moving Average Crossover study .
The study comes with all alerts (Long, Short, Take Profit, and Stop Loss).
A few visuals like Exit Loss and Profit/Loss Boxes have been added as well.
The following Moving Averages are supported:
SMA
EMA
DEMA
TEMA
WMA
VWMA
SMMA
HullMA
LSMA
ALMA
SSMA
TMA
ZLEMA
If you’d like to automate this script you can do that by using AutoView, ProfitView, ProfitTrailer, CryptoHopper etc.
Feel free to leave a comment and share it with your friends. Enjoy!

True Trend BTC (Conquer Trading & Investing)Bitcoin tends to really trend for long period of times, whether it’s up or down. It’s a trending asset because it’s a new asset, full of price discovery.
I really hope this indicator is instrumental in your Bitcoin trading, it really does an outstanding job in defining the trend and helping you stay with it.

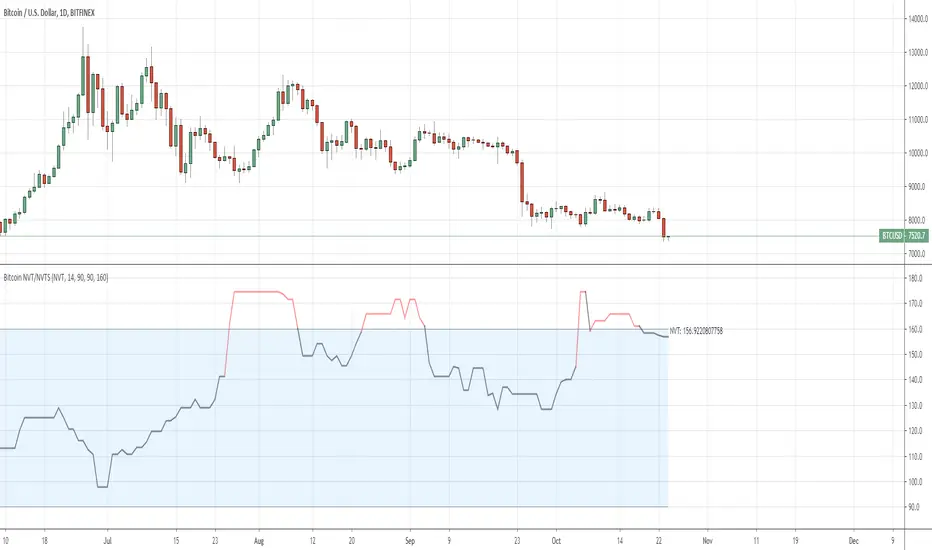
QuantNomad - Bitcoin NVT/NVTSIn this script I included 2 quite interesting indicators for Bitcoin:
* NVT (Network Value to Transactions Ratio)
* NVTS (NVT Signal)
Both indicators are based on Bitcoin Network Value (Market Cap) and 24h transaction volume.
For both these values I'm using Quandl datasets from Blockchainc.com:
market_cap: QUANDL:BCHAIN/MKTCP
transac_vol: QUANDL:BCHAIN/ETRVU
Calculation for both indicators are pretty simple:
NVT = median(market_cap / transac_vol, 14 bars)
NVTS = market_cap / sma(transac_vol, 90 bars)
NVT and NVTS are cryptocurrency's answers to P/E ratio. They can help you to understand if bitcoin is under/overvalued.
When NVT or NVTS is relatively high it can be a pretty good point to short bitcoin, if it's low it good time to buy bitcoin.
NVT Ratio - was created by Willy Woo
NVT Signal - was created by Dimitry Kalichkin
Because of different sources of transaction volume data, these indicators can differ in values from originals, but magnitude should be the same.
This is a pretty simple example where you can select only static overbought/oversold levels and when indicator will be above/below it you will see in changing in color.
I have many more things in my head how these indicators can be developed further and what strategies can be derived from them, but as is they can be a pretty good base for you. Will share my advanced findings later.
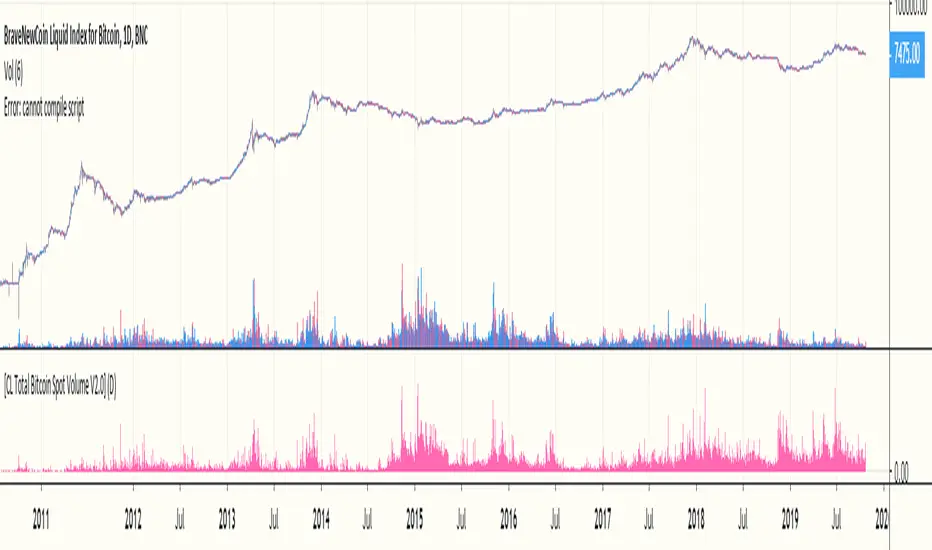
[CL Total Bitcoin Spot Volume V2.0]Total bitcoin volume across all trading pairs, includes historical data too such as mtgox and btcchina as well as almost all pairs on newly sprung up exchanges.
Volume charts are stitched together so adding indicators on top of this might not work.
OracleWhere to use?
Oracle gives the best performance on ETH/USD but also works for BTC/USD and some other charts like XAU/USD ( Gold ). Fails for almost all other cryptocurrencies.
Use 1d or 4h time frames only. 2h and 3h also work in some cases. Use Heikin Ashi candles for the best results.
The strategy is still being tested. Use at your own risk.
How to use?
Arrows start pointing upwards and candle closes above the Orange line - Price is likely to go up
Arrows start pointing downwards and candle closes below the Orange line - Price is likely to go down
Also, the orange line can be used as a mental stop loss point.

MKAST-IndexThis is one of my free for all Indicators.
The TJ-Index is something I have been working on for quite a while and always was wanting to have on my charts, yet it took me longer than expected to finally finish it.
Now it is done and you can simply favourite this script and add it to your chart.
It is made out of 2 main parts.
Part 1:
15 Indicators and conditions like
-Delta MACD,
-Crypto Indicator,
-RSI,
-MACD,
-Momentum,
-CCI,
-OBV,
-Stochastic,
-CMF,
-Raw Buy and Sell Volume Domination,
-Super Guppy,
-Ichimoku,
-DIOSC,
-Volume Weighted MACD,
-Golden cross/Death Cross
Part 2:
The white line - the index itself.
So how this works is, you see 15 horizontal lines in green and red alternating, mentioned in that order above, if a bullish condition islet the horizontal line turn green, if it is a bearish condition, it is red.
The white index line, is basically depicting the number of bullish conditions at the same time.
I have seen that it is extremely powerful for divergences and especially thinking to take any position, checking if the index is high or low at the time.
An extra feature is that if ALL bullish or bearish conditions are met, the background of the oscillator will color itself green or red.
You can also turn on and off the horizontal lines for the easier user of the TJ-Index.
For now, the code will remain hidden, since I still have some important parts of this Index in my main Invite Only Indicator.
I will be publishing an open version of the TJ-Index soy ou can incorporate it in your own indicators.
Should you be interested in my main indicator or scripting work, feel free to DM me.

Codex NY|LDN SessionsPRIVATE SCRIPT published strictly for use/testing by close acquaintances for the Bitcoin and cryptocurrency markets.
Study shows London and New York trading sessions to help provide a closer look at how traditional hours/futures can/do effect the market.

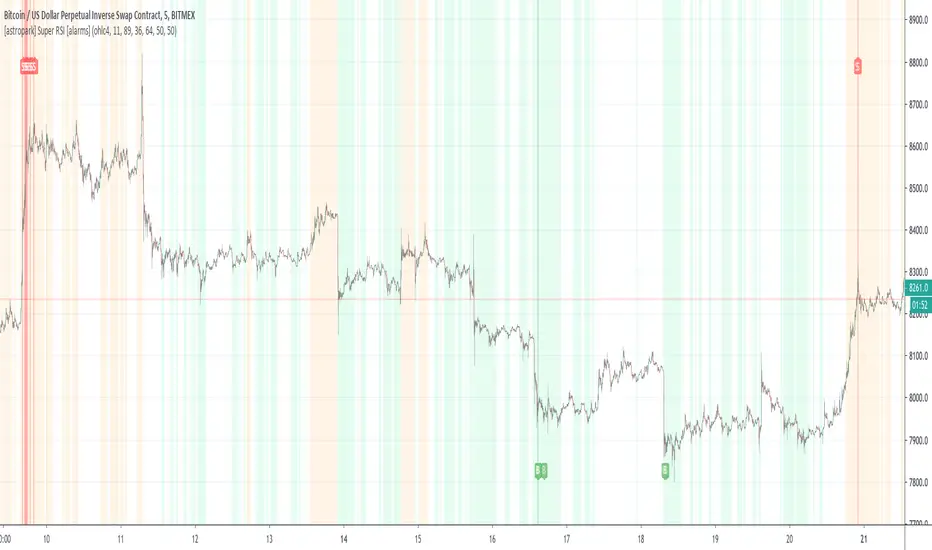
[astropark] Super RSI [alarms]Dear Followers,
today a new Scalper Tool , which works great on 3 minutes and 5 minutes timeframes , but also down to 1m and up to 30m!
I called it " Super RSI ", as it is based on RSI and inherits some basic functionality from it.
If you check its settings, you will see that you can have 3 different buy-sell sources (first two are active by default):
STRONG BUY/SELL : buy when white area deeply falls into oversold-red zone and sell when white area gets into overbought-green zone (you can set and edit at which level oversold and overbought zones start);
CROSSES : buy when the black RSI line in the middle between red and green area cross under the buy cross limit value and sell when it crosso over the sell cross limit value (you can set and edit specific cross ranges for both buy and sell);
WEAK BUY/SELL : buy when green area at least go below 50 level and sell when red area at least goes above 50 level (you can edit both levels); these conditions are highlighted as background color and are very useful for taking (at least partial) profits in trades.
By default the script will be placed as overlay on the chart, but
> you can activate the oscillator plot by disabling the "hide all plot" option
> and place it in a below pane by clicking on the black arrow at then end on the indicator name in chart and selecting "move to -> a new pane below"
This strategy can trigger till 10 buy or 10 sell signals in a row before reverting, so use a proper money management .
Strategy results are calculated on 20 trading days using 1000$ as initial capital and working at 10x leverage.
The user who wants to use this strategy, especially via an automated bot, must always set a stoploss at 3-5% from entry point or use a proper risk management strategy .
This is not the "Holy Grail", so use it with caution.
This script will let you set all notifications you may need in order to be alerted on each triggered signals.
The backtesting script version of this indicator, which will let you backtest this script and find best settings for your preferred market, can be found here below:
This is a premium indicator , so send me a private message in order to get access to this script .
ANN MACD BTC v2.0 This script is the 2nd version of the BTC Deep Learning (ANN) system.
Created with the following indicators and tools:
RSI
MACD
MOM
Bollinger Bands
Guppy Exponential Moving Averages:
(3,5,8,10,12,15,30,35,40,45,50,60)
Note: I was inspired by the CM Guppy Ema script.
Thank you very much to dear wroclai for his great help.
He has been a big help in the deep learning series.
That's why the licenses in this series are for both of us.
I'm sharing these series and thats the first. Stay tuned and regards!
Note : Alerts added.

Multi-EMA | 5 EMAs in 1 ScriptAdd up to 5 EMAs to your charts with this script.
Fully Customizable.
----------------------------------------
Wanna try my other scripts?
Histogram with Divergence Finder:
Willams %R with 13 EMA and Divergence Finder:
More scripts here:
www.tradingview.com
Bitcoin Logarithmic Growth CurvesThis plots logarithmic curves fitted to major Bitcoin bear market tops & bottoms. Top line is fitted to bull tops, bottom line is fitted to lower areas of the logarithmic price trend (which is not always the same as bear market bottoms). Middle line is the median of the top & bottom, and the faded solid lines are fibonacci levels in between.
Inspired by & based on a Medium post by Harold Christopher Burger, which shows how linear Bitcoin's long-term price growth is when plotted on a double-log chart (log scaling on the price AND time axis).
These curves will only make sense for tickers representing Bitcoin vs. USD (such as BITSTAMP:BTCUSD, BITMEX:XBTUSD, BLX index). Plotting on other assets will probably end up with lines that shoot off into space without any relationship to the underlying price action.
The upper, middle & lower curves can be projected into the future, which can be turned on or off in the indicator settings. The fibonacci levels can also be switched on/off. And the upper & lower curve intercepts & slopes can be tweaked.
I'm releasing this open-source, if you end up making something cool based off of this code, I don't need attribution but please hit me up on here or on twitter (same username) so I can check out what ya made. Thanks, hope y'all enjoy it.

LinReg-Bitcoin's Power Oscillator.2019.01[wozdux]Bitcoin power oscillator from Harold Christopher Burger.
Since the first day of history is the most important, it is not correct to use this indicator on young exchanges with a short history.
The oscillator is calculated based on regression lines from the first day of history to the current day. The way of calculation of the oscillator. First, the regression line from the first day of history to the current bar is calculated for each bar.
Thus, for each bar, the formula of a straight regression line of the form Y=b*x + a is calculated. Where x is the number of days elapsed from the beginning of the history to the current drill. Y is the bitcoin price of the current day (bar) on the regression line. Thus, Y Is the predicted bitcoin price that would have to be. The second stage of calculation. Now we have the real price of bitcoin for the current day and the predicted price by the regression line. We calculate the ratio of the real price to the predicted one and take the logarithm of the obtained value. G=log10(Close/Y). This value is drawn in the form of a graph of the bitcoin power oscillator. The resulting oscillator oscillates in a constant range of values from -1 to +1.
This oscillator clearly captures the moments of price reversal. At the tops, the reversal occurs when the oscillator reaches the value range from 0.6 to 0.8. In the lowlands, the reversal occurs in the range of values from -0.8 to -0.4.
Indicator setting-description of buttons from top to bottom.
1) Raise the chart by X units. This is a corrective point in order to raise the chart above/below the zero line
2) Offset the start day of the story. The first day of history is the point relative to which all regression lines, all bars are calculated. This point can be slightly corrected by shifting the initial day to the left for a certain number of days.
3) button to switch between different ways to calculate the offset (A) in the formula Y=b*x + A.
4) the Orange level is the trend line of the historical power oscillator troughs. The orange level is an inclined level of price reversal from the bottom up.
5) the Green level is an important area of likely bitcoin price reversal at the tops.
6) the Red level is the horizontal level of the price reversal from the bottom up.
....
Осциллятор мощности биткоина от Harold Christopher Burger. "Это моя попытка воспроизвести вычисления данного генератора методами Pine Script .
Поскольку первый день истории имеет самое важное значение, то использовать данный индикатор на молодых биржах с короткой историей будет не корректно.
Осциллятор вычисляется на основе линий регрессии от первого дня истории до текущего дня. Путь вычисления осциллятора. Сначала для каждого бара вычисляется линия регрессии от первого дня истории до текущего бара.
Таким образом, для каждого бара вычисляется формула прямой линии регрессии вида Y=b*x + a. Где х -это количество дней, прошедших от начала истории до текущего бура. Y- это цена биткоина текущего дня (бара) на линии регрессии. Таким образом, Y- Это предсказанная цена биткоина, которая должна была бы быть. Второй этап вычисления. Теперь у нас есть реальная цена биткоина на текущий день и предсказанная цена линией регрессии. Вычисляем отношение реальной цены к предсказанной и берем логарифм , полученнного значения. G=log10(Close/Y). Это значение рисуем в виде графика осциллятора мощности биткоина. Полученный осциллятор колеблется в постоянном диапазоне значений от -1 до +1.
Данный осциллятор четко отлавливает моменты разворота цены. На вершинах разворот происходит тогда, когда осциллятор достигает области значения от 0.6 до 0.8. В низинах разворот происходит в области значений от -0.8 до -0.4.
Настройка индикатора - описание кнопок сверху вниз.
1 ) Поднять график на Х единиц. Это корректирующий пункт для того, чтобы приподнять график выше/ниже относительно нулевой линии
2) Смещение начального дня истории. Первый день истории -это та точка оносительно которой вычисялются все линиии регрессии, всех баров. Эту точку можно немного подкорректировать, сместив начальный день влево на какое-то количество дней.
3) Кнопка переключения между разными способами вычисления смещения (A) в формуле Y=b*x + A.
4) Оранжевый уровень - это линия тренда исторических впадин осциллятора мощности. Оранжевый уровень это наклонный уровень разворота цены снизу вверх.
5) Зеленый уровень - это важная область вероятного разворота цены биткоина на вершинах.
6) Красный уровень -это горизонтальный уровень областей разворота цены снизу вверх.

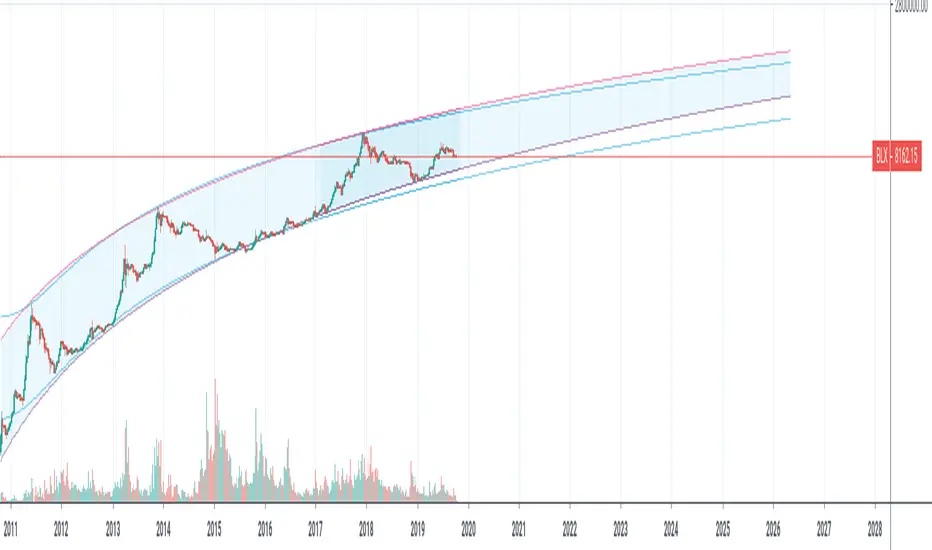
Yope BTC PL channelThis is a new version of the old "Yope BTC tops channel", but modified to reflect a power-law curve fitted, similar to the model proposed by Harold Christopher Burger in his medium article "Bitcoin’s natural long-term power-law corridor of growth".
My original tops channel fitting is still there for comparison. In fact, it looks like the old tops channel was a bit too pessimistic.
Note that these channels are still pure naive curve-fitting, and do not represent an underlying model that explains it, like is the case for PlanB's "Modeling Bitcoin's Value with Scarcity" which uses Stock-to-Flow.
The motivation for this exercise is to observe how long this empirical extrapolation is valid. Will the price of bitcoin stay in either of both channels?
Note on usage: This script _only_ works with the BLX "BraveNewCoin Liquid Index for Bitcoin" in the 1D, 3D and 1W time-frames!
It may be necessary to zoom in and out a few times to overcome drawing glitches caused by the extreme time-shifting of plots in order to draw the extrapolated part.
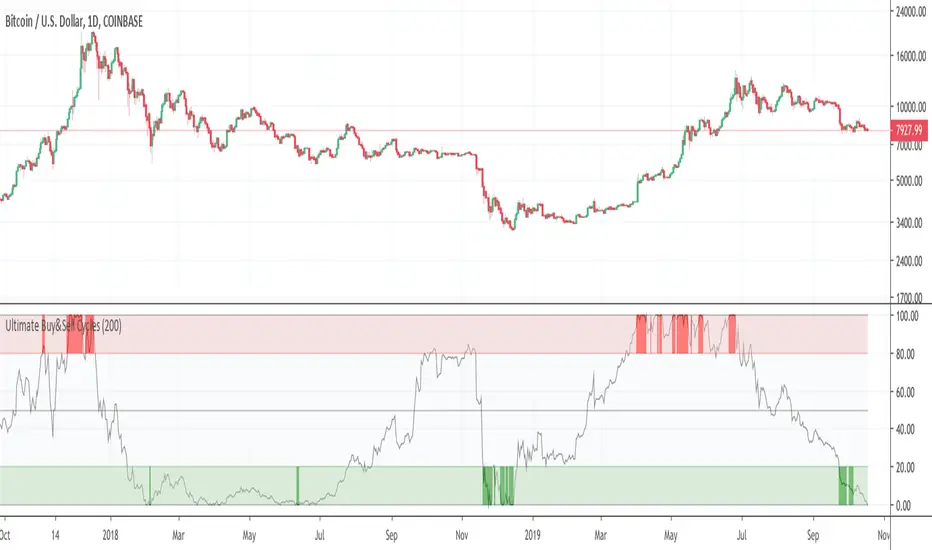
NVT Dynamic Colored with Signals [aamonkey]NVT Dynamic
This is the dynamic version of my " Bitcoin Network Value to Transactions " indicator.
The dynamic NVT indicator is based on the Network Value to Transactions.
Definition:
NVT = Network Value / Daily Transaction Volume
Advantages:
Because BTC is a very young asset, it can be a good idea to have relatively high and low NVT values that change over time.
Signals:
When the NVT turns green = buy opportunity
NVT turns red = sell opportunity

HTF Double Logarithmic Curves OscillatorThis a companion indicator for HTF Double Logarithmic Curves
This is an oscillator version of the above. When the indicator is at/near 1 then Bitcoin price is at/near the upper range of it's longterm logarithmic growth trend. When at/near 0 then price is at/near the lower range of that trend.
This indicator only works with the BLX Brave New Coin Index (ticker:BLX) and only on 1 day, 3 day, or 1 week timeframes.

Bitcoin Difficulty Model [aamonkey]This is a model to calculate Bitcoin price based on Difficulty.
How to calculate it:
BDM = (difficulty^0.51) * 0.002
For the difficulty, the daily average is used.

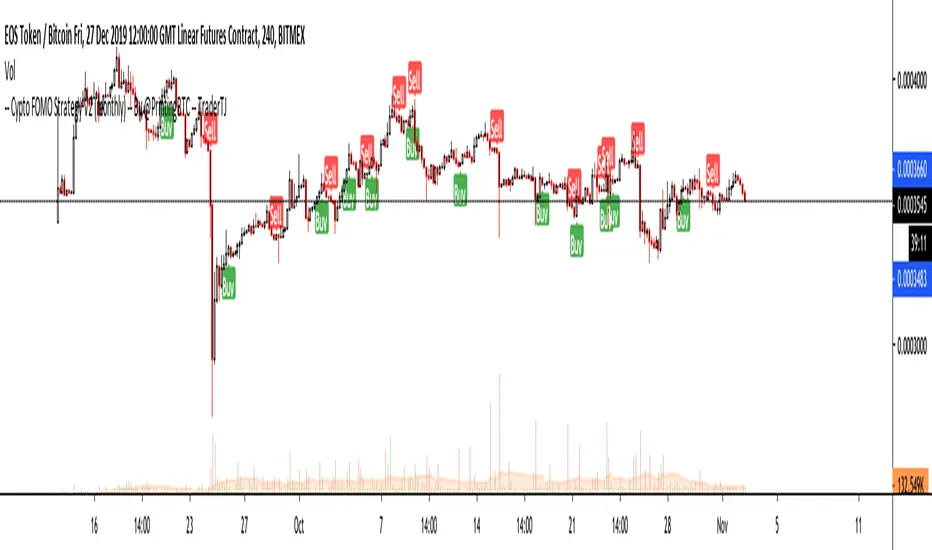
Crypto FOMO Strategy (monthly-access)PLEASE READ THE ENTIRE POST BEFORE PURCHASING & USING THE FOMO INDICATOR. Saves you and me some time in emails and messages. :)
This is the NEW MONTHLY ACCESS Version of the Crypto FOMO Strategy
Please check the links at the bottom of this post, so you find the way to our shop.
1 Month access is set at $25
10% Disount --> "FOMO25"
Any question, DM me here or on Twitter , check for link on the bottom.
The FOMO Buy Sell Indicator is a very specific strategy, cut down to its roots and made perfect for the volatile crypto market.
Many indicators focus only on one aspect, one side, one specific rule. As you know, this is not how life, the market or anything else works.
FOMO combines many different aspects at the same time, scans multiple other indicators and comes to a conclusion based on over 950 lines of code.
It is based on Divergences, Elliott Waves , Ichimoku , MACD , MACD Histogram, RSI , Stoch , CCI , Momentum, OBV, DIOSC, VWMACD, CMF and multiple EMAs.
Every single aspect is weighted into the decision before giving out an indication.
Most buy/sell indicators FAIL because they try to apply the same strategy to every single chart, which
are as individual as humans.
To conquer this problem, FOMO has a wide range of settings and variables which can be easily
modified.
To make it a true strategy, FOMO has as well settings for Take Profit Points, Multiple Entries and Stop Losses. Everything with an Alert Feature of course.
I know from experience that many people take one indicator and are simply too LAZY to add multiple indicators to make a rational choice.
The result of that is that they lose money, by following blatantly only one indicator.
FOMO has additional 7 indicators, perfect for the crypto market, which can be turned on and off.
FOMO Signals Settings
“Show Signals?” - On/Off to show the Buy/Sell Signals. “Aggressiveness” - Increase to make the signals less aggressive
and decrease to make them more aggressive.
“Show Custom FOMO Timeframe?” - On/Off to show FOMO Signals of a different timeframe in addition to the normal ones.
“Custom FOMO Timeframe?” - Choose the timeframe for the custom FOMO signals.
“Use Safe FOMO?” - On/Off to show only “safe” (less but more exact) FOMO signals.
“Safe FOMO Sells” - Settings for the “safe” FOMO Sell Signals. Decrease number for “less safe” Signals.
Increase number for “more safe” Signals.
“Safe FOMO Buys” - Settings for the “safe” FOMO Buy Signals. Decrease number for “more safe” Signals.
Increase number for “less safe” Signals.
FOMO Strategy Settings
“Take Profit 1 ” - On/Off to show TP1 points.
“Take Profit After %” - Set the percentage after which TP1 is
active.
“Take Profit 2 ” - On/Off to show TP2 points.
“Take Profit 2 After %” - Set the percentage after which TP2 is active.
“Take Profit 3 ” - On/Off to show TP3 points.
“Take Profit 3 After %” - Set the percentage after which TP3 is
active.
“Second Entry” - On/Off to show Second Entry points.
“Second Entry After %” - Set the percentage after which Second Entry is active.
“Third Entry ” - On/Off to Third Entry points.
“Third Entry After %” - Set the percentage after which Third
Entry is active.
“Stop Loss ” - On/Off to show Stop Loss points.
“Take Profit After %” - Set the percentage after which Stop Loss is active.
The FOMO Lifeguard is a special feature made to cancel out the “noice” of the signals and show only signals with a great technical significance.
For this FOMO uses the default settings of +7 and - 7. This references to an index value of multiple settings of almost all indicators used in this script.
+7 cuts out all sell signals below the index value of 7.
- 7 cuts out all buy signals above the index value of - 7.
Using the FOMO Lifeguard is a key element for a sustainable and profitable strategy.
As the normal FOMO Signals, the Lifeguard Signals are also bound to the “Aggressiveness”. Should the cut out of signals with the Lifeguard on be too big, try adjusting the “Aggressiveness”.
With this, once can choose and make this indicator PERFECT for his own strategy and trading style. Day Traders would use no “Lifeguard” and aggressive signals.
Swing Traders would use “Lifeguard” and aggressive signals.
To make the life of the FOMO user even easier, I have added all adjustable Take Profit Points, Multiple entry points and Stop Loss points.
Simply choose how many Take Profit points you would like to have and choose the percentage after which you would like to see the Take Profit point appear on the chart and notify you to take profits.
Are you a Trader who likes multiple entries? Also no problem with FOMO. Select how many additional entries you would like to have and after how many percent you would like them to appear on the chart and remind you of adding to the position.
What would a Strategy be without a Stop Loss? Same settings apply here as on the TPs and MEs .
Crypto Modified Indicators
“Show Divergences?” - On/Off to show Divergences on the Chart based on the data of 10 different indicators.
“Show Custom Divergences?” - On/Off to show Divergences on the chart of a custom timeframe.
“Custom Divergence Timeframe?” - Choose the Timeframe for which the Custom Divergences should appear on the chart.
“Show Oversold/bought?” - On/Off to change the colour of the chart in Oversold/bought conditions.
“Oversold/bought value?” - Choose a value for which the chart is Oversold/bought.
“Show Fibonacci Levels?” - On/Off to show automatic Fibonacci Levels.
“Fibonacci Lookback Lenght” - This value states how many candles from right now are taken into account to paint the Fibonacci Levels.
“Fibonacci Lookback Lenght” - Choose a custom Timeframe that should be used to paint the Fibonacci Levels.
Crypto Modified Indicators 2
“Show EMAs?” - On/Off to show three EMAs on the chart, after the example of @Teddycleps
“EMA Lenght 1” - Choose a value for the first EMA Lenght
“EMA Lenght 2 ” - Choose a value for the second EMA Lenght.
“EMA Lenght 3” - Choose a value for the third EMA Lenght.
The area between the first and third EMA is filled. Is EMA1 above 21, it’s filled green. Is it below, it’s filled red.
“Show Ichimoku? ” - On/Off to show Ichimoku on the chart.
“Show Tenkin?” - On/Off to show Tenkin on the chart.
“Tenkin” - Set the lenght of the Tenkin.
“Show Kijun?” - On/Off to show Kijun on the chart.
“Kijun” - Set the lenght of the Kijun.
“Show Senkou?” - On/Off to show the Senkou on the chart. “Senkou” - Set the lenght of the Senkou.
“Displacement” - Set the value of the Displacement.
“Show ZIG ZAG Lines?” - On/Off to show ZigZag Lines on the chart, used to identify short-term trends and EW counts.
“ZZ Lenght 1” - Set the first lenght of the ZigZag Lines.
“ZZ Lenght 2” - Set the second lenght of the ZigZag Lines.
FOMO without any doubt has Custom Alerts for all Signals that it is painting on the chart. This goes for the “Normal Signals” as well as for the “Lifeguard Signals”.
One can even choose to receive custom notifications for Take Profit points, Multiple Entry points and the Stop Loss points.
The signals appear on the chart DURING the candle, not at the end of the candle. Therefore, the alerts do this as well. These appear during the candle.
Here we can see all of the possible Alerts that can be chosen to be displayed. In total it is 30 different custom alerts, based on what the trader is looking for and how he is trading.
Personally, I have 10-15 coins that I trade the most and for these I have custom notifications, mostly though only the SAFE FOMO Buy and Sell Signals.
To activate Alerts for FOMO
1) Go to the “ALERT” icon on the top tool bar of your Tradingview.
2) Select “CONDITION” as “—Crypto FOMO Strategy—“
3) Then choose ONE condition from the list of conditions.
4) On “OPTIONS” you can set how many times it appears, I have “Once per Bar”.
4.1) If you want to make sure that the signal is truly there and not just a condition for a second during the candle, choose “ONCE PER BAR CLOSE”.
5) “Expiration Time” sets the time until the alert expires. PRO users have no expiration for alerts.
6) “Alert Actions” give you a row of choices what happens and how you want to be notified.
7) “Message” is the message that you receive inside the notification.
AFTERWORD/DISCLAIMER
FOMO has been created after my goal to #MakeCryptoProfessionalAgain. Every aspect of it has its own and very specific use, which traders have shown to find useful in their trading.
This Indicator is meant to help new and experienced traders to understand the various aspects of this market and access all of the most important and most commonly used tools, with JUST ONE CLICK.
FOMO should be used responsibly and treated as an indicator. Signals, scripts, algorithms can NEVER be 100% exact. It is up to the trader to make a well thought and educated decision, wether to follow a signal or not. Our brains are way more advanced than any indicator and algorithm.
I advise especially for this reason to have not just the signals turned on. Please do not use the SAME settings for each chart. Look which Aggressiveness and Lifeguard Settings fit your chart the most, you will be amazed how well some charts work with FOMO.
FOMO should NOT make you FOMO into a trade anymore. It should teach you to make more educated decisions and especially for margin trading reduce the risk of liquidation.
Should you have problems with being liquidated multiple times, I advise to use the “STOP LOSS” function.
Most importantly, enjoy the indicator and trading in general.
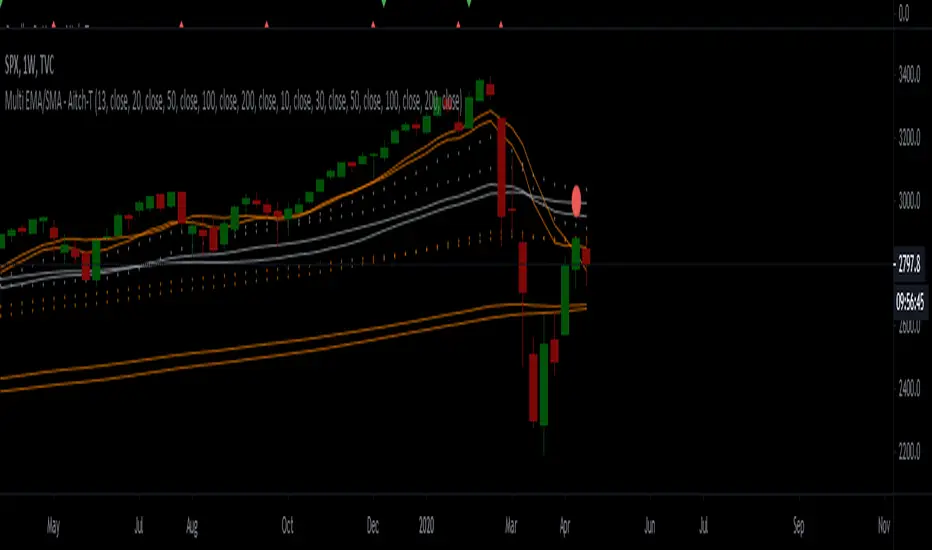
Metcalfes Law - Bitcoin Fair PriceMetcalfe's Law has been successfully used to value a variety of network effect technologies and businesses, including Facebook and Tencent.
Applying Metcalfe's Law to Bitcoin, using "Daily Active Addresses" (DAA) as the "n" value, yields interesting results.
Historically, Bitcoin has tracked the Metcalfe Law Fair Price reasonably well. A number of studies have been performed over recent years which validate this and have used various derivations of Metcalfe’s Law. Note: this indicator sticks to the original Metcalf’s Law.
Prior to 2018, every time Bitcoin was above the Metcalfe’s Law fair price (calculated using a default “A” of 0.5 here), a bubble had formed, and price quickly reverted back down to the mean.
Nonetheless, since February 2018, Metcalfe's Law Fair Price has remained below the actual Bitcoin price, suggesting Bitcoin is currently overvalued.
There may be a few reasons for this:
1. Possibility A: Bitcoin may still be extremely overvalued. Since the December 2017 peak, Bitcoin has only reverted to the Metcalfe’s Law Fair Price briefly during the December 2018 bottom. If this case is true, there could be further to fall unless DAA numbers pick up to fill the gap.
2. Possibility B: The introduction of side-chains, private transactions and the Lightning Network may have fundamentally altered the effectiveness of using DAA to value Bitcoin. As more daily transactions are completed off-chain, or on large platforms/exchanges which use fewer addresses, the relative number and growth of DAA may be misrepresented and artificially low. In this case, DAA as it is reported today is no longer useful in assessing the fair value of Bitcoin with Metcalfe’s Law and this Indicator is effectively useless.
3. Possibility C: Neither of the above are true. We are just in an anomalous period in which price and Metcalfe’s Law Fair Price have deviated from the mean for an extended period (and will meet again in the future, potentially at a higher price).
4. Possibility D: Metcalfe’s Law doesn’t really work for Bitcoin.
I am inclined to believe Possibilities “C” and “D” are unlikely. Given the way Bitcoin infrastructure is being developed and used in 2019, Possibility “B” seems the most likely, as this case is supported by the fact that a number of other metrics indicate that Bitcoin is currently on the lower side of “fair value” (including Dynamic Range NVT Signal).
Regardless, Possibility “A” remains a strong candidate. Only time will tell. It will be interesting to check back on this indicator in 12-24 months time. Hopefully this indicator has been proven redundant by then.

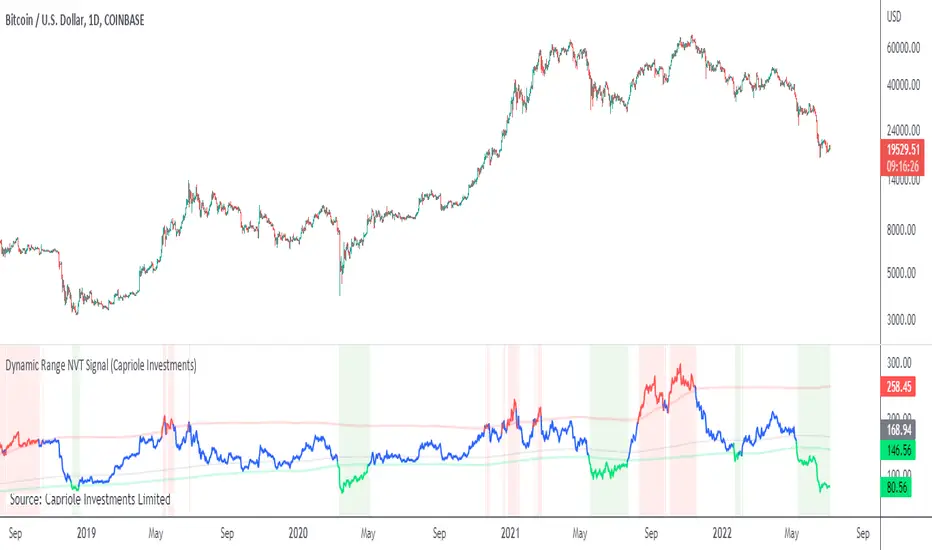
Dynamic Range NVT SignalABOUT DYNAMIC RANGE NVT SIGNAL
NVT Signal (Credit: Willy Woo and Dmitry Kalichkin) is akin to a "PE" ratio for Bitcoin , and can be used to identify when Bitcoin is overbought or oversold based on the relative value of transactions sent across the network.
This indicator includes a 2 year moving average and standard deviation to identify outlier values, instead of declaring a static high-low range for relative valuation.
THEORY
A dynamic "high-low" range was chosen for the following reasons:
- Bitcoin is only 10 years old, it is likely that relatively "high" and relatively "low" NVT values will change with time, as have PE ratios over the last century.
- Some transactions are now made off-chain (eg. Liquid Network's private side-chain which is used by many major exchanges). If this trend continues, we can expect "normal" NVT ranges to increase with time (as the relative portion of public on-chain transaction values decreases).
CALCULATION
- NVT = Circulating Market Cap / 90 average On-chain Transaction Value*
- Overbought (default): NVT > 2-year mean + 2*standard deviations. I.e. NVT Signal is in the top 2.5% of values for the prior 2 years.
- Oversold (default) NVT < 2-year mean - 0.5 * standard deviations.**
*Data source: Blockchain.info, estimated transaction value does not include returned to sender as change.
**Oversold under 2-year mean was chosen due to the skewness of NVT Signal, it is not normally distributed. For example: NVT Signal has never been less than the 2-year mean - 2* standard deviations. This may change in the future.
NOTES ON USAGE
- Use with care. Bitcoin can remain "overbought" or "oversold" for extended periods (eg. 2015-2016).
- As Bitcoin ages, the validity of NVT Signal will need to be monitored. Particularly with respect to potentially increasing use of side-chains, private transactions and potentially the lightning network.
- It is likely that a 2-year “look back period” for calculating mean and standard deviation will not be sufficient in the decades to come. As Bitcoin matures and stabilizes (some time in the future), a longer "look back period" should probably be used. To allow for this, the defaults for this indicator can be easily adjusted.