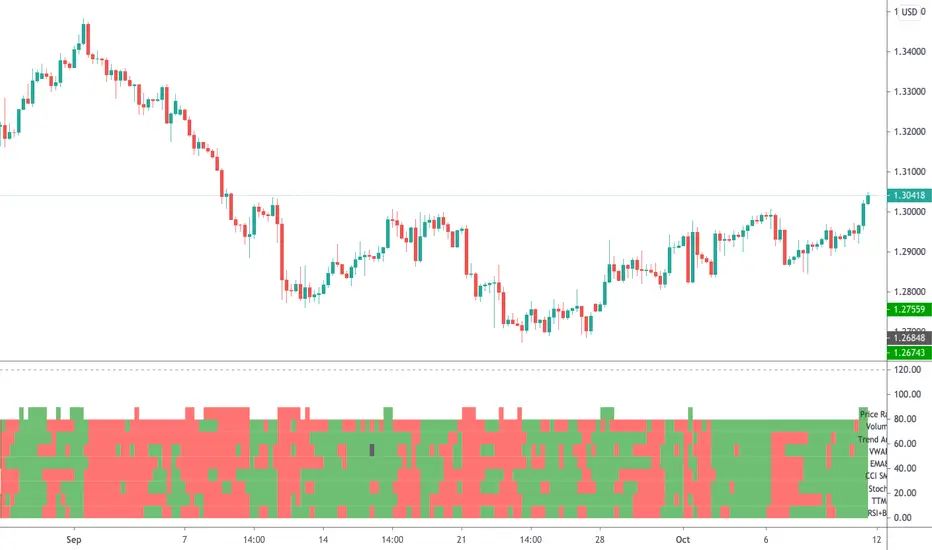
Radar Screen v3This is a combination of various indicators that very rarely conflict, thus giving us a good understanding:
- "Price Rally" detecting whether price is rallying, giving us confidence it will continue.
- Volume - knowing volume is going with the trend is a good confidence check.
- Trend Angle - This will go red or green depending on whether the price angle is going up or down, taken over three bars.
- VWAP for all of these stock traders.
- EMA8 is a very sensitive moving average, good for short term trades.
- CCI SMA is a strategy I commonly use, please check out my other indicators for a functional description.
- Stochastics is used throughout many systems.
- RSI BB shows where price is rebounding of the bollinger band and then moving up or down.
As per all of my indicators, the system is simple - The more green lines you see, the stronger the buy signal. The more red lines you see, the stronger the sell. If its a 50/50 mix of red and green, then don't trade.
I can customise this further or add other strategies, please message me.
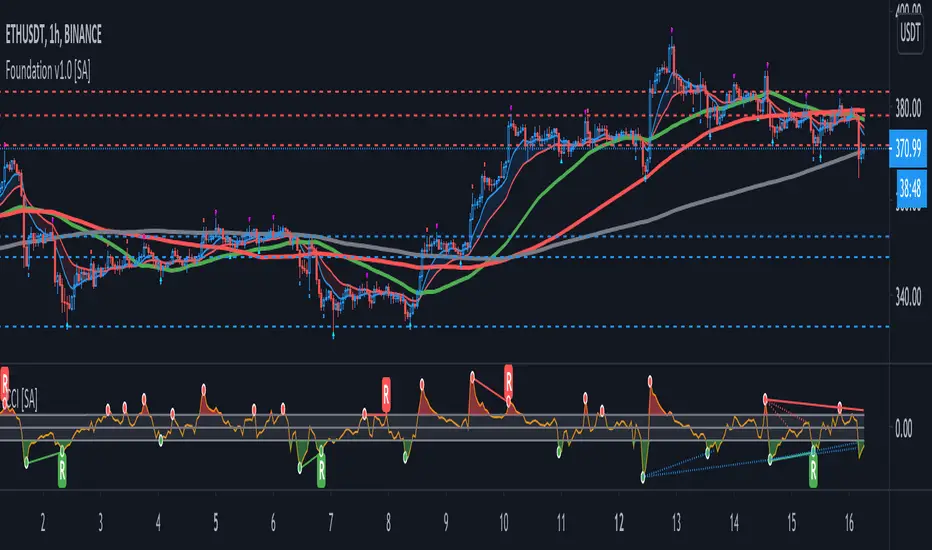
Commodity Channel Index (CCI)
CCI & EMA_CROSS_PaydarCCI & EMA_CROSS_Paydar
Hello everyone
This indicator is actually a very efficient oscillator,
This system is a unique combination of indicators CCI and EMA, which of course has special settings, these settings are adjusted as much as possible due to signaling.
As you can see in the picture:
CCI: the two colors line, green and red, are actually the same indicator CCI that I set to 20.
*Note that in index CCI I have set the lines +100 and -100 to +75 and -75 for less error and a stronger signal to sell or buy.
EMA: The white line, which is in the form of steps, is in fact the same indicator of EMA, which I have considered as a value of 9.
_________________________________________________________________________________________________________
Instructions
-> areas:
Zone +75 to +200 = positive range or incremental price or bullish
Zone +75 to -75 = Neutral range or almost constant price (no fluctuations or very wet fluctuations)
Zone -75 to -200 = single range or discount price or bearish
->How to use:
Buy = In the bearish range, if line CCI intersects line EMA upwards and goes to the neutral zone.
None = if the index (or index lines) collide in the neutral zone
Sell = In the bullish range, if line CCI intersects line EMA down and goes to the neutral zone.
-> Please comment on this system or if you have a good experience in changing the values of the indicators or it seems to you, please share.
With great respect to:
Who had published the main idea of this system.

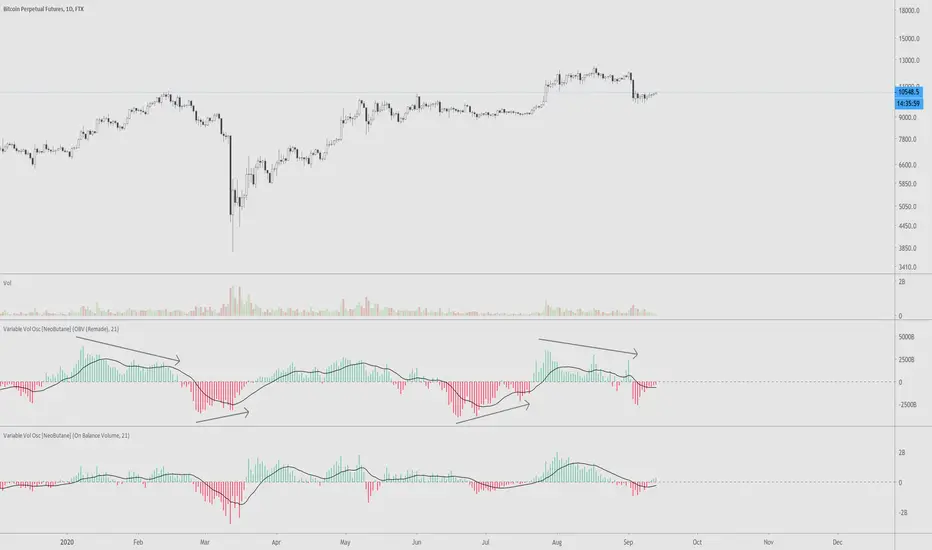
VVOscillator [nb]Multiple volume oscillators in one.
Description:
As Warren Guppet once said, be “fearful when others are buying less, and greedy when others are selling less.”
Divergences are the main point of usage of all bundled indicators.
OBV Oscillator, remade. The formula has been changed to smooth out the way OBV is calculated during a trending move
OBV Oscillator, original OBV formula.
Price Volume Trend Oscillator. Similar to OBV, except price is taken into account as well.
Price Volume Trend Oscillator, log.
Accumulation/Distribution. (close - low) - (high - close) / (high - low), then multiplied by volume
Chaikin Money Flow . Very similar to accum/dist except it was already made into an oscillator.
OBV just by itself. Change style to line for easier interpretation.
Experimental function that utilizes a part of CCI
This is the unedited "Variable Volume Oscillator v1" released for free use. In the time since I've created it, I've realized it's something I'd like to share because I like it and hope you will too.
Adaptive Commodity ChannelThis is part 4 of 11 in the system named Ninetales/Volt V2 you can find on Tradingview.
Use it however you would use standard CCI, just add your preferred values to test against each other, and set the period you would like for it to backtest.

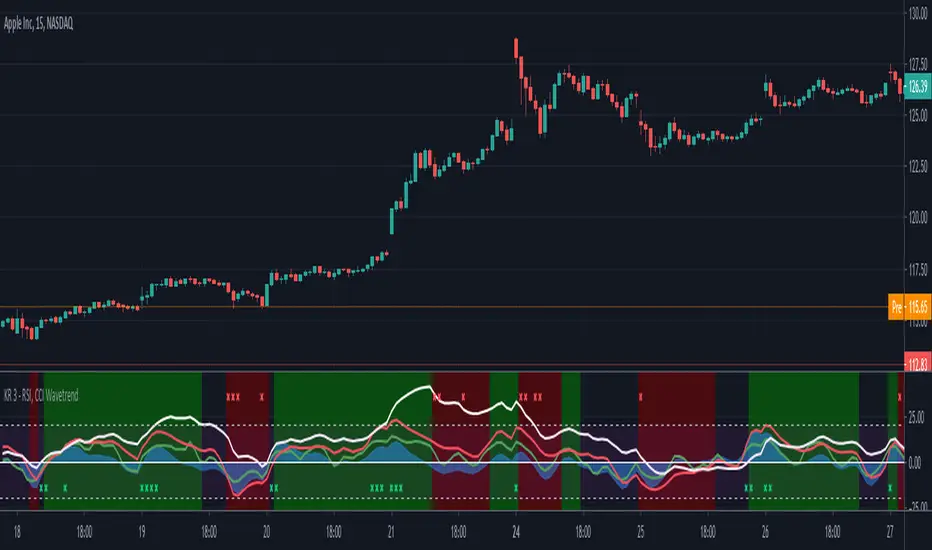
RSI, CCI WaveTrend God by Keiron RichieThis script uses Relative Strength Index ( RSI ), Commodity Channel Index ( CCI ) and WaveTrend (WT) together as an oscillator with an additional custom RSI rate of change indicator and buy/sell background color zones derived from a complex combination of these indicators.
The White line shows the moving average of RSI as an oscillator
The Green line is the fast Exponential Moving Average ( EMA ) of CCI & the Red line is the slow EMA of CCI .
The Blue area is the EMA of WaveTrend WT
How to read:
If the RSI , CCI or WT crosses above a programmed threshold and the other lines are also within a pre-defined buy range then the background will change to green for buy.
If the RSI , CCI or WT crosses below a programmed threshold and the other lines are also within a pre-defined sell range then the background will change to red for sell.
Where requirements are not met, the background is neither green nor red.
There are also red and green indicator x’s at the top/bottom of the indicator. They show a drastic change in Relative strength within a short period. This often indicates an immediate buy or sell opportunity.
Buy, Sell, Exit Buy and Exit Sell alerts are included.
Use the link below to obtain access to this indicator.
CCI - SWIFF KNIFECCI indicator swiff knife.
A lot of different usages of CCI ae possible with this script :
- 2 CCI lines crossovers.
- CCI - 0 Line crossovers
- CCI + Moving Average crossovers (many types of MA are available)
Filters can be added.
CCI can be used as a confirmation indicator, a continuation indicator, an exit indicator, a chopiness indicator .... It can even make coffee, who knows.

Toguro1000's CCI (Anti Fake-Divergence)TUTORIAL
1 - Look for divergence.
2 - Check the anti-fake div bar color. (White means you are good to go, colored means there is a high probability that the divergence will not play (fake divergence).

CCI Indicator [SystemAlpha]This is a CCI indicator enhanced with:
- Show Alert
- Fill on oversold and overbought levels
- Show Regular and Hidden divergence
- Show Divergence Labels

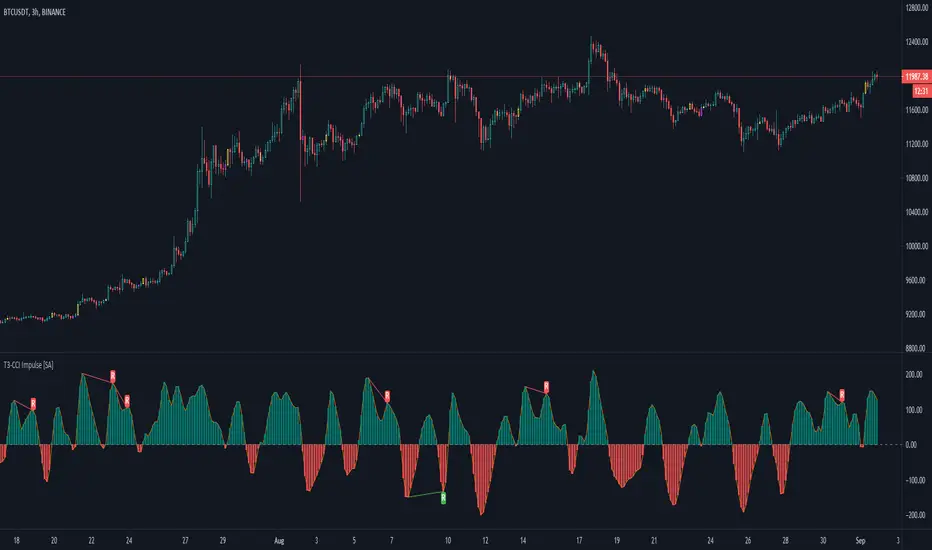
T3-CCI Impulse [SystemAlpha]FX Sniper's T3-CCI indicator modified with bar color and regular divergence.
Also added option to change bar color based on Elder's Impulse System.
CCI w/ SMA averages DS2This is a simple yet powerful indicator using the CCI and CCI average. I have included Buy (B) and Sell (S) signals in it. Those signals work best when used in conjunction with an Anchor chart and a trigger chart. Where the Anchor chart is of higher time frame and the trigger chart with B and sell signals is used for the entries. Keep on mind when trading to don't let it go red.....ie. the trade. Hope is not a trading option to continually make money. Know your trade set up entries and exits. Wether they are fib levels are a certain amount on ticks.

CCI [SystemAlpha]This is a CCI indicator enhanced with:
- Show Buy and Sell Alert
- Fill on oversold and overbought levels
- Show Regular and Hidden divergence
- Show Divergence Labels
- Generate Alerts: Buy/Sell and Divergence
TEC_MapHack_Sub2_Indicator_ver_2.0.0본 지표는 CCI를 조금더 보기 좋게 개편함으로 과매수구간과 과매도구간을 쉽게 알아볼 수 있는 CCI입니다.
배경이 주황색이면 과매수구간을 나타내고, 배경이 하늘색이면 과매도구간을 나타냅니다.
This indicator is a CCI that can easily identify overbought and oversold sections by reorganizing the CCI a little more visually.
An orange background indicates an overbought section, a sky blue background indicates an oversold section.

TSI CCI Hull with profit$$$$ , Alert versionThis is a modified version of @SeaSide420 TSI CCI Hull with profits exit on long and short order with alert as well
original script :
the strategy script:
/// feel free to edit/improve and comment

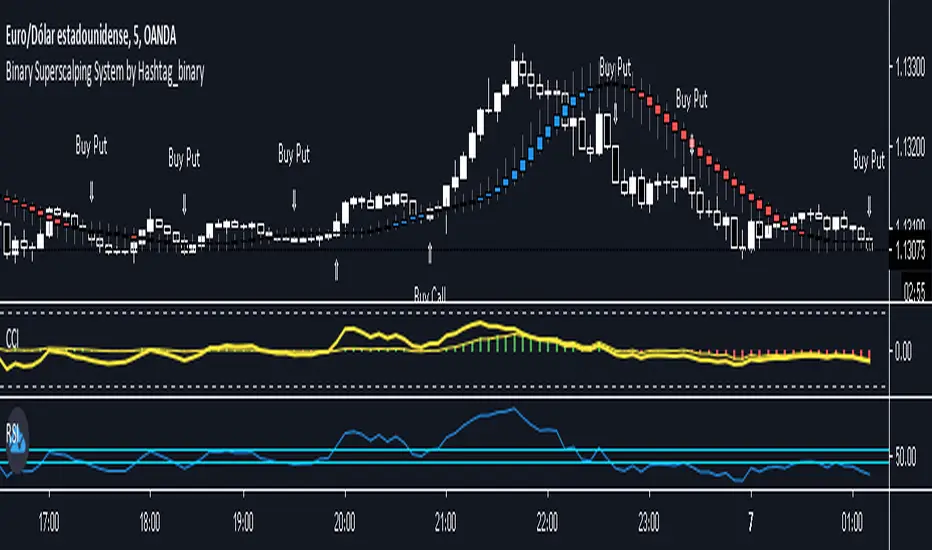
Binary Superscalping System by Hashtag_binaryBinary Superscalping Systyemis a trend momentum strategy designed for scalping and trading with binary options. This trading system is very accurate with the 80% profitable trades.
- Markets: Forex (EUR/USD, GBP/USD, AUD/USD, USD/CHF, USD/CAD, NZF/USD, USD/JPY,) Indicies (S&P500, Dow Jones, DAX, FTSE100) and Gold.
- Time Frame 5 min, 15min, 30min.
- Expiry Time (4-6 candles).
Buy Call or Buy:
- Trend CCI (170) crossed the zero line upwards (green bar >0);
- Entry CCI (34) crosses upward the zero line ;
- RSI (Relative Strength Index) indicator value is greater than 55 level;
- Heiken Ashi Smoothed indicator is color blue (optional).
Buy Put or Sell
- Trend CCI (170) crossed the zero line downwards (red bar <0);
- Entry CCI (34) crosses downward the zero line ;
- RSI indicator value is lower than 45 level;
- Heiken Ashi Smoothed indicator is color red (optiona).
Exit position for Scalping options:
- Entry CCI (34) crosses in opposite direction trend CCI (170),
- Profit Target:5 min time frame 7-10 pips, 15 min time frame (9-14 pips), 30 min time frame (15- 18 pips).
- Make Profit at fibopivot levels.
- Initial stop loss on the previous swing.

Basic BIASBasic BIAS
Deviation rate (bias), also known as deviation rate, or y-value for short, is an indicator to reflect the deviation degree between the price and MA in a certain period of time by calculating the percentage difference between the market index or closing price and a moving average, so as to obtain the possibility that the price will reverse or rebound due to deviation from moving average trend in case of severe fluctuation, and that the price will move within the normal fluctuation range Form the credibility of continuing the original potential.
The deviation rate is a percentage of the deviation degree (gap rate) between the price and ma.
The departure rate curve (bias) is a curve that connects the values of each bias into a line and obtains a wave extension curve with the value of 0 as the horizontal axis.
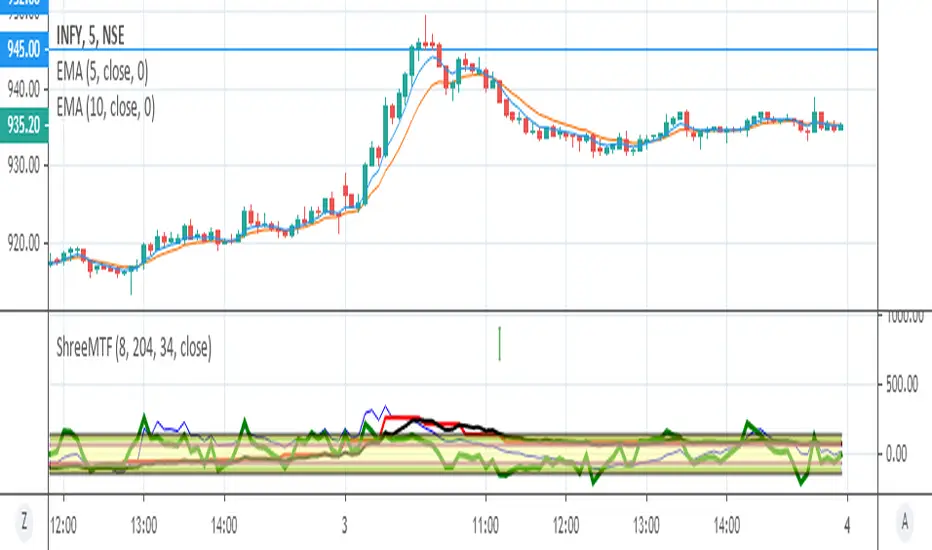
ShreeMTFShree MTF:
CCI8(5 Min)
CCI34(5 Min)
CCI34(30 Min), These 3 variants are plotted along with horizontal lines for CCI8(5 Min) with upper range of -135 and lower range of +135 & CCI34(30Min) with upper limit of +100 and lower limit of -100
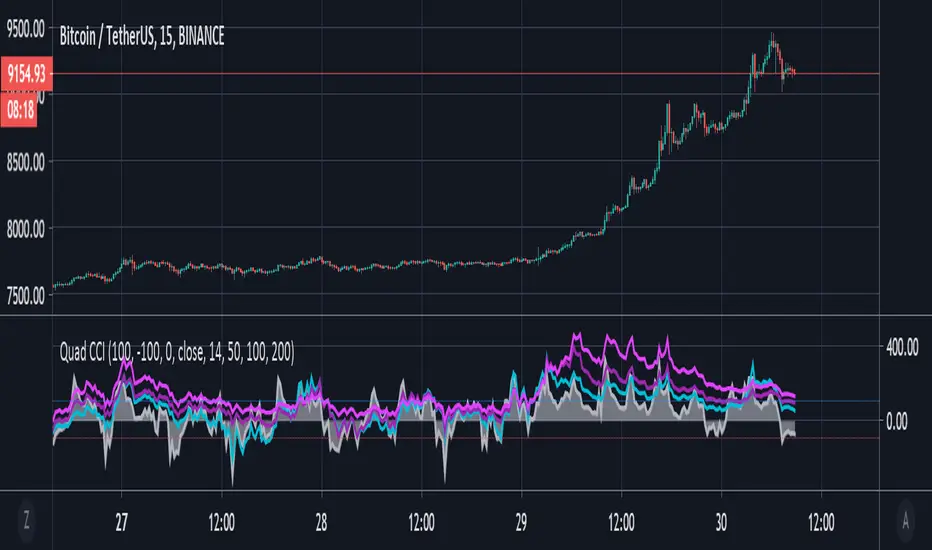
Quad CCI ContainmentThe Quad CCI is a trend identification indicator described by Mark Whistler in his book 'Volatility Illuminated'. The reason for using four separate CCI channels is so that we can:
Prevent ourselves from taking positions against momentum.
Time our trades with short-term 'wrist-rocket' thrust from the larger market momentum.
Clearly determine whether the trend is up, down, or sideways.
In his book, Whistler refers to four CCI channels as 'The Four Horsemen'. The 100 and 200 are like big burly swordsmen, which are hard to budge without significant force. The 50-period CCI is more like the guy who's fast on his feet, but still tough enough to take on the big dudes. And the 14-period is similar to the scout of the party. The fastest of the bunch, but also the first to turn-tail at any sign of danger.
Basically, this means that when we see the 100 and 200-CCI stay above the 0 line, we can infer there really isn't any reason for them to move out of their range. The 50-period CCI will sometimes venture over the 0-line, before the hefty battlers. However, the 14-period will often venture (quickly) way out into the yonder, and he will always return to tell his pals what he's found. Crossing back over the 100-line, traders can take 'rocket trend reentry' positions (usually on the median); however, we still want to keep an eye on the flighty 14-period CCI character. If he crosses back over the +100 or -100 level he was just scouting, it means the larger weighted CCI lines could soon to follow too, as the whole bunch runs from larger momentum on the way.
Traders seeking to take a position 'with the trend' can attempt to purchase pullbacks on the mean if:
Longer-term CCI (at least the 200 and 100) are above zero.
The 50-period CCI is not below -100.
The 14-period travels back up from underneath the -100 area.
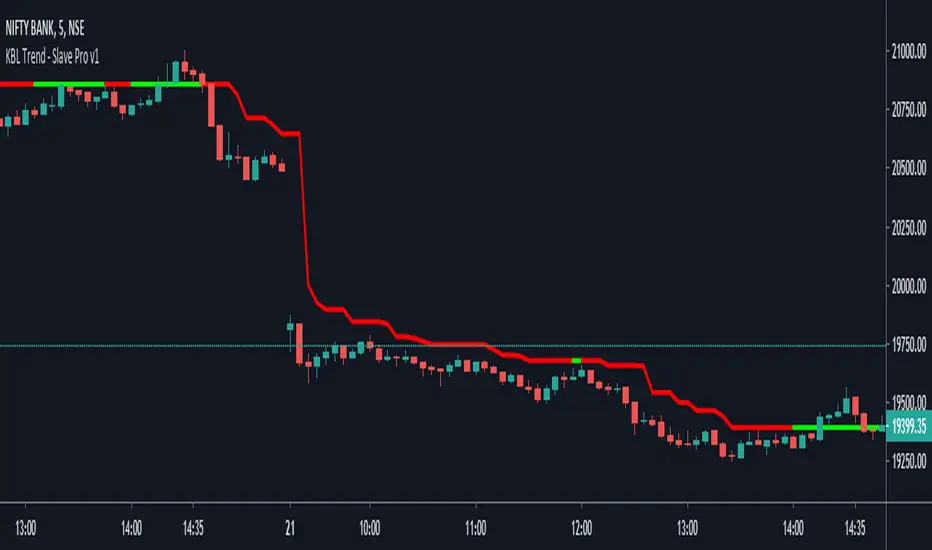
KBL Trend - Slave Pro v1KBL Trend Slave is Specially design to detect the correct trend and specially to avoid market noise in range bound market conditions.
When KBL Trend - Slave line indicated with Green color and price is above the KBL Trend -Slave, Then the trend is in buy side and a buy trade is preferred.
And same for sell trade,
When KBL Trend - Slave line indicated with Red color and price is Below the KBL Trend - Salve , Then the trend is in sell side and a sell trade is preferred.
Few more optimizations have been added to the script to gain more fine curves.
PM us to obtain access.
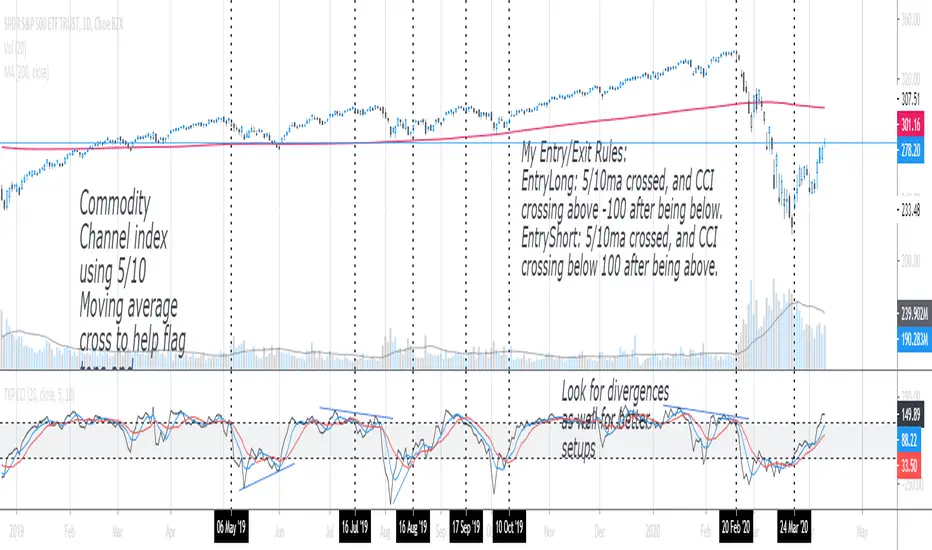
TKP Commodity Channel IndexThis indicator plots moving averages along CCI. This can help Identify trend and divergences in a smoother and less erratic way.
KBL Trend - SlaveKBL Trend Slave is Specially design to detect the correct trend and specially to avoid market noise in range bound market conditions.
When KBL Trend - Slave line indicated with Green color and price is above the KBL Trend -Slave, Then the trend is in buy side and a buy trade is preferred.
And same for sell trade,
When KBL Trend - Slave line indicated with Red color and price is Below the KBL Trend - Salve , Then the trend is in sell side and a sell trade is preferred.

