The MATRIX: Ultimate Crypto Position Strategy (Alert Version)Welcome back everyone,
It's been a while since our last post. In recent months we have worked on all kinds of projects, but more on that later. In the meantime, we also received a lot of positive feedback about our original 'The MATRIX: Ultimate Crypto Position Strategy' script.
One of the many requests was whether we could release an alert version.
However, since Pinescript does not provide the alert functionality in a strategy type script, it had to be converted to a study type script. Besides that, we have also added a stop-loss functionality. This release has the same internal algorithm as the original 'The MATRIX: Ultimate Crypto Position Strategy' script. But instead of showing back test results, this script provides the functionality to add alerts that can notify the user via email / pop-up / sms / app once a signal is given! You must manually add these alerts via TradingView. If you need help setting up these alerts, feel free to ask in the comment box or send us a dm.
***The script is invite-only, message us to get script access***
-------------------------------------------------------------------------------------------------
The MATRIX: Ultimate Crypto Position Strategy should be used as follows:
• The trading strategy was designed and optimized for trading cryptocurrencies only ; furthermore it works best on established high market cap cryptocurrencies that have a clear trend such as:
BTCUSD
ETHUSD
LTCUSD
XRMUSD
EOSUSD
ADAUSD
DASHUSD
ETCUSD
• The trading strategy is based on swing/position methodology. The script must therefore be used on daily timeframe candles only (1D).
• Use USD trading pairs only (e.g. use ETHUSD instead of the ETHBTC) since the individual trend is captured more effectively and therefore gives better results.
-------------------------------------------------------------------------------------------------
The MATRIX:Ultimate Crypto Position Strategy is based on the following indicators:
• Ichimoku Cloud ; acts as the leading indicator.
• Volume ; without strong volume , a market move is not valid.
• MACD and Vortex ; both being used as confirmation indicators.
• Choppiness index ; avoids trading in choppy markets.
• Bullish/ Bearish Regular Divergences in combination with RSI to spot tops and bottoms.
• Simple and Exponential Moving Averages ; prêvents trading against the trend.
The trading strategy is easy to use, trend based and without repainting, meaning once a signal has been made it is permanent and that no future data is used in the decision making. It detects the trend and filters out market noise based on more than 10 technical indicators. ONLY when all indicators align with each other the algorithm prints a BUY or SELL signal. The trading strategy provides high probability trading signals and minimizes risk! This script aims to capture the profit from longer term trending moves and by doing so filters out non-substantial trends and avoids the associated risks with these trades.
-------------------------------------------------------------------------------------------------
The MATRIX: Ultimate Crypto Position Strategy has the following features:
• ALERTS can be enabled which can notify the user through email/popup/app once a signal is given.
• Automatically generated Buy / Sell alerts in the form of a label.
• NO Repaint once candle is closed.
• SAFEGUARD ; custom built-in security prevẹnts trading when the price is out of equilibrium.
• Customizable Display for the Ichimoku cloud indicator display.
-------------------------------------------------------------------------------------------------
Reminder: Use this trading strategy at your own risk and trade responsibly. We are not responsible for any financial loss using this strategy.
***The script is invite-only, message us to get script access***
Crypto

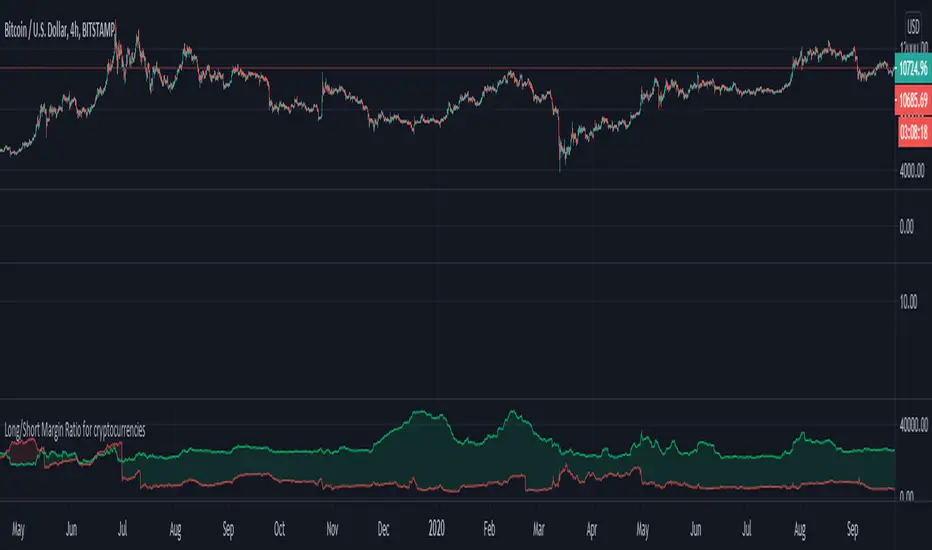
Long/Short Margin Ratio for cryptocurrenciesBTCUSDSHORTS and BTCUSDLONGS are like datasets provided by Bitfinex exchange. They record the number of margined for longs and shorts and they are measured in BTC (in case using BTCUSD ).
Margin is Like any loan, the borrower may pay interest while the loan is outstanding, and must eventually pay the loan back.
Red Area: More short margin than long margin.
Green Area: More long margin than short margin.
Note: Can only be used with cryptocurrencies that have such dataset within Bitfinex exchange like BTCUSD , ETHUSD , XRPUSD and a few more.
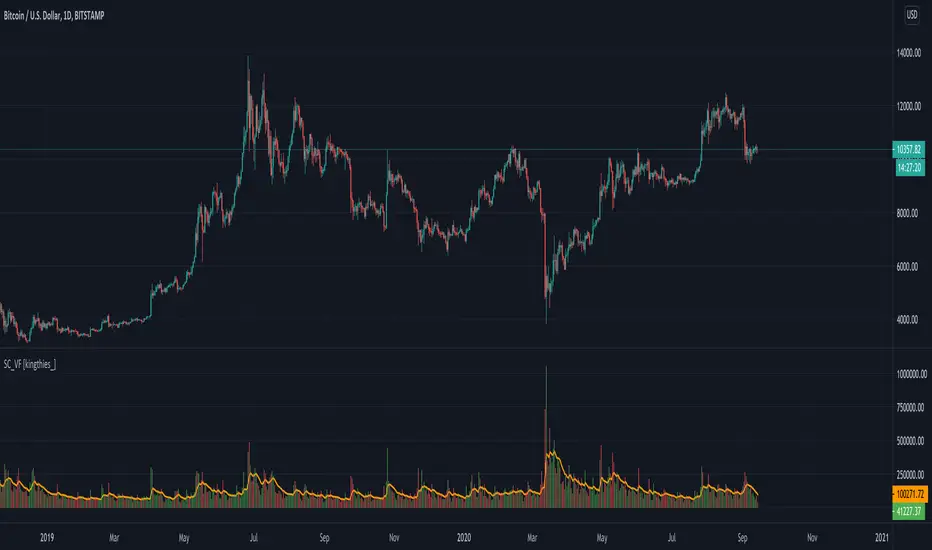
Stablecoin Volume Flow [kingthies_]Stablecoin Volume Flow into BTCUSD/BTC-Stablecoin pairings
Exchanges Used
Coinbase
Kraken
Bittrex
Binance
Huobi
Bitstamp
Gemini
Bitfinex
Our aim here is simple...to combine the overall volume flow from Fiat or stable currencies into the crypto-markets.
This is the first portion of a series I plan to share involving a holistic approach to understanding the overall crypto-ecosystem. I've included several of the highest ranking by volume exchanges and their accompanying older/well known stablecoins.
Also, the historic data for the newer stable coins made the study invalid due to limited sample size. That included coins like USDC, DAI, GUSD, BUSD and more. For this reason, the 10 sources of data here adequately provide the data needed to see a full view of the market volume going in and out of bitcoin at any given moment
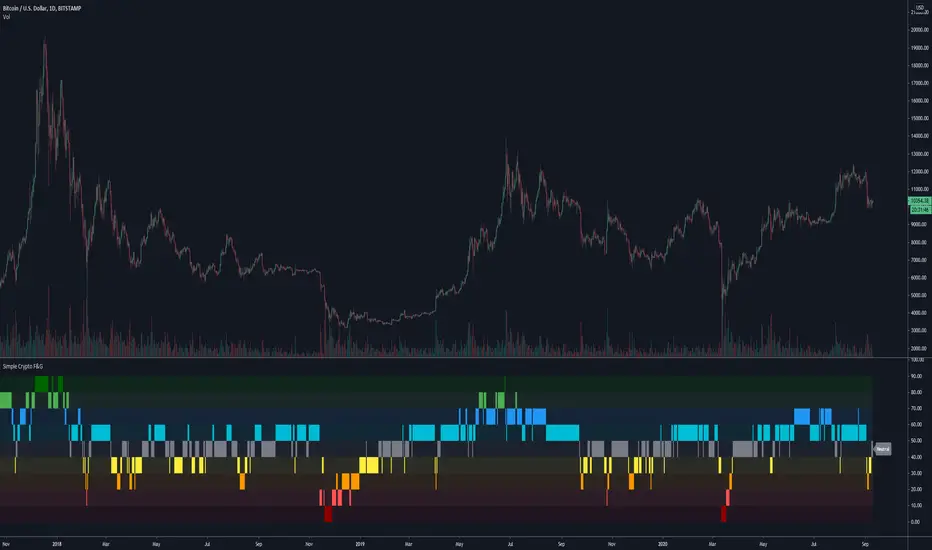
Simplified Crypto Fear & Greed DisplayA more simplified view of a Fear & Greed index.
This script has been made public because it uses Trading Psychology - Fear & Greed Index by DGT as the basis/inspiration for it.
I've re-imagined the visuals in order to display F&G data differently to the more traditional versions of the indicator floating around, as well as adapting it's calculations and reference assets for use with Crypto markets.
It's aim is to show the current status / mindset of market participants at a quick glance.
When there is a lot of fear in the market it is usually a good time to look for buying opportunities.
On the flip side you can use it to spot selling opportunities when there is too much greed / FOMO in the markets.
This indicator has the option for Traditional and Crypto markets.
The Traditional option uses the tickers VIX and GOLD as part of it's calculations, where as Crypto uses BVOL24H and BTC.D in order to base it's decisions off of more relevant data.
There are also 10 levels of smoothing so play around with that to get the desired result. Depending on the asset you are looking at, smoothing of 1 or 2 may work much better than 5+
Have a play around, customize it, use it and let me know what you think.
RSI + MFI - Crypto Bull and Bear market A fancy styled version of the RSI (Relative Stochastic Index) + MFI (Money Flow Index) oscillators in order to emphasize buy and sell opportunities.
The 80 and 20 Bands are meant to be used in Bull or Bear markets. Better performing in D timeframes.
The circles represent the cross between RSI and MFI .
Designed for Crypto Markets
Thanks @micheleprandina
Credits:

Risk Metrics: Crypto VersionRisk Metrics for Crypto.
Market can be set to BTCUSD, BTCEUR, BTCCHF, BTCGBP, BTC1!, BTC2!, SPX, and DTB3
Beta
Correlation
Standard Deviation
Variance
R-squared

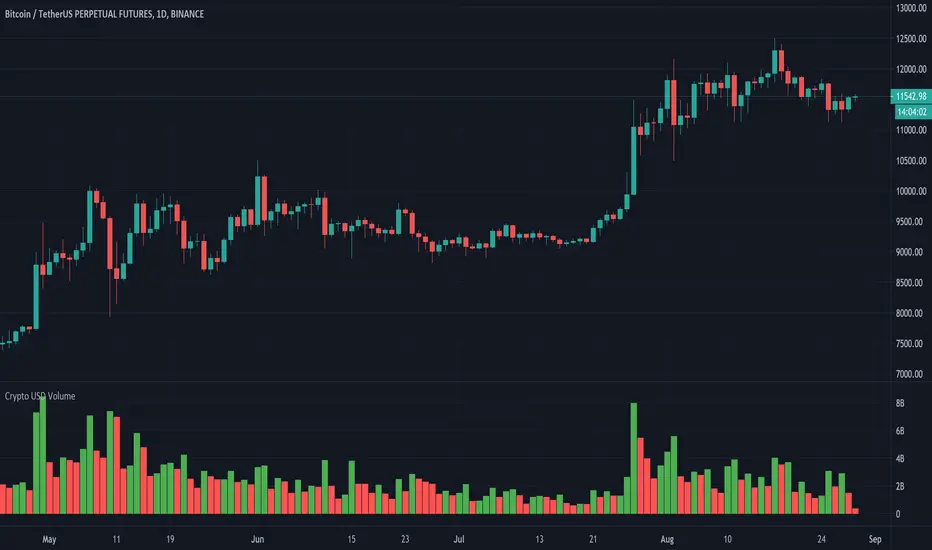
Crypto USD VolumeOften times I need to check the volume in cryptocurrency exchanges and I find myself checking which type of volume I am looking at, I need to manually make sense what the data is and converting it into USD volume which I end up going to CoinMarketCap website to verify whether my calculation is right.
Today I thought it was about time I created an automatic way to find the volume in USD Dollars. This is what this script does.
1 - It removes the base currency from the symbol (e.g., "BTCUSD", it would remove "BTC", leaving us with the "USD" part.). This is important because it helps us identify the currency the pair uses.
2 - It has different pair's variables, each is given a specific currency that the final volume is calculated from. (BTC, ETH, BNB and USD are the default currencies, for other ones, it must be added manually).
This works with all crypto symbols that include BTC, ETH, BNB and USD as currencies. If you modify it, please make sure to compare data with the exchange's one.
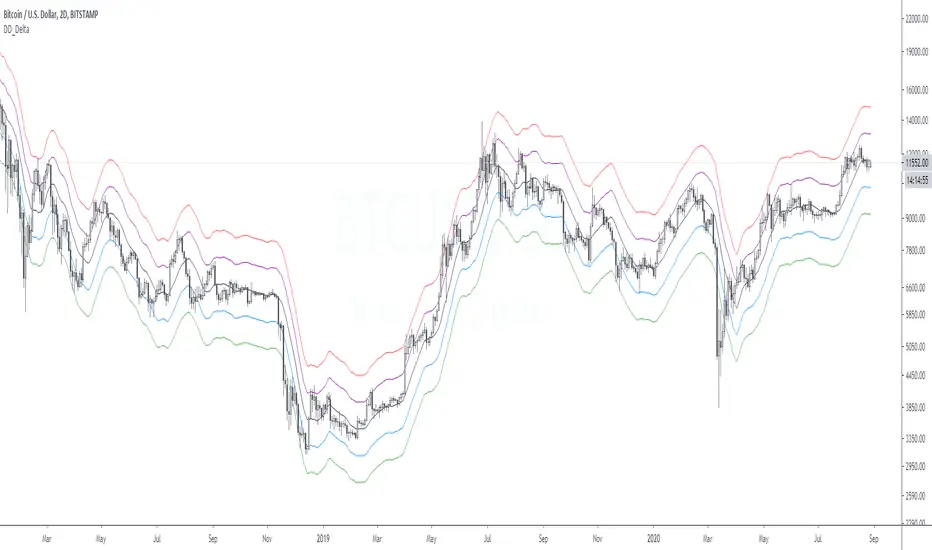
DD_DeltaDescription:
The DD_Delta Indicator is a mean reversion indicator based on the concept of moving average and fibonacci level multiples. The middle blue line corresponds to the 13 MA with the orange and red lines lines being a factor and inverse of 1.414 and 1.272 of the blue line respectively. Price usually retraces from the purple and red (green and blue) lines towards the back line. Also, the direction of the ribbon indicates the nature of the market - upwards: bull, downwards, bear.
Best TF to use this on: 2D.
For access, DM me.
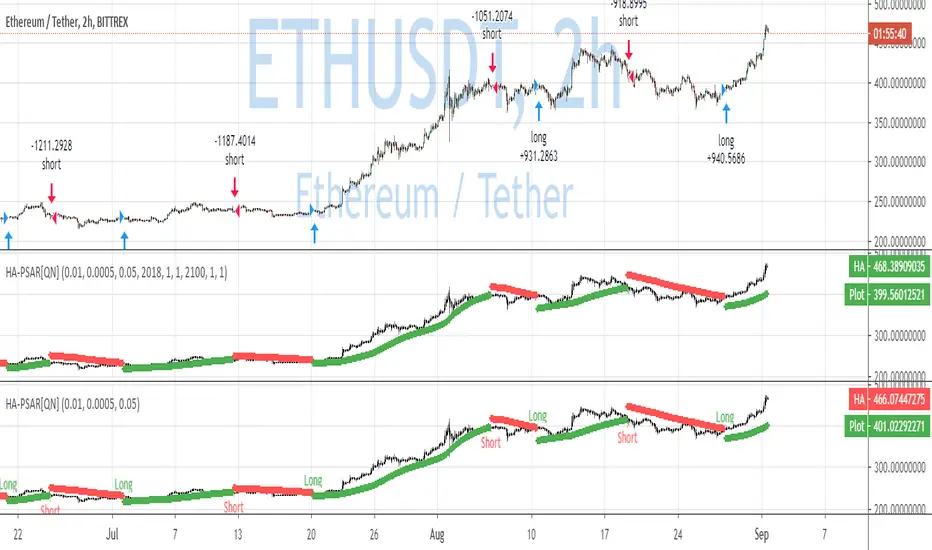
QuantNomad - Heikin-Ashi PSAR AlertsUsing this script you can create alerts for my Heikin-Ashi PSAR Strategy:
When creating alerts use "Once Per Bar Close" in parameters.
####################
Disclaimer
Please remember that past performance may not be indicative of future results.
Due to various factors, including changing market conditions, the strategy may no longer perform as good as in historical backtesting.
This post and the script don’t provide any financial advice.
ETS Breakout LevelsThis indicator mimics the breakout levels a professional trader would draw and watch for trading opportunities. It is a very powerful tool to have.
The lines are drawn as soon as a new breakout level is detected, and the line is then automatically extended to the right, making it easy to see when the market reacts to it.
Knowing where important levels on a chart are, immediately takes you from having no idea where the market might make a big move, to being a trader ready to take action at the right time.
The Breakout Levels indicator is also very good at keeping you out of the market when it's simply choppy and difficult to trade, because the breakout levels will most likely fall outside of the choppy sideways consolidation area, but still prepare you for when the market finally picks a direction again.
This indicator also includes colored time bands that mark times during the trading day where historically stocks often reverse course, or may enter a period of consolidation. These times coincide with tea breaks, lunch breaks or times when news are typically announced.
For Forex traders, there are colored session bands that help you to easily see when the major markets are open.
What Makes It So Powerful?
- Give you a signal as early as possible and does not "repaint" once the bar completes
- Reacts to fast market direction changes like a master trader
- Is super easy to understand and implement in your trading
- Can be used for Forex, Stocks and Crypto
- Works on all timeframes
This indicator also has a number of options you can change in Settings:
1. "Safety Margin" - I keep this at zero, but if you want a bigger "buffer" for safety before entering a trade you can increase this value.
2. "Hidden Above Interval (Minutes)" - The Forex sessions or Stock important daily times can be set to be hidden above a certain timeframe to keep your charts clean.
3. "Show Moving Averages" - All of the moving averages that are included for convenience can be shown or hidden by setting this value.
3.1. The next 5 settings all deal with moving averages that can be shown or hidden individually.
4. "Show Stock Pivot Times" - There are a number of trading times for US Stocks that are important during the trading day, and this setting will highlight them.
4.1. "Show Main Stock Pivot Times" - This shows only the Stock trading times that are deemed the most important, and around these times the market often change direction (e.g. after the morning break, after lunch, etc.)
5. "Show Forex Sessions" - Does pretty much what it says, and you can also adjust the hours if you wish.
6. "Extreme Move Reversal Points" - If an extreme market move has been detected, and this is enabled, a "X" will be shown above or below the bar to indicate that the market might reverse.
7. "More Signals" - If you want to see more potential breakout levels, enable this option.
8. "Show VWAP" - This will include the VWAP indicator as a convenience if selected.
How To Use the ETS Breakout Levels Indicator
1. Add the indicator to any chart you wish to trade, Crypto, Forex or Stocks and set it to the timeframe you prefer. For instance, I use it on 1 minute and 5 minute charts for daytrading Stocks. For Forex I generally use a 15 minute chart, and longer timeframes for Crypto.
2. Open the Settings and change values to suit your requirements as described above.
3. When the indicator has determined that a new breakout level has formed, it will draw a line and extend it to the right so that you can see when future bars come close to it.
4. Price action will either bounce off it, or pierce through it and continue on.
5. If the market is relatively far away from smaller moving averages such as the 9 EMA or 20 EMA, expect that the price action might first move back to the moving averages before continuing in the new direction identified by the indicator.
6. When these levels are broken, it is often an indication of a breakout occurring and it can give you some very significant market moves.
This is an "invite only" script, which means that you will need to let me know that you're interested in it before you can get access to it. This is a paid script, please follow the link in my profile to get the details or ask me directly. It may take up to 48 hours for me to respond, but I do my best to respond as quickly as possible. You will get 7 days to test it for yourself on all your charts with no restrictions.

ETS Trending ArrowsThis indicator is the end result of years of trial and error to create an indicator that aims to mimic market entry points that a professional trader would take.
It has arrows that clearly show potential market entry points, and suggested stop-loss levels. What I like about it is that it generally responds as fast to market changes as a good trader would, leaving you enough time to still validate the move before taking it.
This basically levels the playing field, because even if you're a rookie trader, or maybe an experienced trader in a slump, this indicator can help you to identify possible trading entry points that is responsive to market moves, and that can be used on different timeframes based on how you want to trade. And if you're an experienced trader, this indicator will help you like a good trading buddy to make good trading decisions.
What Makes It So Powerful?
- Give you a signal as early as possible and does not "repaint" once the bar completes
- Reacts to fast market direction changes like a master trader
- Is super easy to understand and implement in your trading
- Can be used for Forex, Stocks and Crypto
- Works on all timeframes
How To Use The ETS Trending Arrows Indicator
1. Add the indicator to any chart you wish to trade, Crypto, Forex or Stocks and set it to the timeframe you prefer. For instance, I use it on 1 minute and 5 minute charts for daytrading Stocks. For Forex I generally use a 15 minute chart, and longer timeframes for Crypto.
2. Open the Settings and change values to suit your requirements:
2.1. "Early Trigger Live Signals / Stable Signals" - When you select "Stable Signals", the arrows will appear once the bar closes, on the new bar. Selecting "Early Trigger" will signal instantly and can give you an early entry, but may update in some cases as conditions change.
2.2 "Show More Signals" - This pretty much does what it says. If you don't want all possible signals, this will scale things back a bit and give you fewer signals.
2.3. "Show 20, 50, 200 Moving Averages" - This is just a convenience, and is provided to help you exit trades, which I typically do when price crosses back over the 9 EMA or 20 EMA.
2.4. "Show 9 Expo Moving Average" - Also provided for convenience, and separate in case you don't want this level of detail.
2.5. "Show Immediate Reversals" - Personally I don't use this setting, but someone requested that I add it. What it will do is if there is a signal, which then immediately passes the "stoploss" dotted line, this will immediately give a signal in the opposite direction.
2.6. "Show Bollinger Bands" - This is also only provided for convenience, I use Bollinger Bands to determine where the market move is in relation to the average deviation.
2.7. "Bollinger Bands Length" - Simply the regular BB length setting.
2.8. "Bollinger Bands Deviation" - I use a 2.5 setting by default in order to better identify areas where the price action is really far beyond where it should be.
3. Now that you've set things up, all you need to do is to wait for a signal. As mentioned earlier, the signals will react differently based on whether you chose "Early Trigger Live Signals" or "Stable Signals". If you opt for "Early Trigger Live Signals", like I do, you should pay attention to where the market currently is in relation to the closest moving average, like the 9 EMA or 20 EMA. Keep in mind that price will often signal a new move, but then first move back to the average, before continuing in the new direction identified by the trading arrow.
4. These signals are intended to identify new trending moves, and for that reason, if the market moves against the signal, you should not hold on to your position hoping that it will turn in your favor.
5. When the market is moving in your favor, resist the urge to exit quickly, and use either (or both) the 9 EMA and 20 EMA to exit your trades. A good approach is to use the 9 EMA to exit a portion (maybe 50%) of your trade, and exit out of the rest once price closes above or below the 20 EMA depending on the direction of your trade.
This is an "invite only" script, which means that you will need to let me know that you're interested in it before you can get access to it. This is a paid script, please follow the link in my profile to get the details or ask me directly. It may take up to 48 hours for me to respond, but I do my best to respond as quickly as possible. You will get 7 days to test it for yourself on all your charts with no restrictions.

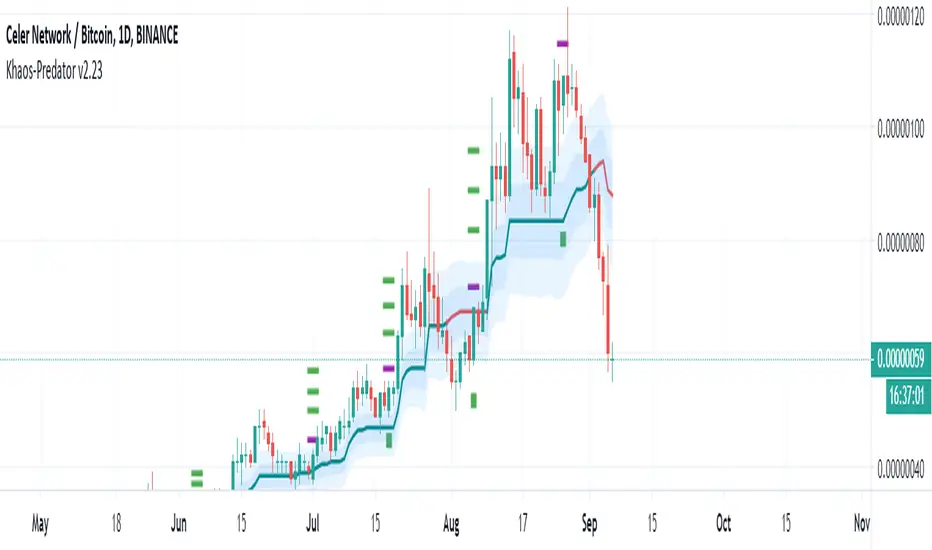
Khaos-PredatorThis Indicator is a full trading system that offers setups with Entries and Targets and Trade Management. This indicator is very accurate because it uses advanced setup detection and filtering logic.
There are 2 conditions that must occur for you to take a trade:
1) Price must move beyond the purple dot
2) The baseline must be green for long trades, or red for short trades.
The setup is triggered if the price passes the purple dot. Do not enter the trade unless price passes the purple dot. (You may wait for pullback to enter if you wish – but only after price traded beyond the purple dot firstly.) Remember, the trade is NOT active unless price moves beyond the purple dot.)
Each setup has 3 possible targets, which are dots colored green for longs and red for shorts.
You can use the baseline (which is a trend-line that is either green for bullish or red for bearish) to filter trades. You should only enter long trades if the baseline is green and only enter short trades if the baseline is red. One strategy would be if you enter a trade long, and reach the first target, you can take some profits, but still let the some of the position run and use the baseline to manage the trade.
Also, you can use the baseline for trailing stops.
To summarize:
• Purple Dot = Entry Trigger
• Green Dots = Long Targets (3 of them, for different price targets: target 1, 2 and 3)
• Green Square = Long Stop
• Red Dots = Short Targets (3 of them, for different price targets: target 1, 2 and 3)
• Red Square = Short Stop
The great thing about this indicator is that its universal, there are no settings necessary -- just put it on the chart and it finds high probability setups and paints it on the chart as they occur. There is NO Repainting with this indicator.
Of course, you can add other indicators if you wish, and even add this indicator to your existing trading system.
Again, this indicator does NOT repaint.
Once a setup is found, the indicator draws the entry trigger price and the targets at the setup bar close.
Setup Alerts are fully supported, via email, sms, and desktop notification.
*If you wish to license this indicator, please contact me via private message for details regarding access. Thank you.
LEGAL STUFF:
Risk Disclosure
Futures , forex, stock, crypto and derivative trading contains substantial risk and is not for every investor. An investor could potentially lose all or more than the initial investment. Risk capital is money that can be lost without jeopardizing ones’ financial security or life style. Only risk capital should be used for trading and only those with sufficient risk capital should consider trading. Past performance is not necessarily indicative of future results
Hypothetical Performance Disclosure
Hypothetical performance results have many inherent limitations, some of which are described below. no representation is being made that any account will or is likely to achieve profits or losses similar to those shown; in fact, there are frequently sharp differences between hypothetical performance results and the actual results subsequently achieved by any particular trading program. One of the limitations of hypothetical performance results is that they are generally prepared with the benefit of hindsight. In addition, hypothetical trading does not involve financial risk, and no hypothetical trading record can completely account for the impact of financial risk of actual trading. for example, the ability to withstand losses or to adhere to a particular trading program in spite of trading losses are material points which can also adversely affect actual trading results. There are numerous other factors related to the markets in general or to the implementation of any specific trading program which cannot be fully accounted for in the preparation of hypothetical performance results and all which can adversely affect trading results
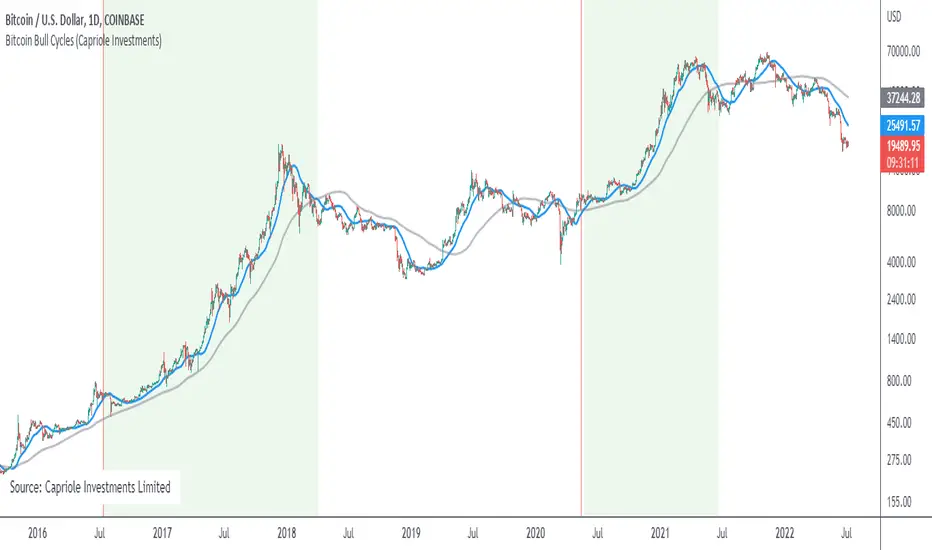
Bitcoin Bull CyclesA simple indicator that identifies the primary upswing of Bitcoin following each Halving, the "Bull Cycle".
A "Bull Cycle" is identified as the first period of positive momentum after each Halving date, defined as the 50 Daily Moving Average (DMA) being above the 200 DMA.
Crypto Smart ScalperCrypto Smart Scalper V 1.0
Indicator designed to assist in trend identification utilising Open/Close Price for up and down moves.
This is NOT a trading system and should be used with supporting information and data. It is not identifying or is meant to represent a standalone trading system.
Open/Closed Price identified for potential trend direction once swings are complete.
If you would like to enquire about access to this invite only script please send me a private message on trading view and I will be happy to assist. Thank you.
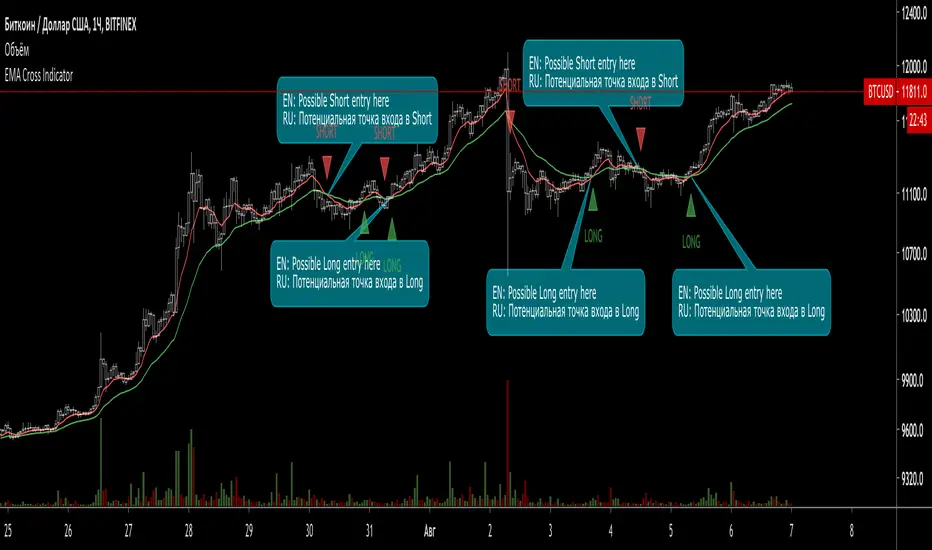
EMA Cross Indicator (with signals)This indicator shows 2 EMA (Long and Short) Cross and gives a possible entry point for a trade.
When Short EMA (red line) line crosses Long EMA (green) from bottom to top - this is a possible Long trade entry point.
When Long EMA (green line) line crosses Short EMA (red) from bottom to top - this is a possible Short trade entry point.
In both cases (basically, all the crossovers) are indicated with "Long" and "Short" labels.
Works with Crypto (from 30 min timeframe and higher)
Stocks (from 1 hour timeframe and higher)
Commodities (from 1 hour timeframe and higher)
Forex (from 1 hour timeframe and higher)
Consider using it with respect to Your trading style, money- and risk-management as well as other indicators.
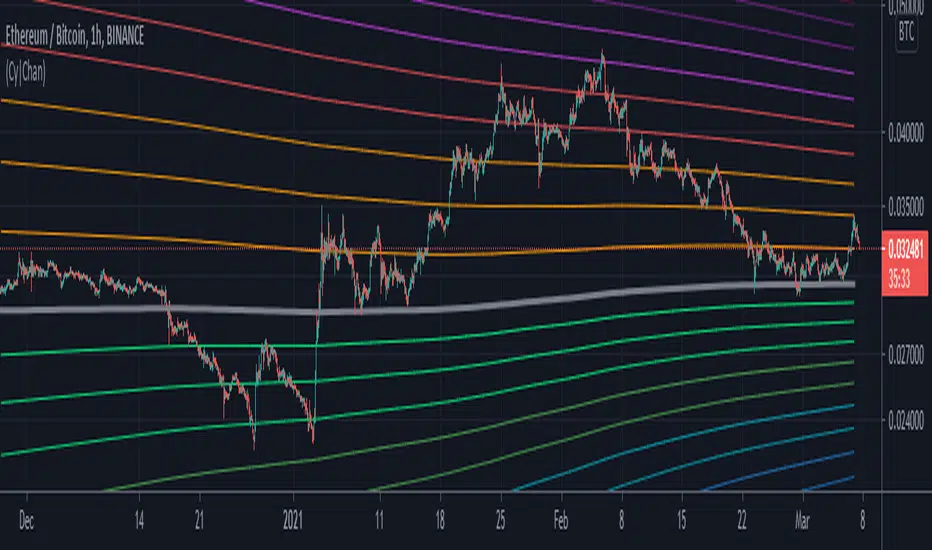
Cyber ChannelStandard deviation levels to determine if the price is over-extended in the positive/negative direction about the user defined MA line.
Historical confluence with the different levels can be used to estimate and predict the probability of a significant price retracement within given time-scale; and to help anticipate if the price is nearing local or all-time highs/lows.
ICT Killzone For Crypto Markets.Adjusted for Crypto 24/7 markets
Adjusted for UTC
i have hidden the asian open range and daily bars on my charts , you can choose to have them on
Less screen clutter
London Open 8:00 - 4:30 - Killzone 7:00 - 9:00
NewYork Open 9:30 - 4:00 Killzone 8:00 - 10:00
Shanghai open 9:15 Killzone 8:00 - 10:00
NOT MY ORIGINAL SCRIPT. JUST MODIFIED VERSION

Musashi MTF Trend HeatMapThis indicator compliments the Musashi TrendBars and allows convenient multi time frame analysis.
This HeatMap, shows 5 different time zones, each with color codes to indicate the trend expression of a corresponding timeframe.
- Dark Green = Good Uptrend (ok to enter short)
- Light Green = Uptrend but it can be exhausted (put in protective stops)
- Cyan = In Bull Trend but pulling back (be careful, maybe put in protective stops)
- Dark Red = Good Downtrend (ok to enter short)
- Orange = Downtrend but it can be exhausted (put in protective stops)
- Magenta = In Bear Trend but pulling back (be careful, maybe put in protective stops)
The dark grey markers on the Heat Map show when markets are not having strong trends.
*If you wish to license this indicator, please contact me via private message for details regarding access. Thank you.
LEGAL STUFF:
Risk Disclosure
Futures , forex, stock, crypto and derivative trading contains substantial risk and is not for every investor. An investor could potentially lose all or more than the initial investment. Risk capital is money that can be lost without jeopardizing ones’ financial security or life style. Only risk capital should be used for trading and only those with sufficient risk capital should consider trading. Past performance is not necessarily indicative of future results
Hypothetical Performance Disclosure
Hypothetical performance results have many inherent limitations, some of which are described below. no representation is being made that any account will or is likely to achieve profits or losses similar to those shown; in fact, there are frequently sharp differences between hypothetical performance results and the actual results subsequently achieved by any particular trading program. One of the limitations of hypothetical performance results is that they are generally prepared with the benefit of hindsight. In addition, hypothetical trading does not involve financial risk, and no hypothetical trading record can completely account for the impact of financial risk of actual trading. for example, the ability to withstand losses or to adhere to a particular trading program in spite of trading losses are material points which can also adversely affect actual trading results. There are numerous other factors related to the markets in general or to the implementation of any specific trading program which cannot be fully accounted for in the preparation of hypothetical performance results and all which can adversely affect trading results

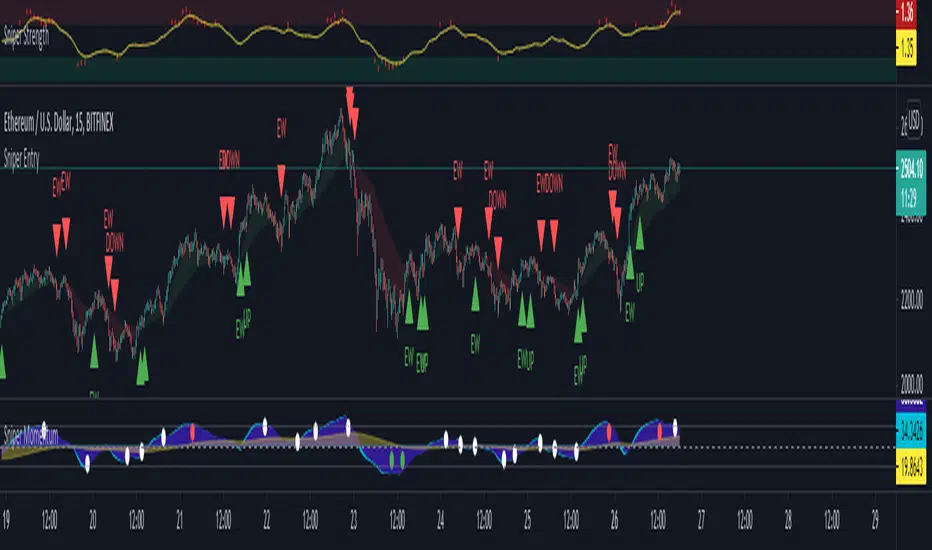
TA Night Bot AlertsThe absolutely most insane indicator for the Cryptoassets
With this script signals for short and long positions are recognized. It still has some false signals during extreme market movements, furthermore it runs best in the 15min & 5min chart. You can increase your risk limit in the settings. The indicator is based on different indicator values.
the indicator is a component of a superordinate algorithm and therefore not perfect.
who would like to test it pm
BTC
ETH
EOS
XRP

Money Flow Multi TF Indicator on Heikin Ashi (1m)Indicator provides multi timeframe Money Flow analysis. For example, it will show you when Money Flow is oversold or overbought on 1m and 5m and 15m at the same time. This indicator is working only on 1m timeframe and uses Heikin Ashi candles. It can be used on various instruments (crypto, forex, commodities). This indicator is primarily develop for using with alerts to get notified when interesting opportunity appears.

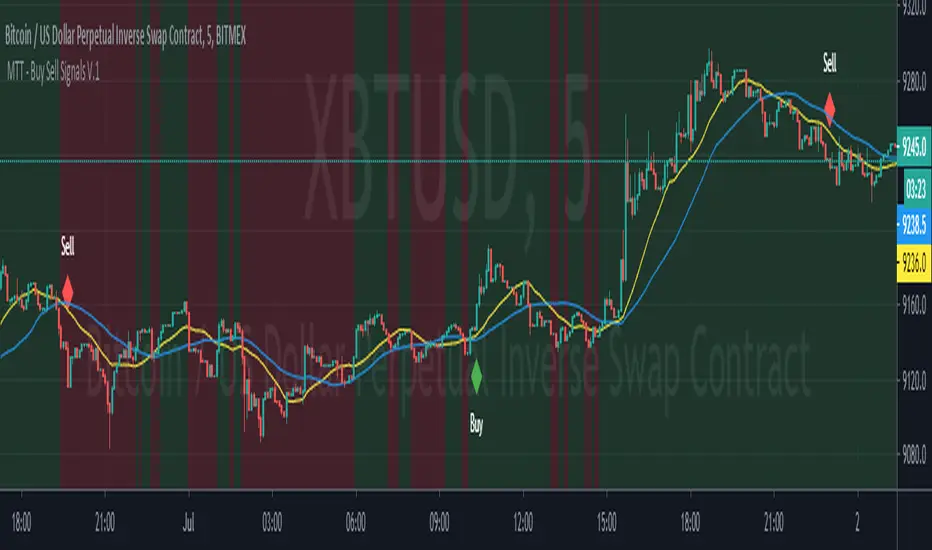
Market Trading Tools - Buy Sell SystemOur Buy Sell System indicator generally works on a modified version of the ATR ( Average True Range ) formula. The Buy Sell System is a trading method that generates Buy and Sell signals when conditions are met. These conditions include Exponential Moving Averages, ATR and depends on price action as well. Our indicator also shows a green/red background that indicates the trend on a chosen time frame.
** Our Indicator does not repaint.
** It can be used on any financial market; crypto, stocks or forex. We also encourage using time frames as the 15 minutes and above. The use of a higher than 4hr time frame requires special settings and once you have access to it, you can change the parameters as you want. We have enabled our users to freely use the settings as they wish and to their on discretionary.
Once you are granted access to use it, add it from going into the scripts >> invite only scripts >> enable the indicator. Once the indicator is added to your chart you will see the indicator popping up on your chart.
We are happy to announce that our trading indicator is special and unique from different ones because it firstly eliminates noise coming out from an average ATR indicator. We believe we are providing a service second to none and we are happy with our product.We believe that we have not seen a similar indicator, and we are proud of our work and we will continue updating the indicator when we believe it is necessary according to market changes. We have also enabled a function for our users to get a better view of the trend when they add the indicator to their chart. You can now view the trend background color (red&green) depending on if the price is above the EMA of your choice. you can also check whichever time interval you want that does not limit you to the time interval chosen on your chart itself.
Hope you enjoy it, Good luck and stay safe!
** If you are interested in this indicator. please use the link below to obtain access to this indicator
Market Trading Tools - Trend ReversalsOur Trend Reversals indicator is there to notify you when a trend reversal (depending on your time frame) might occur.
Trend Reversals will signal a cross shape signal (X), that will be in red when a downfall might happen and will be in green when a movement up is about or might happen. The indicator algorithm is based on 3 indicators, when these three intersect, the signal will be fired once the condition is met.
** Our Indicator does not repaint.
** It can be used on any financial market; crypto, stocks or forex. We also encourage using time frames as the 15 minutes and above. The use of a higher than 4hr time frame requires special settings and once you have access to it, you can change the parameters as you want. We have enabled our users to freely use the settings as they wish and to their own discretion.
Once you are granted access to use it, add it from going into the scripts >> invite only scripts >> enable the indicator. Once the indicator is added to your chart you will see the indicator popping up on your chart.
We believe that we have not seen a similar indicator, and we are proud of our work and we will continue updating the indicator when we believe it is necessary according to market changes. We have also enabled a function for our users to get a better view of the trend when they add the indicator to their chart. You can now view the trend background color (red&green) depending on if the price is above the EMA of your choice. you can also check whichever time interval you want that does not limit you to the time interval chosen on your chart itself.
Hope you enjoy it, Good luck and stay safe!
** If you are interested in this indicator. please use the link below to obtain access to this indicator

Market Trading Tools - DivergencesOur Divergence indicator is another indicator we are happy to present to interested traders. The indicator detects the possible trend change and it is a well known tool among traders based on bullish and bearish divergences.
To use the indicator well, it will spot divergences but some minimal work might be needed to be done as connecting the waves together to make sure that you get the best entries. You can also wait for the dots to appear in order to take a trade either long or short depending on whatever financial market you are trading and your trading strategy.
The red dots will signify a bearish divergence (trend reversal to the downside), while the green dots will signify a bullish divergence (trend reversal to the upside). The orange and purple dots also will signify a stronger divergence either bullish or bearish .
The divergence indicator we are publishing today works on crypto, stocks, forex, futures and almost all financial assets, however we do recommend using higher time frames for better results and to filter the noise around the divergences (dots), however using lower time frames can just allow you a better entry sometimes since reversals happen on lower time frames than larger ones.
Once you are granted access to use it, add it from going into the scripts >> invite only scripts >> enable the indicator (click on it once). Once the indicator is added to your chart you will see the indicator popping up to a lower pane.
We are happy to announce that our trading indicator is special and unique from different ones because of the features added above + we have added alerts to it. We believe that the indicator plotting and style on chart is also clean and easy for the eyes to catch compared to other indicators around. We have also enabled a function for our users to get a better view of the trend when they add the indicator to their chart. You can now view the trend background color (red&green) depending on if the price is above the EMA of your choice. you can also check whichever time interval you want that does not limit you to the time interval chosen on your chart itself.
Hope you enjoy it, Good luck and stay safe!
** If you are interested in this indicator. please use the link below to obtain access to this indicator
