Greer EPS Yield📘 Script Title
Greer EPS Yield – Valuation Insight Based on Earnings Productivity
🧾 Description
Greer EPS Yield is a valuation-focused indicator from the Greer Financial Toolkit, designed to evaluate how efficiently a company generates earnings relative to its current stock price. This script calculates the Earnings Per Share Yield (EPS%), using the formula:
EPS Yield (%) = Earnings Per Share ÷ Stock Price × 100
This yield metric provides a quick snapshot of valuation through the lens of profitability per share. It dynamically highlights when the EPS yield is:
🟢 Above its historical average (potentially undervalued)
🔴 Below its historical average (potentially overvalued)
🔍 Use Case
Quickly assess valuation attractiveness based on earnings yield.
Identify potential buy opportunities when EPS% is above its long-term average.
Combine with other indicators in the Greer Financial Toolkit for a fundamentals-driven investment strategy:
📘 Greer Value – Tracks year-over-year growth consistency across six key metrics
📊 Greer Value Yields Dashboard – Visualizes valuation-based yield metrics
🟢 Greer BuyZone – Highlights long-term technical buy zones
🛠️ Inputs & Data
Uses fiscal year EPS data from TradingView’s built-in financial database.
Tracks a static average EPS Yield to compare current valuation to historical norms.
Clean, intuitive visual with automatic color coding.
⚠️ Disclaimer
This tool is for educational and informational purposes only and should not be considered financial advice. Always conduct your own research before making investment decisions.
EPS

EPS and Sales Magic Indicator V2EPS and Sales Magic Indicator V2
EPS and Sales Magic Indicator V2
Short Title: EPS V2
Author: Trading_Tomm
Platform: TradingView (Pine Script v6)
License: Free for public use under fair usage guidelines
Overview
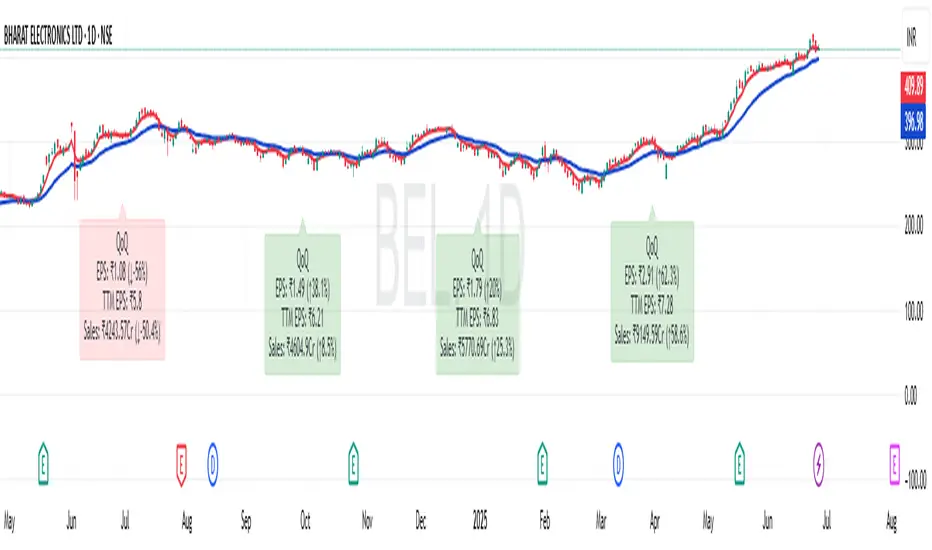
The EPS and Sales Magic Indicator V2 is a powerful stock fundamental visualization tool built specifically for TradingView users who wish to incorporate earnings intelligence directly onto their price chart. Designed and developed by Trading_Tomm, this upgraded version of the original 'EPS and Sales Magic Indicator' includes an enriched and more insightful presentation of company performance metrics — now with TTM EPS support, advanced color-coding, label sizing, and refined control options.
This indicator is tailored for retail traders, swing investors, and long-term fundamental analysts who need to view Quarter-over-Quarter (QoQ) earnings and revenue changes directly on the price chart without switching tabs or breaking focus.
What Does It Display?
The EPS and Sales Magic Indicator V2 intelligently detects quarterly financial updates and displays the following data points via labels:
1. EPS (Earnings Per Share) – Current Quarterly Value
This is the most recent Diluted EPS published by the company, fetched using TradingView’s request.financial() function.
Displayed in the format: EPS: ₹20.45
2. EPS QoQ Percentage Change
Shows the percentage change in EPS compared to the previous quarter.
Highlights improvement or decline using arrows (up for improvement, down for decline).
Displayed in the format: EPS: ₹20.45 (up 15.3 percent)
3. Sales (Revenue) – Current Quarterly Value
Fetches and displays Total Revenue of the company in ₹Crores for easier Indian-market readability.
Displayed in the format: Sales: ₹460Cr
4. Sales QoQ Percentage Change
Measures and presents the quarter-over-quarter percentage change in total revenue.
Uses arrows to indicate growth or contraction.
Displayed in the format: Sales: ₹460Cr (down 3.8 percent)
5. EPS TTM (Trailing Twelve Months)
You now get the TTM EPS — the sum of the last four quarterly EPS values.
This value provides a better long-term earnings snapshot compared to a single quarter.
Displayed in the format: TTM EPS: ₹78.12
All of these values are automatically calculated and displayed only on the bars where a new financial report is detected, keeping your chart clean and insightful.
Customization Features
This indicator is built with user control in mind, allowing you to personalize how and what you want to see:
Show EPS in Label: Enable or disable the display of EPS and EPS QoQ values.
Show Sales in Label: Toggle the visibility of revenue and sales change percentage.
Color Options for Label Themes: The label background color is automatically determined based on performance.
Green: Both EPS and Sales increased QoQ.
Red: Both decreased.
Orange: One increased and the other decreased.
Gray: Default color (if values are unavailable or mixed).
Label Text Size: Choose from Tiny, Small (default), or Normal.
Visual Design
Placement: The labels are positioned just below the candlesticks using yloc.belowbar, so they do not obstruct price action or interfere with technical indicators.
Anchor: Aligned precisely with the financial reporting bars to maintain clarity in historical comparisons.
Background Style: Clean, semi-transparent styling with soft text colors for comfortable viewing.
How It Works
The indicator relies on TradingView’s powerful request.financial() function to extract fiscal quarterly financials (FQ). Internally, it uses detection logic to identify fresh data updates by comparing current vs. previous values, arithmetic to compute QoQ percentage changes in EPS and Sales, logic to build formatted labels dynamically based on user selections, and conditional color and sizing logic to enhance interpretability.
Use Cases
For Long-Term Investors: Quickly identify if a company’s profitability and revenue are improving over time.
For Swing Traders: Combine recent earnings trends with price action to evaluate if post-result momentum has real backing.
For Technical and Fundamental Traders: Layer it with moving averages, RSI, or volume to create a hybrid analysis environment.
Limitations and Notes
Financial data is provided by TradingView’s financial API, and occasional missing values may occur for less-covered stocks.
This tool does not repaint but depends on the timing of the official financial updates.
All values are rounded and formatted to prioritize readability.
Works best on Daily or higher timeframes (weekly or monthly also supported).
License and Fair Use
This script is free to use and share under TradingView’s open-use guidelines. You may copy, fork, and build upon this indicator for personal or educational purposes, but commercial usage requires attribution to the author: Trading_Tomm.
Future Enhancements (Planned)
Addition of Net Profit (QoQ and TTM)
Inclusion of Operating Margin, Profit Margin, and Book Value
Option to switch between numeric and graphical display (table mode)
Alerts on extreme earnings deviation or sales slumps
Final Thoughts
The EPS and Sales Magic Indicator V2 represents a clean, visual, and smart way to monitor a company’s core performance from your chart screen. It helps you align fundamental strength with technical strategies and provides instant financial clarity, which is especially vital in today’s fast-moving markets.
Whether you’re preparing for an earnings season or scanning past performance to pick your next investment, this indicator saves time, enhances insights, and sharpens decisions.
Earnings Gap UpsBased on research conducted by John Pocorobba and Jason Thompson, the Earnings Gap Ups Indicator is designed to identify three types of earnings gaps, key levels, and the "alpha window"—a period when stocks often outperform following a gap. These gaps are frequently observed in high-performing stocks.
What is an Earnings Gap?
An earnings gap occurs when a stock's price makes a significant jump, after the company reports earnings signifying the street (institutions) were caught off guard.
The three different types of gaps are as follows: [/b
PEG (Power Earnings Gap)
Price gain of 10% or more
Volume is greater than 200% above the 50-day average
EPS surprise of at least 20%
Monster Gap
Price gain of 20% or more
Volume is greater than 300% above the 50-day average
No fundamental requirement
Monster Peg
Price Gain of 20% or more
Volume is greater than 300% above the 50-day average
EPS surprise of at least 20%
Key Levels and the Alpha Window
In addition to spotting these gaps, the indicator marks key levels on the chart and extends them through the alpha window, which represents the time period when the stock tends to outperform after the gap.
Key levels include:
High volume close: The closing price on a day with unusually high trading volume
High volume close minus 5%: A potential support level below the high volume close
Gap day high: The highest price reached on the gap day
Gap day low: The lowest price reached on the gap day
By understanding and tracking these gaps and levels, traders can map out a playbook for trading earnings gaps.

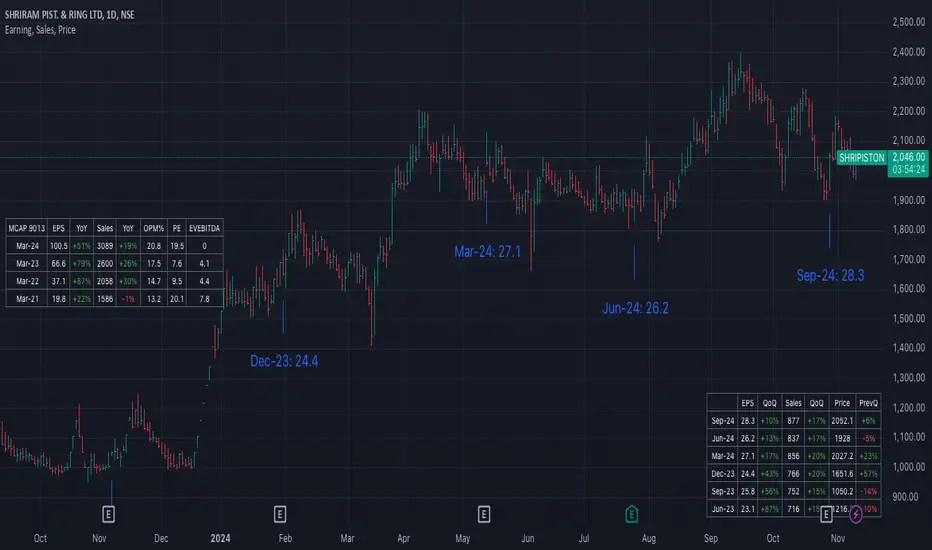
Earning, Sales, and PriceThis Pine Script indicator is designed to visualize and analyze the growth of Earnings Per Share (EPS) and Sales for a given stock over specified time periods. With a user-friendly interface, it allows traders and investors to monitor key financial metrics, helping them make informed decisions based on company performance.
The script presents earnings, sales, and price growth in a clear tabular format directly on the price chart. It features two distinct tables: one for annual data and another for quarterly metrics. For each financial metric, the script calculates and displays growth figures by comparing the current results with either the previous quarter's numbers or the previous year's figures. Additionally, it showcases the stock price along with the corresponding growth between these two data points, providing a comprehensive view of the stock's performance over time.
How to Use:
Typically, growth stocks will rally for a few quarters. However, after significant rallies, the stock needs rest. During this period, the stock will either consolidate or slide down slowly to take support at the key moving average. Importantly, during this time, sales and earnings may continue to grow while the stock is still consolidating.
Typically, after the stock consolidates significantly—even when sales and earnings numbers are increasing—the stock will finally start the next leg of the rally just before the next earnings date or immediately after the earnings report.
For this purpose, the script shows the EPS and sales growth. Additionally, the script displays the price when the previous earnings were declared along with the price growth. This data can be used to find patterns in the stock's behavior. Utilize this indicator to analyze growth patterns and make informed trading decisions based on historical performance and upcoming earnings expectations.
Key Metrics Analyzed:
Earnings Per Share (EPS): Monitors the diluted earnings per share to evaluate company profitability.
Total Revenue: Analyzes sales performance, providing insights into overall revenue generation.
Price Growth: Tracks changes in stock price alongside EPS and sales for comprehensive performance assessment.
Usage:
Ideal for investors and traders looking to evaluate company growth potential and make data-driven decisions.
Use in conjunction with other technical analysis tools for a holistic approach to stock analysis.
Performance IndicatorsDescription:
The Performance Indicators tool provides traders with a comprehensive overview of both fundamental and technical performance metrics of a security. This dual approach helps traders make informed decisions by evaluating the security's intrinsic value as well as its market behavior.
Fundamental Performance Indicators:
EPS Year Over Year % Growth : Measures the percentage growth in earnings per share (EPS) compared to the same quarter in the previous year. This helps in understanding the company's profitability trends.
EPS 3 Quarters Year Over Year % Growth : Analyzes the percentage growth in EPS over the last three quarters compared to the same quarters in the previous year, providing insight into the company's recent earnings performance.
Sales Year Over Year % Growth : Tracks the percentage growth in sales compared to the same quarter in the previous year, offering a view of the company's revenue trends.
Sales 3 Quarters Year Over Year % Growth : Evaluates the percentage growth in sales over the last three quarters compared to the same quarters in the previous year, helping to assess the company's recent revenue performance.
Return On Equity (ROE) : Measures the company's profitability by comparing net income to shareholder equity. This indicates how effectively the company is using its equity base to generate profits.
Market Capitalization : Represents the total market value of the company's outstanding shares, providing a sense of the company's size and market presence.
Float Shares Outstanding : Refers to the number of shares available for trading by the public, excluding restricted shares. This metric helps in understanding the liquidity and volatility of the stock.
Technical Performance Indicators:
Average Daily Range (ADR) %: Calculates the average range between the high and low prices over a specific period, expressed as a percentage. This helps in understanding the stock's daily volatility.
Average True Range (ATR) $ : Measures market volatility by calculating the average range between the high and low prices, taking into account any gaps in the price. It is expressed in dollar terms.
% Off 52-Week High : Indicates how far the current price is from the highest price achieved over the last 52 weeks, helping to assess the stock's current performance relative to its yearly peak.
Relative Price Strength (RPS) : Compares the stock's price performance to a benchmark index, helping to identify how the stock is performing relative to the broader market.
How it Works:
The fundamental performance indicators provide insights into the company's financial health and growth trends by analyzing key metrics such as EPS, sales growth, ROE, market capitalization, and float shares outstanding.
The technical performance indicators offer a view of the stock's market behavior and volatility through metrics like ADR, ATR, % off 52-week high, and RPS.
By combining these fundamental and technical metrics, traders can gain a well-rounded perspective on the security's overall performance.
How to Use:
Add the Performance Indicators tool to your chart.
Evaluate the fundamental indicators to assess the company's financial health and growth trends.
Analyze the technical indicators to understand the stock's market behavior and volatility.
Use the combined insights from both fundamental and technical indicators to make informed trading decisions.
This tool is particularly useful for traders who want to integrate both fundamental analysis and technical analysis into their trading strategy, providing a holistic view of a security's performance.


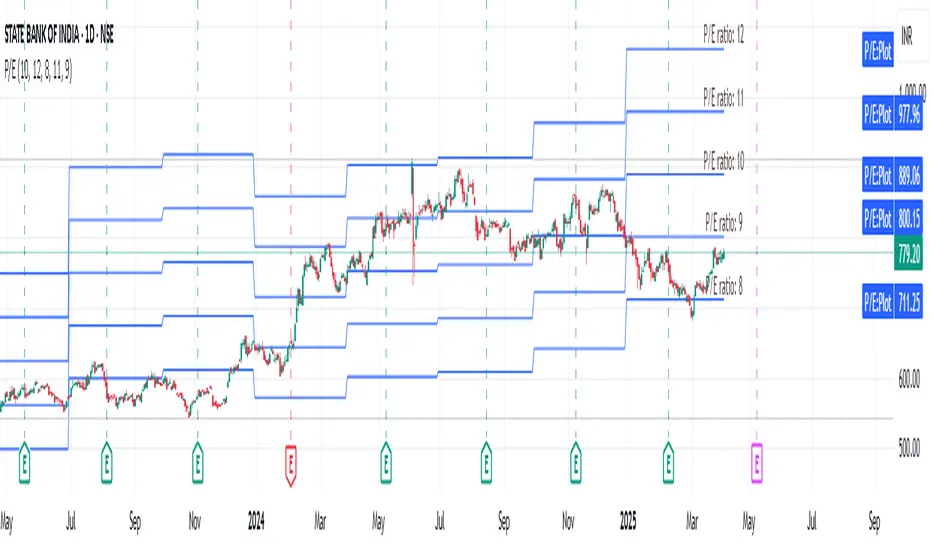
EPS GridIntroduction:
This simple indicator offers insights into the relationship between stock prices and earnings, aiding in the assessment of valuation dynamics during different periods.
Understanding Price-to-Earnings (P/E) Ratio:
The commonly used Price to Earnings (P/E) ratio, calculated as Current Price divided by Earnings Per Share (EPS) over the trailing 12 months (TTM), serves as a fundamental metric. Here, we use this formula to estimate a stock's price. For instance, multiplying EPS by 10 provides an approximation of the stock price with a P/E ratio of 10.
The Grid Concept:
Utilizing this principle, a visual grid is constructed to illustrate how stock prices correlate with earnings. This grid facilitates the identification of both potential bargains and overvalued stocks.
How to Utilize:
This indicator is pre-configured with earnings multiples of 10, 15, 20, and 25. Simply add it to your chart and observe whether earnings demonstrate consistent growth. If prices lag behind earnings, a potential catch-up phase may ensue in the future.
Happy Investing!
Embark on your investment journey armed with this indicator, and may it guide you towards informed decisions and successful ventures.
MarketSmith VolumesThe 'MarketSmith Volumes' is to be used with the 'MarketSmith Indicator' and 'EPS & Sales' in order to mimic fully MarketSmith Graphs with the maximum number of indicators allowed by a free Tradingview Plan: 3
This indicator is no more than a simple volume indicator where all parameters are already adjusted to resemble MarketSmith graphical volumes.
Also you will find integrated:
High Volumes Bars Peak :
They allow us to see peak volumes at a glance.
10-Week Average Volume :
When viewing a weekly chart, this line represents a 10-week moving average volume level. It allows you to see if the current Volume Bar of the week is above or under the average volume traded in the past 10 Weeks.
50-Day Average Volume :
When viewing a daily chart, this line represents a 50-day moving average volume level. Whether or not volume is above or below the average for a certain period could have a significant impact on your stock chart analysis.

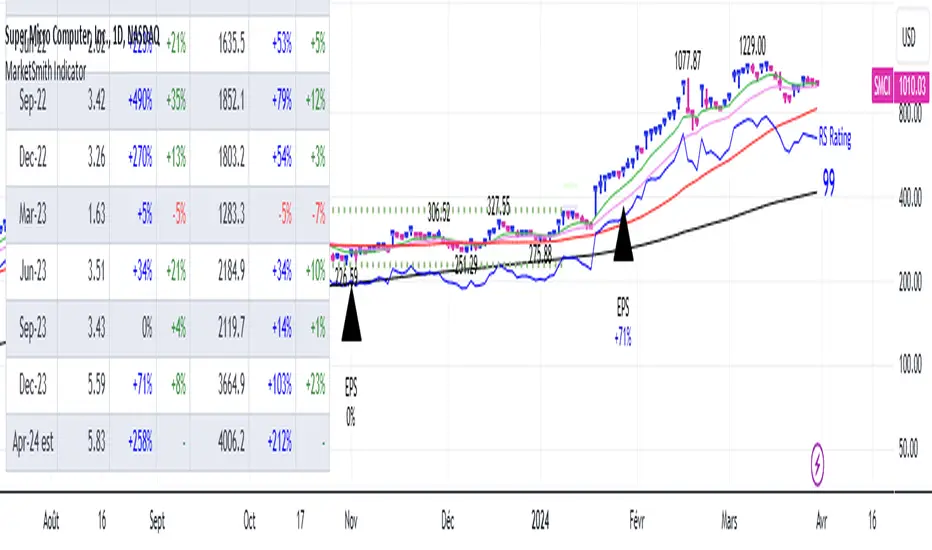
MarketSmith IndicatorThis script provides you with several indicators that will enable you to mimic MarketSmith charts, even with a free TradingView plan.
You can use this script with my ' EPS & Sales ' indicator.
MarketSmith-style bars
The script offers an original approach to managing candlesticks within the code, making them almost identical to those on MarketSmith.
For a perfect display, select ' Bars ' on your chart and set the opacity of your candles to 100% to display only the candles proposed by this indicator.
If you don't want them, you can simply disable them in the ' Style ' tab by unchecking 'MarketSmith Bars' and 'Chars'.
These candles are designed to be used with a fix chart. (No beautiful result with zooming in or out.)
Normally, the display will still be correct by right-clicking, and ' Reset Chart '.
Simple customizable moving averages
With automatic distinction of the weekly time unit. You can choose to display them or not, select the calculation method and modify their length via the panel.
The RS Rating indicator
I've integrated the RS Rating indicator into this script, as the RS Rating is a fundamental component of this layout.
High and valley points
These points are used by MarketSmith to detect bases, patterns, cup & handle.
Designed for US Market only you won't be able to screen correctly the India market for example.
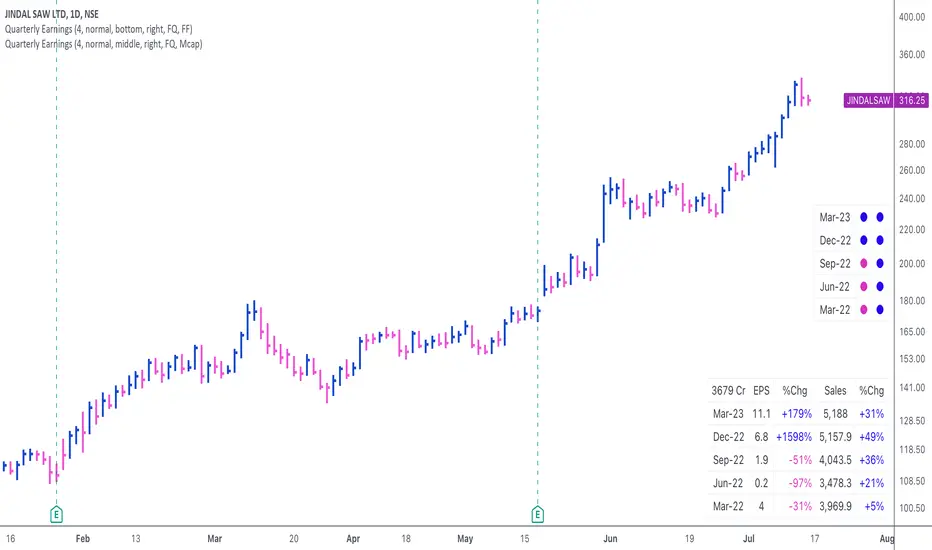
Quarterly EarningsThis script displays quarterly earnings per share (EPS) and sales data, and their year-on-year percentage change.
The script builds upon the Volume Price and Fundamentals script by Mohit_Kakkar08 and improves upon the array functions to keep the code light-weight & the output as accurate as possible. This script uses diluted EPS data for calculating the quarterly earnings. New quarters are auto-generated by the script as the earnings data gets updated in Tradingview every quarter.
Features:
⦿ View quarterly earnings per share (EPS) and sales data.
⦿ The percentage change is a YoY (year on year) comparison of the current quarter to the same quarter of the previous year.
⦿ Option to change the data from Quarterly (FQ) to Yearly (FY) .
⦿ Long mode : Option to increase the number of previous quarters displayed in the table (default is the past 4 quarters) to any number.
⦿ Location & size of the table can be changed.
⦿ Option for a 1-click dark mode
⦿ Option for a ' Mini mode ' where the values are replaced by traffic lights for a quick visual:
🟢 or 🔵 YoY increase in earnings/sales
🔴 or 🟣 YoY decrease in earnings/sales
🟡 or 🟠 YoY earnings/sales unchanged
⚪️ No data available
⦿ The top-left cell has the option to display either the free float (FF) or the marketcap (Mcap) of the stock.
Please note that sometimes the Tradingview data reflected in the script output might differ a bit from MarketSmith. Also make sure you are viewing the 'consolidated' data there.
This script was developed as a collaboration between me & @EquityCraze .
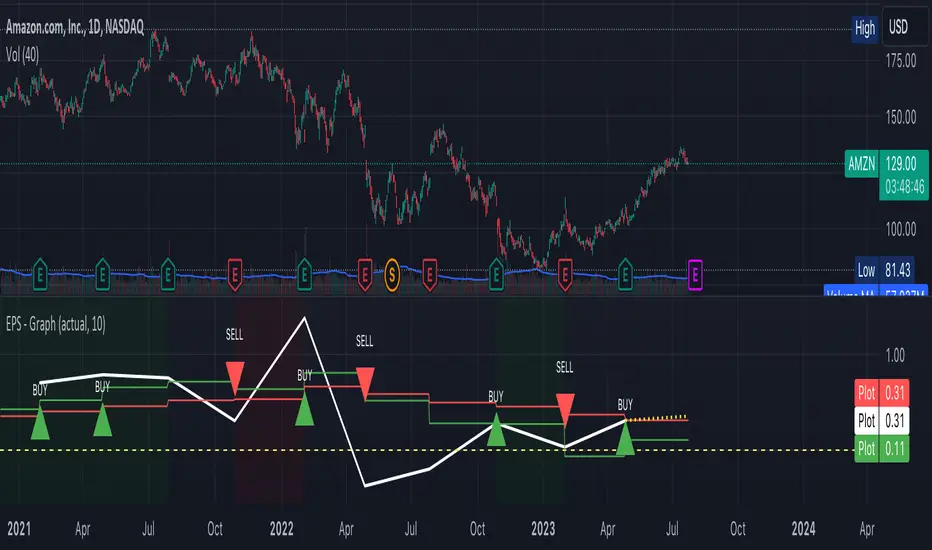
EPS GrowthA graph to display EPS growth with a trailing simple moving average of the last 4 and 8 periods.
Periods of earnings recessions have a dark red background.
Periods of earnings expansion have a dark green background.
A buy signal/sell signal is generated if the actual period earnings beat the estimates.
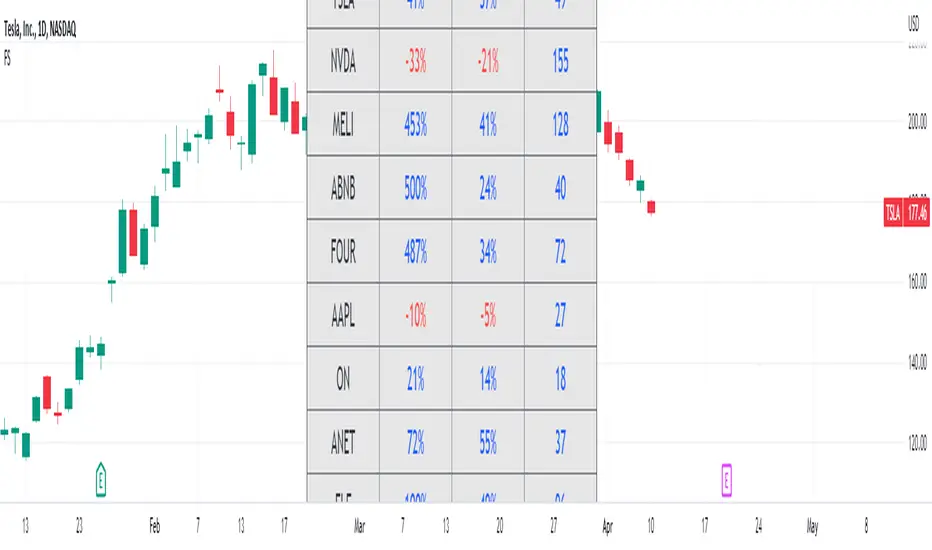
Fundamental ScreenerThis indicator is designed to compare the year-over-year earnings and sales growth, as well as the P/E ratio of up to 10 stocks simultaneously .
This provides valuable insights into the fundamental performance of multiple stocks at the same time, allowing traders to quickly identify which stocks are outperforming or underperforming their peers.
The earnings and sales growth figures are calculated on a year-over-year basis , comparing the most recent quarter to the same quarter 1 year ago.
The P/E ratio is a valuation metric that measures a company's stock price relative to its trailing twelve months earnings per share.
By comparing these three key metrics across multiple stocks, traders can quickly identify which stock in a group has superior fundamentals.
Customization
Chose to compare 5 or 10 symbols
Table position, color, and size
Financials - Comparing CompaniesHello All
For a while I have been working on this indicator to compare financials of the companies and sort them accordingly. Finally I completed and published it. I preferred using new object type feature in Pine language™ and I hope it might be an example and helpful for the developers.
First of all, as we have limitation on security calls, the indicator can get and compare financials for 5 companies only. also Chart time frame must be 1Day or higher! ( I recommend 1Day time frame ). if not then the indicator stops and shows the error message: "Please set the time frame 1Day or higher" . More important than others: You should choose the companies from the same sector! Compare apples to apples :)
The Financials in the indicator:
Earnings Per Share
Price to Earnings Ratio
Price to Sales Ratio
Price to Book Ratio
Profit Margin
Dept to Equity
Current Ratio
Market Capitalization
Also more information shown for each stocks:
Closing Price, sets the color accordingly
2 Simple/Exponential moving average, you can set the length, also it checks if it is rising/falling and sets the color accordingly
Volume info
Average volume (20 days), you can set the period
Currency for each security
Lets see some features in it:
it sorts the companies according to the financials:
If you move the mouse onto any header then it shows explanation about the financial:
You can change location and text size:
You can set the type of Moving averages as SMA or EMA and you can also set the length for both . Headers for both are changed automatically by MA type and length
Colors for Closing price and MA cells are set automatically:
For new Objects in Pine language click here
P.S. You can use this indicator while analyzing the financials of the companies in same sector/industry. So please don't ask for the alerts :)
Enjoy!


Financial MetricsGives a sneak peak into some of the important financial ratios described below:
1. P/E : price to earnings ratio (Green when P/E<15)
2. PEG: Price to earnings growth ratio (Green when PEG<1)
3. P/S: Price to sales ratio (Green when P/S<2)
4. EV/FCF: Enterprise Value to Free Cashflow ratio
5. OPM: Operating Profit Margin % (Green when OPM>15%)
6. D/E: Debt to equity ratio (Green when D/E<1)
7. ROE: Return on equity % (Green when ROE>15%)
8. Div_Yield: Dividend yield
Disclaimer: All the limits defined are based on the widely accepted general values, but are subjective to particular sector or group of stocks. For example IT stocks command higher valuation than cyclical stocks like metal. So Compare with other stocks of the same sector to reach any conclusion.

EPS & SalesHi everyone,
I just adapted a little utility script to visualise EPS % increase (quarters vs Year -1) and sales.
I used the code from @ARUN_SAXENA and modified it to fix what I saw as issues.
(Using base 3M instead of 1M +
request.earnings(syminfo.tickerid, earnings.actual, ignore_invalid_symbol=true)
instead of
request.financial(syminfo.tickerid, "EARNINGS_PER_SHARE", "FQ")
Data will differ from MarketSmith because they use sometimes actual EPS sometimes standard, but think we can at least trust what we see in term of %
The tool is far from being perfect !

EPS Surprise (Working)Plots the EPS surprise between reported and estimate.
* This is a working version of the old EPS Surprise indicator here that seems to have been abandoned.


EPS DashboardThis script creates a little table in an indicator below your chart that allows you to view the earnings per share over the last year as well as calculates the year over year earnings per share growth. According to IBD, strong EPS growth is a great indicator of a potential super-performer stock so hopefully this will make it easier to keep an eye on this metric. Note it does not work on things without financial data like crypto, indexes, and ETFs.

Pretax EPS 10XA very rudimentary version of Warren Buffett's 10X Pretax Rule:
How it works:
I took the Financial data provided on the platform; Annual 'Pretax Income' divided by the Annual 'Total Common Shares Outstanding', then multiply by 10.
Reason:
There are many annual reports to suggest that when Warren Buffet buys large quantities of stocks, they are bought at a price under the 10X Pretax EPS and sold when its above.
Risk:
There are obviously many different reasons why Warren Buffett buys a stock, so buying every stock under the 10X Pretax EPS DOES NOT guarantee future gain. This is intended as a helpful insight AMONGST many to identify good entry levels.
Uses:
This works well with long established high quality companies but not so much with new growth momentum companies due to negative earnings.
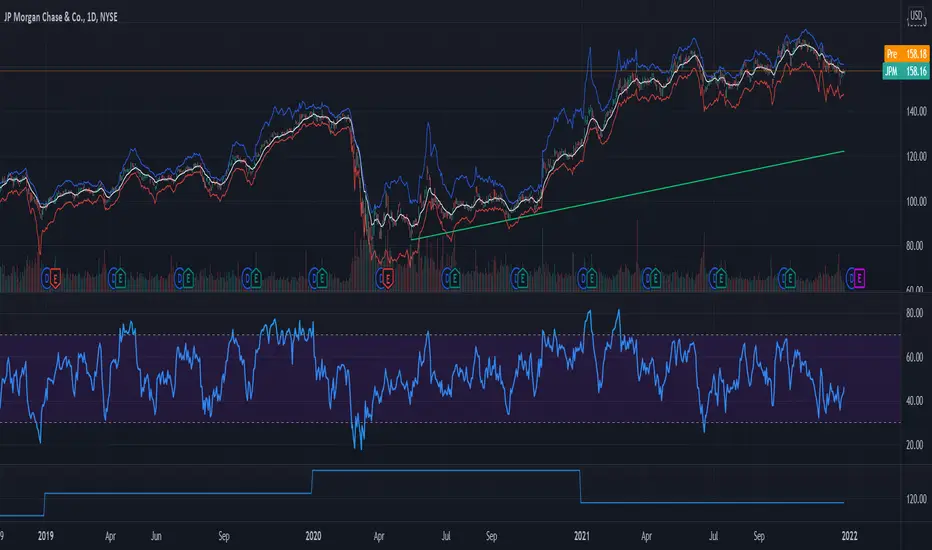
EPS_REVENUE_PSR indicatorQuarterly EPS, PER, total revenue(FQ) (in million unit), PSR can be shown as an indicator.
Check only one indicator for the chart visibility.
四半期毎のEPS, PER, 年間売上, PSRをインジケーターとして表示することができます。
チャートを見やすくするために1つのインジケーターを選択してください。
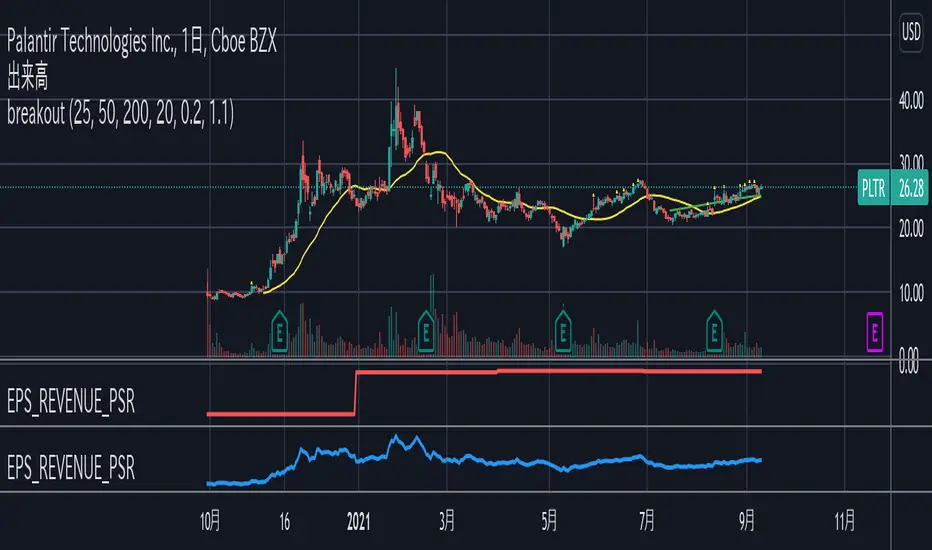
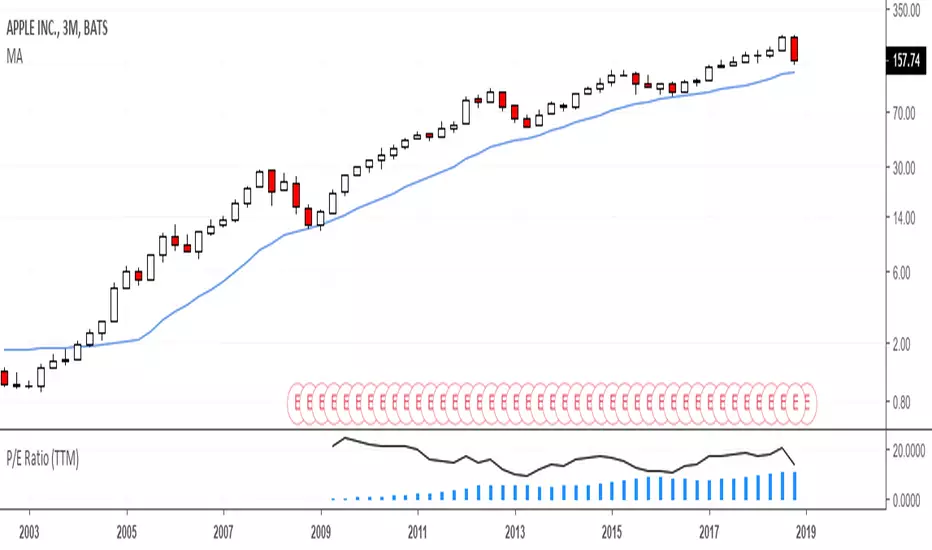
EPS and PER indicatorThis indicator shows quarterly EPS and PER.
Uncheck EPS or PER for the chart visibility.
"standard" and "diluted" mode can be selected for EPS setting.
このインジケーターは四半期のEPSとPERを表示します。
チャートを見やすくするためにはEPSまたはPERのチェックをオフにしてください。
EPSの設定として「通常」と「希薄化後」のモードを選択することができます。
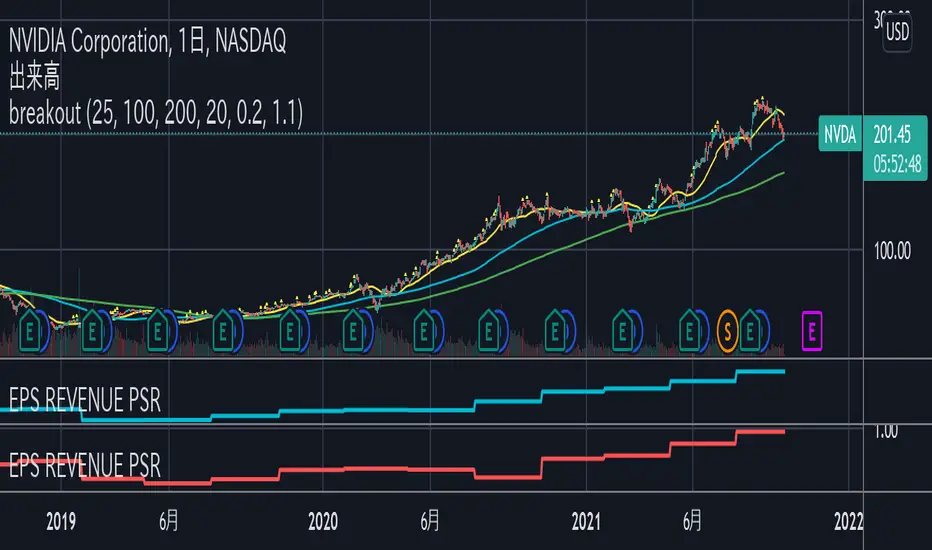
P1 FundamentalsP1 is because to me, this is a priority 1 indicator, so I have P1 and P2 indicators ordered on the favorite list.
What can you check on the selection pane?
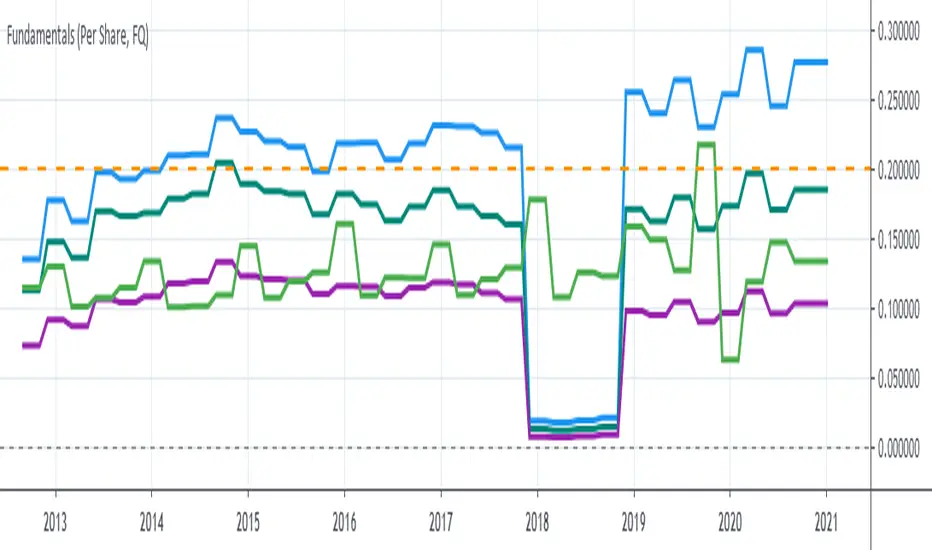
On “period”, you can show the data related to:
the fiscal quarters
or the fiscal years.
You can select a pack of financial data that I have organized in sections:
Revenue & earnings
EPS & DPS (EPS, EPS estimate, DPS and dividend payout ratio )
Debt (total debt, total equity and cash & equivalents)
Returns (ROE, ROIC, ROA and R&D revenue to ratio)
I recommend to just select one of them, in other case the chart is a mess.
Any feedback on the code is welcome!!
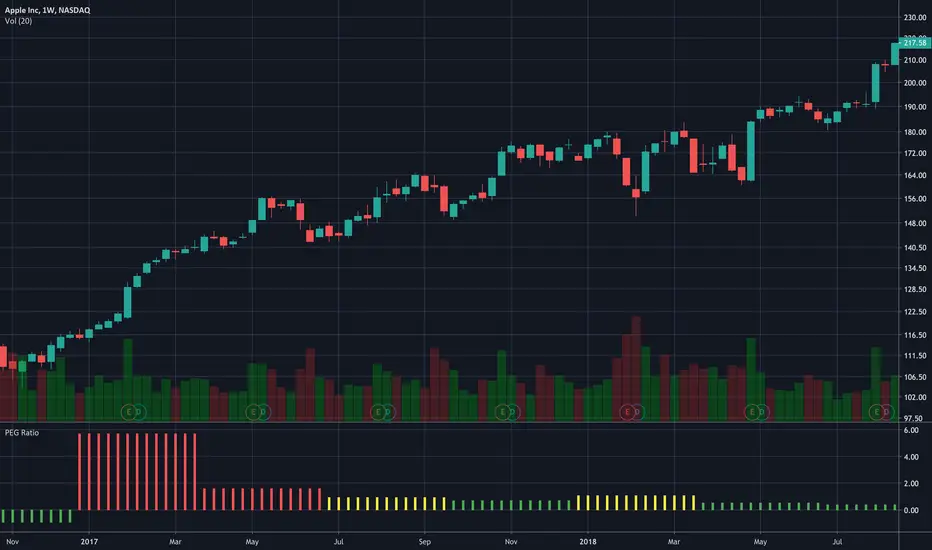
PEG RatioHello everyone,
Quick script to check the PEG Ratio.
What is PEG Ratio?
The price/earnings to growth ratio (PEG Ratio) is a stock's price-to-earnings (P/E) ratio divided by the growth rate of its earnings for a specified time period. The PEG ratio is used to determine a stock's value while also factoring in the company's expected earnings growth, and is thought to provide a more complete picture than the more standard P/E ratio.
A PEG Ratio greater than 1.0 means that the stock is overvalued, while below 1.0 means is is undervalued. When the PEG Ratio is exactly 1.0, then the stock is trading at fair valuation.
Formula:
PEG Ratio = (Price / EPS) / EPS Growth
Examples:
Company A:
Price per share = $46
EPS this year = $2.09
EPS last year = $1.74
Company B
Price per share = $80
EPS this year = $2.67
EPS last year = $1.78
Company A
P/E ratio = $46 / $2.09 = 22
Earnings growth rate = ($2.09 / $1.74) - 1 = 20%
PEG ratio = 22 / 20 = 1.1
Company B
P/E ratio = $80 / $2.67 = 30
Earnings growth rate = ($2.67 / $1.78) - 1 = 50%
PEG ratio = 30 / 50 = 0.6
The company A is overvalued whiled the B is undervalued.
In this script an overvalued stock is considered when the PEG Ratio is above 1.1, while it is 0.9 for an undervalued stock.
Only works with Stocks.
Happy trading,