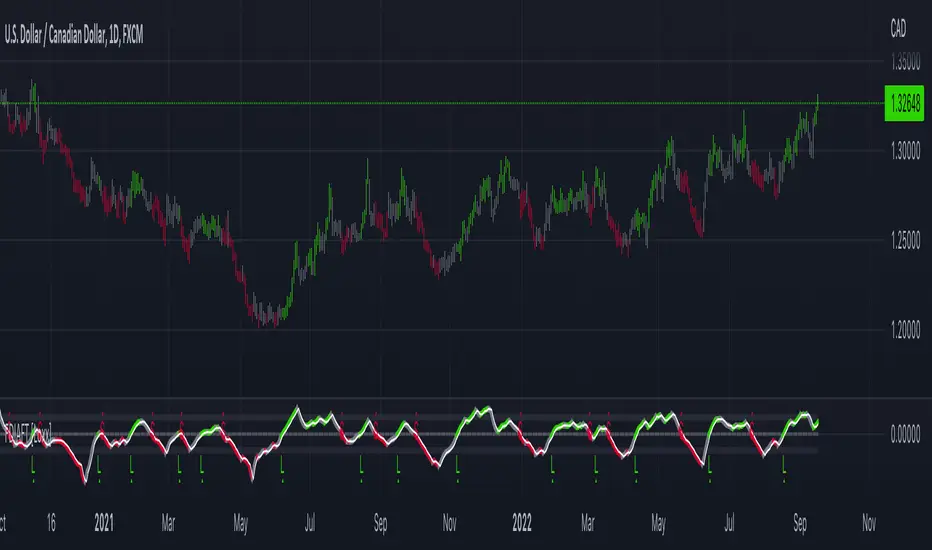
Fisher Transform w/ Cross in MTFFisher Transform from Tradingview Technical indicators, modified to hard code settings for various time frames and to plot crosses.
Fisher Transform

RSI OS/OB Background StripesThe "RSI OS/OB Background Stripes" indicator is a simple tool designed to help traders visualize overbought and oversold market conditions using the Relative Strength Index (RSI). It highlights these conditions by displaying colored background stripes directly on your chart, making it easy to spot potential trading opportunities.
How It Works:RSI Calculation: The indicator calculates the RSI, a popular momentum indicator that measures the speed and change of price movements, using a default period of 14 (customizable).
Overbought/Oversold Levels: It marks areas where the RSI is above a user-defined overbought level (default: 70) with red background stripes, and below an oversold level (default: 30) with green background stripes.
Visual Feedback: The colored stripes appear on the chart when the RSI enters overbought (red) or oversold (green) zones, helping you quickly identify market conditions.
Customization: You can adjust the RSI period, overbought/oversold levels, background colors, and transparency. You can also choose to show the RSI line in a separate panel or display RSI values on the chart for debugging.
Alerts: The indicator includes optional alerts that notify you when the RSI crosses into overbought or oversold territory.
Who It’s For: This indicator is perfect for beginner and intermediate traders who want a clear, visual way to track RSI-based overbought and oversold conditions without cluttering their charts.
Key Features:Easy-to-read background stripes for overbought (red) and oversold (green) conditions.
Fully customizable RSI settings, colors, and transparency.
Optional RSI plot and value display for deeper analysis.
Alerts to keep you informed of key RSI level crossings.
This indicator is a straightforward way to monitor market momentum and make informed trading decisions.

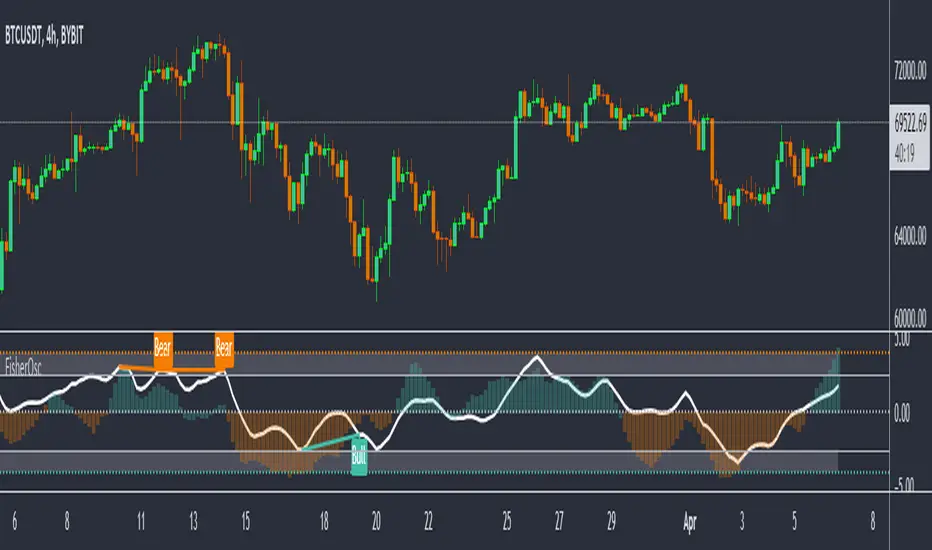
Fisher OscillatorThe indicator highlights when prices have moved to an extreme level, based on recent prices. This may help in spotting turning points in the price of an asset. It also helps show the trend and isolate the price waves within a trend.
Pro Scalper AI [BullByte]The Pro Scalper AI is a powerful, multi-faceted scalping indicator designed to assist active traders in identifying short-term trading opportunities with precision. By combining trend analysis, momentum indicators, dynamic weighting, and optional AI forecasting, this tool provides both immediate and latched trading signals based on confirmed (closed bar) data—helping to avoid repainting issues. Its flexible design includes customizable filters such as a higher timeframe trend filter, and adjustable settings for ADX, ATR, and Hull Moving Average (HMA), giving traders the ability to fine-tune the strategy to different markets and timeframes.
Key Features :
- Confirmed Data Processing :
Utilizes a helper function to lock in price and volume data only from confirmed (closed) bars, ensuring the reliability of signals without the risk of intrabar repainting.
- Trend Analysis :
Employs ADX and Directional Movement (DI) calculations along with a locally computed HMA to detect short-term trends. An optional higher timeframe trend filter can further refine the analysis.
- Flexible Momentum Modes :
Choose between three momentum calculation methods—Stochastic RSI, Fisher RSI, or Williams %R—to match your preferred style of analysis. This versatility allows you to optimize the indicator for different market conditions.
- Dynamic Weighting & Volatility Adjustments :
Adjusts the contribution of trend, momentum, volatility, and volume through dynamic weighting. This ensures that the indicator responds appropriately to varying market conditions by scaling its sensitivity with user-defined maximum factors.
- Optional AI Forecast :
For those who want an extra edge, the built-in AI forecasting module uses linear regression to predict future price moves and adjusts oscillator thresholds accordingly. This feature can be toggled on or off, with smoothing options available for more stable output.
- Latching Mode for Signal Persistenc e:
The script features a latching mechanism that holds signals until a clear reversal is detected, preventing whipsaws and providing more reliable trade entries and exits.
- Comprehensive Visualizations & Dashboard :
- Composite Oscillator & Dynamic Thresholds : The oscillator is plotted with dynamic upper and lower thresholds, and the area between them is filled with a color that reflects the active trading signal (e.g., Strong Buy, Early Sell).
- Signal Markers : Both immediate (non-latching) and stored (latched) signals are marked on the chart with distinct shapes (circles, crosses, triangles, and diamonds) to differentiate between signal types.
- Real-Time Dashboard : A customizable dashboard table displays key metrics including ADX, oscillator value, chosen momentum mode, HMA trend, higher timeframe trend, volume factor, AI bias (if enabled), and more, allowing traders to quickly assess market conditions at a glance.
How to Use :
1. S ignal Interpretation :
- Immediate Signals : For traders who prefer quick entries, the indicator displays immediate signals such as “Strong Buy” or “Early Sell” based on the current market snapshot.
- Latched Signals : When latching is enabled, the indicator holds a signal state until a clear reversal is confirmed, offering sustained trade setups.
2. Trend Confirmation :
- Use the HMA trend indicator and the optional higher timeframe trend filter to confirm the prevailing market direction before acting on signals.
3. Dynamic Thresholds & AI Forecasting :
- Monitor the dynamically adjusted oscillator thresholds and, if enabled, the AI bias to gauge potential shifts in market momentum.
4. Risk Management :
- Combine these signals with additional analysis and sound risk management practices to determine optimal entry and exit points for scalping trades.
Disclaimer :
This script is provided for educational and informational purposes only and does not constitute financial advice. Trading involves risk, and past performance is not indicative of future results. Always perform your own analysis and use proper risk management strategies before trading.

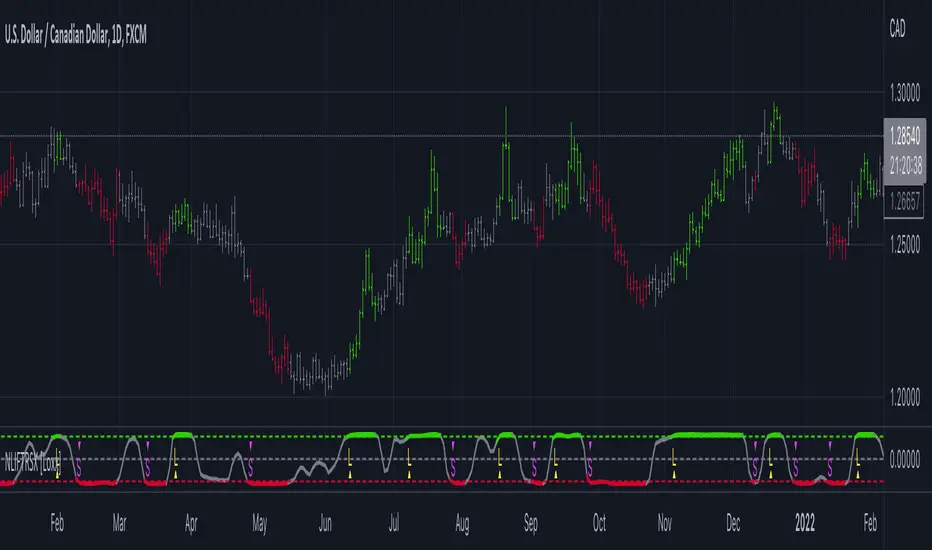
RSI + Normalized Fisher Transform with SignalsThis indicator combines three tools for market analysis: the Relative Strength Index (RSI), the RSI's moving average, and the Fisher Transform. RSI is a momentum oscillator that measures the speed and change of price movements, helping identify overbought and oversold conditions. The RSI moving average is a smoothed version of the RSI that filters noise and confirms trends. The Fisher Transform is a mathematical technique that transforms price data into a Gaussian normal distribution, making it easier to identify turning points. It has been normalized to the same scale as the RSI (0-100) for consistency.
Purpose
The goal of this indicator is to identify potential buy and sell opportunities with varying degrees of strength (strong and weak). By combining the RSI, its moving average, and the Fisher Transform, the indicator ensures signals are based on both momentum and reversals, making it highly versatile across different market conditions.
Key Features
This indicator provides strong and weak buy and sell signals. A strong buy occurs when the RSI crosses above its moving average while both the RSI and its moving average are oversold (below the default threshold of 30), and the Fisher Transform reverses direction within the same or prior bar while also being oversold. A weak buy occurs when the Fisher Transform is oversold, and the RSI crosses above its moving average while its value is between the default oversold threshold (30) and 50. A strong sell occurs when the RSI crosses below its moving average while both the RSI and its moving average are overbought (above the default threshold of 70), and the Fisher Transform reverses direction within the same or prior bar while also being overbought. A weak sell occurs when the Fisher Transform is overbought, and the RSI crosses below its moving average while its value is between 50 and the default overbought threshold (70).
The indicator includes customizable thresholds and lengths. Users can adjust the oversold and overbought thresholds to suit their trading style. The RSI length, moving average length, and Fisher Transform length are also customizable. The Fisher Transform is scaled to the RSI’s range of 0-100 to simplify analysis and signal interpretation.
How to Use the Indicator
On the chart, you will see the RSI line in blue, the RSI moving average in orange, and the Fisher Transform in purple. Horizontal lines at the default oversold (30) and overbought (70) levels mark critical zones for signals. Adjust these thresholds in the indicator settings as needed.
Strong buy signals are shown as larger, darker green arrows below the price. Weak buy signals are small lime arrows below the price. Strong sell signals are larger, darker red arrows above the price. Weak sell signals are small fuchsia arrows above the price.
Signal Interpretation
A strong buy indicates a highly favorable buying opportunity. This typically occurs when the asset is in a downtrend but shows signs of reversal, particularly in oversold zones. A weak buy suggests a potential buying opportunity but with less conviction, often when the market is neutral to slightly bearish but showing upward momentum. A strong sell indicates a highly favorable selling opportunity, usually occurring when the asset is in an uptrend but shows signs of reversal, particularly in overbought zones. A weak sell suggests a potential selling opportunity but with less conviction, often in neutral to slightly bullish markets showing downward momentum.
Practical Tips
Avoid using signals in isolation. Combine this indicator with other tools such as trendlines, moving averages, or support/resistance levels for greater accuracy. Adjust the parameters for different assets to match their volatility. For volatile assets, consider wider thresholds like 20/80 for oversold/overbought levels. For less volatile assets, tighter thresholds like 35/65 may be more appropriate. Use higher timeframes to confirm signals before trading on lower timeframes. Be cautious in sideways markets, as both RSI and the Fisher Transform perform better in trending conditions.
Instructions for Adjustments
To change the oversold or overbought levels, open the indicator settings by clicking the gear icon and modify the "Oversold Threshold" and "Overbought Threshold" values. To adjust lengths for RSI and Fisher Transform, update the "RSI Length," "RSI Moving Average Length," and "Fisher Transform Length" settings. If needed, toggle signal visibility by enabling or disabling specific arrows (Strong Buy, Weak Buy, Strong Sell, Weak Sell) in the "Style" tab.
Best Practices
Risk management is essential. Always set appropriate stop-loss levels and position sizes based on your risk tolerance. Backtest the indicator on historical data to understand its performance and behavior for your chosen asset and timeframe. Combining this indicator with volume or volatility analysis (Bollinger Band Width, for example) can help confirm signal validity.
This indicator simplifies decision-making by identifying high-probability trading opportunities using a combination of momentum, trend, and reversals. Follow these instructions to fully utilize its capabilities without needing to analyze the underlying code.

Inverse Fisher Oscillator [BigBeluga]The Inverse Fisher Oscillator is a powerful tool for identifying market trends and potential reversal points by applying the Inverse Fisher Transform to normalized price data. This indicator plots multiple smoothed oscillators, each color-coded to signify their relation to dynamic volatility bands. Additionally, the Butterworth filter is incorporated to further refine trend signals. The Inverse Fisher Oscillator offers traders a visually appealing and insightful approach to trend analysis and market direction detection.
🔵 KEY FEATURES
● Inverse Fisher Oscillator Visualization
Multiple Oscillators : The indicator calculates and plots six different Inverse Fisher Oscillators, each smoothed at increasing levels to provide a layered view of price momentum.
Color-Coded Signals : The oscillator lines are color-coded based on their relation to the volatility bands—green for bullish momentum, red for bearish momentum, and yellow for neutral movements.
● Butterworth Filter Integration
Filtering : The Butterworth filter is applied to mid-line Bands to reduce noise, allowing for clearer trend detection.
// Calculate constants for the Butterworth filter
float piPrd = math.pi / mid_len
float g = math.sqrt(2)
float a1 = math.exp(-g * piPrd)
float b1 = 2 * a1 * math.cos(g * piPrd)
float coef2 = b1
float coef3 = -a1 * a1
float coef1 = (1 - b1 + a1 * a1) / 4
// Source data for the Butterworth filter
float source = ifish // The first inverse Fisher Oscillator is used as the source
// Previous source and butter filter values
var float butter = na // Initialize the 'butter' variable
// Handle null values using the nz function
float prevB1 = nz(butter , source) // Use 'source' as a fallback if butter is null
float prevB2 = nz(butter , source) // Use 'source' as a fallback if butter is null
// Calculate the Butterworth filter value
butter := coef1 * (source + (2 * source ) + source ) + (coef2 * prevB1) + (coef3 * prevB2)
● Numbered Signal Marks
Signal Markers : The indicator plots numbered signals on the chart when an oscillator crosses above the upper volatility band or below the lower volatility band.
Numbered Lines : Numbers correspond to the different oscillators (1-6), helping traders easily identify which smoothing level generated the signal.
Visual Cues : The signals are color-coded—green for bullish crossovers and red for bearish crossunders—providing clear visual cues for trend accumulation phases.
Mid-Line Option : Traders can choose between plotting the Butterworth filter as a dynamic mid-line or simply displaying it as part of the bands.
Volatility Bands : Dynamic volatility bands provide additional context for interpreting the strength and sustainability of trends.
● Dashboard Display
Real-Time Market Trend Overview : The dashboard in the bottom-right corner of the chart displays the market trend based on the Inverse Fisher Oscillator for six different smoothing levels, providing a clear visual summary of market direction.
Direction Symbols : Directional symbols (up, down, or neutral) are displayed in the dashboard, color-coded to represent bullish, bearish, or neutral momentum.
Current Price Display : The dashboard also shows the current price and highlights whether it is above or below the opening price.
🔵 HOW TO USE
● Identifying Trend Reversals
Bullish Reversals : When the oscillators short period lines start to cross above the upper volatility band (green), it indicates potential bullish momentum.
Bearish Reversals : When the oscillator crosses below the lower volatility band (red), it signals potential bearish momentum.
Neutral Signals : When the oscillator remains within the bands (yellow), it suggests that the market is in a neutral or consolidating state. Traders may choose to wait for a clearer trend signal.
● Using the Dashboard for Trend Overview
Market Trend Summary : The dashboard provides a quick overview of market direction across six different smoothing levels. Green arrows indicate bullish momentum, red arrows indicate bearish momentum, and wavy lines suggest neutrality.
Price Context : The dashboard also displays the current price, helping traders quickly assess whether the price is moving in the expected direction relative to their trend analysis.
● Volatility Band Interpretation
Volatility-Based Signals : Pay attention to how the oscillators interact with the volatility bands. Strong trends will often result in oscillators staying above or below the bands, while weaker trends or consolidations will see oscillators hovering within the bands.
🔵 CUSTOMIZATION
Length and Smoothing : Adjust the length and smoothing parameters to fit different market conditions and timeframes.
Bands Multiplier : Customize the multiplier for the volatility bands to make them more or less sensitive to price changes.
Mid-Line Type : Choose whether to display the Butterworth filter as a mid-line or incorporate it into the volatility bands.
Signal Markers : Toggle on or off the number markers for signal crossovers, making it easier to identify key entry and exit points.
🔵 CONCLUSION
The Inverse Fisher Oscillator combines the power of the Inverse Fisher Transform and the Butterworth filter to provide a sophisticated approach to trend and reversal detection. By leveraging volatility-based analysis and visually intuitive signals, this indicator helps traders spot potential entry and exit points with greater clarity. The customizable dashboard display adds further value, offering a real-time summary of market conditions to enhance decision-making. Use this tool in conjunction with other technical analysis methods to develop a well-rounded trading strategy.

Fisher Transform on RSIOverview
The Fisher Transform on RSI indicator combines the Relative Strength Index (RSI) with the Fisher Transform to offer a refined tool for identifying market turning points and trends. By applying the Fisher Transform to the RSI, this indicator converts RSI values into a Gaussian normal distribution, enhancing the precision of detecting overbought and oversold conditions. This method provides a clearer and more accurate identification of potential market reversals than the standard RSI.
Key/Unique Features
Fisher Transform Applied to RSI : Transforms RSI values into a Gaussian normal distribution, improving the detection of overbought and oversold conditions.
Smoothing : Applies additional smoothing to the Fisher Transform, reducing noise and providing clearer signals.
Signal Line : Includes a signal line to identify crossover points, indicating potential buy or sell signals.
Custom Alerts : Built-in alert conditions for bullish and bearish crossovers, keeping traders informed of significant market movements.
Visual Enhancements : Background color changes based on crossover conditions, offering immediate visual cues for potential trading opportunities.
How It Works
RSI Calculation : The indicator calculates the Relative Strength Index (RSI) based on the selected source and period length.
Normalization : The RSI values are normalized to fit within a range of -1 to 1, which is essential for the Fisher Transform.
Fisher Transform : The normalized RSI values undergo the Fisher Transform, converting them into a Gaussian normal distribution.
Smoothing : The transformed values are smoothed using a simple moving average to reduce noise and provide more reliable signals.
Signal Line : A signal line, which is a simple moving average of the smoothed Fisher Transform, is plotted to identify crossover points.
Alerts and Visuals : Custom alert conditions are set for bullish and bearish crossovers, and the background color changes to indicate these conditions.
Usage Instructions
Trend Identification : Use the Fisher Transform on RSI to identify overbought and oversold conditions with enhanced precision, aiding in spotting potential trend reversals.
Trade Signals : Monitor the crossovers between the smoothed Fisher Transform and the signal line. A bullish crossover suggests a potential buying opportunity, while a bearish crossover indicates a potential selling opportunity.
Alerts : Set custom alerts based on the built-in conditions to receive notifications when important crossover events occur, ensuring you never miss a trading opportunity.
Visual Cues : Utilize the background color changes to quickly identify bullish (green) and bearish (red) conditions, providing immediate visual feedback on market sentiment.
Complementary Analysis : Combine this indicator with other technical analysis tools and indicators to enhance your overall trading strategy and make more informed decisions.

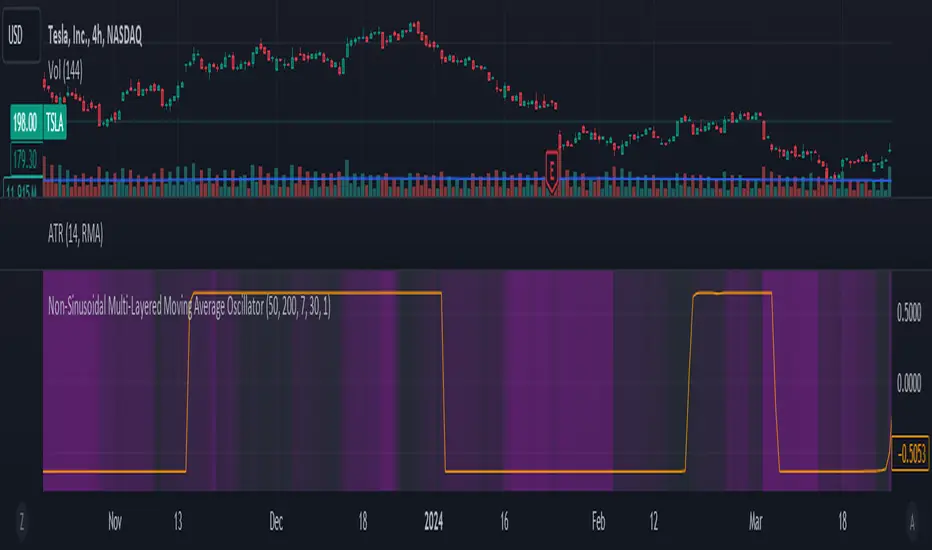
Non-Sinusoidal Multi-Layered Moving Average OscillatorThis indicator utilizes multiple moving averages (MAs) of different lengths their difference and its rate of change to provide a comprehensive view of both short-term and long-term market trends. The output signal is characterized by its non-sinusoidal nature, offering distinct advantages in trend analysis and market forecasting.
Combining the difference between two moving averages with the ROC allows to assess not only the direction and strength of the trend but also the momentum behind it. Transforming these signal in to non-sinusoidal output enhances its utility.
The indicator allows traders to select any one or more of seven moving average options. Larger timeframes (e.g., MA89/MA144) provide a broader identification of the overall trend, helping to understand the general market direction. Smaller timeframes (e.g., MA5/MA8) are more sensitive to price changes and can indicate better entry and exit points, aiding in the identification of retracements and pullbacks. By combining multiple timeframes, traders can get a comprehensive view of the market, enabling more precise and informed trading decisions.
Key Features:
Multiple Moving Averages:
The indicator calculates several exponential moving averages (EMAs) based on different lengths: MA5, MA8, MA13, MA21, MA34, MA55, MA89, and MA144.
These MAs are further smoothed using a secondary exponential moving average, with the smoothing length customizable by the user.
Percentage Differences:
The indicator computes the percentage differences between successive MAs (e.g., (MA5 - MA8) / MA8 * 100). These differences highlight the relative movement of prices over different periods, providing insights into market momentum and trend strength.
Short-term MA differences (e.g., MA5/MA8) are more sensitive to recent price changes, making them useful for detecting quick market movements.
Long-term MA differences (e.g., MA89/MA144) smooth out short-term fluctuations, helping to identify major trends.
Rate of Change (ROC):
The indicator applies the Rate of Change (ROC) to the percentage differences of the MAs. ROC measures the speed at which the percentage differences are changing over time, providing an additional layer of trend analysis.
ROC helps in understanding the acceleration or deceleration of market trends, indicating the strength and potential reversals.
Transformations:
The percentage differences undergo a series of mathematical transformations (either inverse hyperbolic sine transformation or inverse fisher transformation) to refine the signal and enhance its interpretability. These transformations include adjustments to stabilize the values and highlight significant movements.
checkbox allows users to select which mathematical transformations to use.
Non-Sinusoidal Nature:
The output signal of this indicator is non-sinusoidal, characterized by abrupt changes and distinct patterns rather than smooth, wave-like oscillations.
The non-sinusoidal signal provides clearer demarcations of trend changes and is more responsive to sudden market shifts.
This nature reduces the lag typically associated with sinusoidal indicators, allowing for more timely and accurate trading decisions.
Customizable Options:
Users can select which MA pairs to include in the analysis using checkboxes. This flexibility allows the indicator to adapt to different trading strategies, whether focused on short-term movements or long-term trends.
Visual Representation:
The indicator plots the transformed values on a separate panel, making it easy for traders to visualize the trends and potential entry or exit points.
Usage Scenarios:
Short-Term Trading: By focusing on shorter MAs (e.g., MA5/MA8), traders can capture quick market movements and identify short-term trends.
Long-Term Analysis: Utilizing longer MAs (e.g., MA89/MA144) helps in identifying major market trends.
Combination of MAs: The ability to mix different MA lengths provides a balanced view, helping traders make decisions based on both immediate price actions and overall market direction.
Practical Benefits:
Early Signal Detection: The sensitivity of short-term MAs provides early signals for potential trend changes, assisting traders in timely decision-making.
Trend Confirmation: Long-term MAs offer stable trend confirmation, reducing the likelihood of false signals in volatile markets.
Noise Reduction: The mathematical transformations and ROC applied to the percentage differences help in filtering out market noise, focusing on meaningful price movements.
Improved Responsiveness: The non-sinusoidal nature of the signal allows the indicator to react more quickly to market changes, providing more accurate and timely trading signals.
Clearer Trend Demarcations: Non-sinusoidal signals make it easier to identify distinct phases of market trends, aiding in better interpretation and decision-making.
Fisher Transform RevisitedFisher Transform developped by Ehlers is used mostly to detect peaks and troughs, which it does with little lag, but there are many false signals. Looking at its formula and construction, we can revisit it for the purpose of detecting trends and flat market.
How do we want to do that? There are 3 different actions:
Increase the default value from usual 9 or 10 to 30
Show the indicator as seen from upper time frame with synthetic rolling candles
Change the weights in first formula in order to saturate the input signal, push the trend data to the limits, so therefore leaving a good view when market is flat
As can be seen from the chart above, the revisited Fisher is above 2 for uptrend markets, below -2 for downtrending markets and in-between when the market is flat.
Notes
Weights for Fisher transform formula can be changed as parameters. Recommended valeus are 0.6 and 0.6 to saturate signal. You may come back to original formula by setting 0.33 and 0.66.
Parameter n allows view from upper time, a multiple of current time frame. n = 1 for current chart, n = 5 for 5 minutes view on the 1 min chart
Usage
Of course, it should be not be used in standalone mode. Indicator is for trend traders who can stay away when market is flat. Trend start when indicator goes above 2 but like all trade indicators, it will be late; it is therefore a good idea to change n back to 1 to get a timely entry, to be confirmed of course with other elements of technical analysis.
Fisher+ [OSC]The Fisher Transform Indicator is classified as an oscillator, meaning that its value swings above and below a central point. This characteristic allows traders to identify overbought and oversold conditions, providing potential clues about market reversals. As mentioned previously, it is an oscillator so the strength of the move is displayed by how long the fisher line stays above/below zero. Indicator can be used to aid in confluence near supply/demand zones.
White Line = Fisher
Red/Blue Line = Moving Average
--Changes color whether fisher line is above/below the MA
Red/Blue Shaded Line = Moving Average
--Changes color based on a smoothing factor
Red/Blue Shaded Fill = Asset in Overbought/Oversold Conditions
Red/Blue Circles = Asset in Extreme Overbought/Oversold Conditions
Red/Blue Triangles = MACD Signals Below/Above "0"
Divergence Labels = Asset Signaling Divergence
The moving average line will turn red/blue as long as the fisher line is below/above the moving average. The shaded MA line will switch colors based on if it is moving in an up/down trend. The MA can also be used as a signal and treated similar to an oscillator. Market trending conditions will either keep the MA below/above the dashed zero line.
MACD code credited to LazyBear's MACD Leader indicator. It is used to filter out/confirm any signals such as divergences. As long as the MACD Leader line is above both the MACD line and signal lines then it'll signal with with a triangle. MACD divergences will be added at a later time.

Gaussian Fisher Transform Price Reversals - FTRHello Traders !
Looking for better trading results ?
"This indicator shows you how to identify price reversals in a timely manner." John F. Ehlers
Introduction :
The Gaussian Fisher Transform Price Reversals indicator, dubbed FTR for short, is a stat based price reversal detection indicator inspired by and based on the work of the electrical engineer now private trader John F. Ehlers.
The Fisher Transform :
It is a common assumption that prices have a gaussian / normal probability density function(PDF), i.e. a sample of n close prices would be normally distributed if the probability of observing a price value say at any given standard deviation range is equal to that probability in the case of the normal distribution, e.g. 68% off all samples fell within one standard deviation around the mean, which is what we would expect if the data was normal.
However Price Action is not normally distributed and thus can not be conventionally interpreted in this way, Formally the Fisher Transform, transforms the distribution of bounded ranging price action (were price action takes values in a range from -1 to 1) into that of a normal distribution, alternatively it may be said the Fisher Transform changes the PDF of any waveform so that the transformed output has n approximately Gaussian PDF, It does so through the following equations. taken directly from the work of John F. Ehlers - Using The Fisher Transform
By substituting price data in the above formulas, bounded ranging price actions (over a given user defined period lookback - this determines the range price ranges in, see the Intermediate formula above) distribution is transformed to that in the normal case. This means when the input, the Intermediate ,(the Midpoint - see formula above) approaches either limit within the range the outputs are greatly amplified, this amplification accentuates /puts more weight on the larger deviations or limits within the range, conversely when price action is varying round the mean of the range the output is approximately equal to unity (the input is approximately equal to the input, the intermediate)
The inputs (Intermediates) are converted to normal outputs and the nonlinear Transfer of the Fisher Transform with varying senesitivity's (gammas) can be seen in the graph / image above. Although sensitivity adjustments are not currently available in this script (I forgot to add it) the outputs may be greatly amplified as gamma (the coefficient of the Fisher Transformation - see Fish equation) approaches 1. the purple line show this graphically, as a higher gamma leads to a greater amplification than in the standard case (the red line which is the standard fisher transformation, the black plot is the Fish with a gamma of 1, which is unity sensativity)
Reversal plots and Breakouts :
- Support lines are plotted with their corresponding Fish value when there is a crossover of the Fish and Fish SMA <= a given standard deviation of Fish
- Resistance lines are plotted with their corresponding Fish value when there is a crossunder of the Fish and Fish SMA >= a given standard deviation of Fish
- Reversals are these support and resistance line plots
Breakouts and Volume bars :
Breakouts cause the reversal lines to break (when the high/low is above the resistance/support), Breakouts are more "high quality" when they occur conditional on high volume, the highlighted bars represent volume standard deviations ranging from -3 to 3. When breakouts occure on high volume this may be a sign of the continutaion of the trend (reversals would signify the start of a new trend).
Hope you enjoy, Happy Trading !
(be sure to rocket the script if you liked it, this helps me know which of my scripts are the most useful)

FTR, WMA, OBV & RSI StrategyThis Pine Script code is a trading strategy that uses several indicators such as Fisher Transform (FTR), On-Balance Volume (OBV), Relative Strength Index (RSI), and a Weighted Moving Average (WMA). The strategy generates buy and sell signals based on the conditions of these indicators.
The Fisher Transform function is a technical indicator that uses past prices to determine whether the current market is bullish or bearish. The Fisher Transform function takes in four multipliers and a length parameter. The four multipliers are used to calculate four Fisher Transform values, and these values are used in combination to determine if the market is bullish or bearish.
The Weighted Moving Average (WMA) is a technical indicator that smooths out the price data by giving more weight to the most recent prices.
The Relative Strength Index (RSI) is a momentum indicator that measures the strength of a security's price action. The RSI ranges from 0 to 100 and is typically used to identify overbought or oversold conditions in the market.
The On-Balance Volume (OBV) is a technical indicator that uses volume to predict changes in the stock price. OBV values are calculated by adding volume on up days and subtracting volume on down days.
The strategy uses the Fisher Transform values to generate buy and sell signals when all four Fisher Transform values change color. It also uses the WMA to determine if the trend is bullish or bearish, the OBV to confirm the trend, and the RSI to filter out false signals.
The red and green triangular arrows attempt to indicate that the trend is bullish or bearish and should not be traded against in the opposite direction. This helps with my FOMO :)
All comments welcome!
The script should not be relied upon alone, there are no stop loss or take profit filters. The best results have been back-tested using Tradingview on the 45m - 3 hour timeframes.

Limited Fisher Transformwhat is Limited Fisher Transform?
This indicator is a compressed version of the Fisher transform indicator between 100 and 0 values.
what it does?
It allows us to define overbought and oversold zones by compressing the values of the "fisher transform" indicator between 0 and 100. also these zones are the same for every timeframe and trading pair, just like RSI.
how it does it?
it use this formula:
x = fisher transform values
a = average
how to use it?
its use is indistinguishable from the standard fisher. You can use it to set alarms for overbought and oversold zones. so you will be notified when a possible opportunity arises in the market.
Open Interest StochasticStochastic Money Flow Index(MFI) using open interest instead of volume.
Open Interest data for Binance, Bitmex, and Kraken

FDI-Adaptive Fisher Transform [Loxx]FDI-Adaptive Fisher Transform is a Fractal Dimension Adaptive Fisher Transform indicator.
What is the Fractal Dimension Index?
The goal of the fractal dimension index is to determine whether the market is trending or in a trading range. It does not measure the direction of the trend. A value less than 1.5 indicates that the price series is persistent or that the market is trending. Lower values of the FDI indicate a stronger trend. A value greater than 1.5 indicates that the market is in a trading range and is acting in a more random fashion.
What is Fisher Transform?
The Fisher Transform is a technical indicator created by John F. Ehlers that converts prices into a Gaussian normal distribution.
The indicator highlights when prices have moved to an extreme, based on recent prices. This may help in spotting turning points in the price of an asset. It also helps show the trend and isolate the price waves within a trend.
Included:
Zero-line and signal cross options for bar coloring
Customizable overbought/oversold thresh-holds
Alerts
Signals
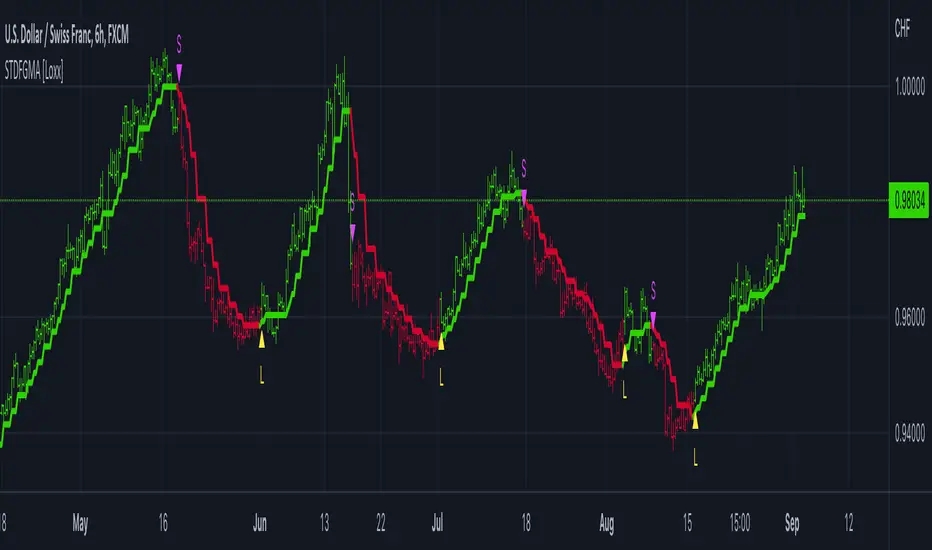
STD-Filtered, N-Pole Gaussian Filter [Loxx]This is a Gaussian Filter with Standard Deviation Filtering that works for orders (poles) higher than the usual 4 poles that was originally available in Ehlers Gaussian Filter formulas. Because of that, it is a sort of generalized Gaussian filter that can calculate arbitrary (order) pole Gaussian Filter and which makes it a sort of a unique indicator. For this implementation, the practical mathematical maximum is 15 poles after which the precision of calculation is useless--the coefficients for levels above 15 poles are so high that the precision loss actually means very little. Despite this maximal precision utility, I've left the upper bound of poles open-ended so you can try poles of order 15 and above yourself. The default is set to 5 poles which is 1 pole greater than the normal maximum of 4 poles.
The purpose of the standard deviation filter is to filter out noise by and by default it will filter 1 standard deviation. Adjust this number and the filter selections (price, both, GMA, none) to reduce the signal noise.
What is Ehlers Gaussian filter?
This filter can be used for smoothing. It rejects high frequencies (fast movements) better than an EMA and has lower lag. published by John F. Ehlers in "Rocket Science For Traders".
A Gaussian filter is one whose transfer response is described by the familiar Gaussian bell-shaped curve. In the case of low-pass filters, only the upper half of the curve describes the filter. The use of gaussian filters is a move toward achieving the dual goal of reducing lag and reducing the lag of high-frequency components relative to the lag of lower-frequency components.
A gaussian filter with...
One Pole: f = alpha*g + (1-alpha)f
Two Poles: f = alpha*2g + 2(1-alpha)f - (1-alpha)2f
Three Poles: f = alpha*3g + 3(1-alpha)f - 3(1-alpha)2f + (1-alpha)3f
Four Poles: f = alpha*4g + 4(1-alpha)f - 6(1-alpha)2f + 4(1-alpha)3f - (1-alpha)4f
and so on...
For an equivalent number of poles the lag of a Gaussian is about half the lag of a Butterworth filters: Lag = N*P / pi^2, where,
N is the number of poles, and
P is the critical period
Special initialization of filter stages ensures proper working in scans with as few bars as possible.
From Ehlers Book: "The first objective of using smoothers is to eliminate or reduce the undesired high-frequency components in the eprice data. Therefore these smoothers are called low-pass filters, and they all work by some form of averaging. Butterworth low-pass filters can do this job, but nothing comes for free. A higher degree of filtering is necessarily accompanied by a larger amount of lag. We have come to see that is a fact of life."
References John F. Ehlers: "Rocket Science For Traders, Digital Signal Processing Applications", Chapter 15: "Infinite Impulse Response Filters"
Included
Loxx's Expanded Source Types
Signals
Alerts
Bar coloring
Related indicators
STD-Filtered, Gaussian Moving Average (GMA)
STD-Filtered, Gaussian-Kernel-Weighted Moving Average
One-Sided Gaussian Filter w/ Channels
Fisher Transform w/ Dynamic Zones
R-sqrd Adapt. Fisher Transform w/ D. Zones & Divs .

Gaussian Filter MACD [Loxx]Gaussian Filter MACD is a MACD that uses an 1-4 Pole Ehlers Gaussian Filter for its calculations. Compare this with Ehlers Fisher Transform.
What is Ehlers Gaussian filter?
This filter can be used for smoothing. It rejects high frequencies (fast movements) better than an EMA and has lower lag. published by John F. Ehlers in "Rocket Science For Traders". First implemented in Wealth-Lab by Dr René Koch.
A Gaussian filter is one whose transfer response is described by the familiar Gaussian bell-shaped curve. In the case of low-pass filters, only the upper half of the curve describes the filter. The use of gaussian filters is a move toward achieving the dual goal of reducing lag and reducing the lag of high-frequency components relative to the lag of lower-frequency components.
A gaussian filter with...
one pole is equivalent to an EMA filter.
two poles is equivalent to EMA ( EMA ())
three poles is equivalent to EMA ( EMA ( EMA ()))
and so on...
For an equivalent number of poles the lag of a Gaussian is about half the lag of a Butterworth filters: Lag = N * P / (2 * ¶2), where,
N is the number of poles, and
P is the critical period
Special initialization of filter stages ensures proper working in scans with as few bars as possible.
From Ehlers Book: "The first objective of using smoothers is to eliminate or reduce the undesired high-frequency components in the eprice data. Therefore these smoothers are called low-pass filters, and they all work by some form of averaging. Butterworth low-pass filtters can do this job, but nothing comes for free. A higher degree of filtering is necessarily accompanied by a larger amount of lag. We have come to see that is a fact of life."
References John F. Ehlers: "Rocket Science For Traders, Digital Signal Processing Applications", Chapter 15: "Infinite Impulse Response Filters"
Included
Loxx's Expanded Source Types
Signals, zero or signal crossing, signal crossing is very noisy
Alerts
Bar coloring
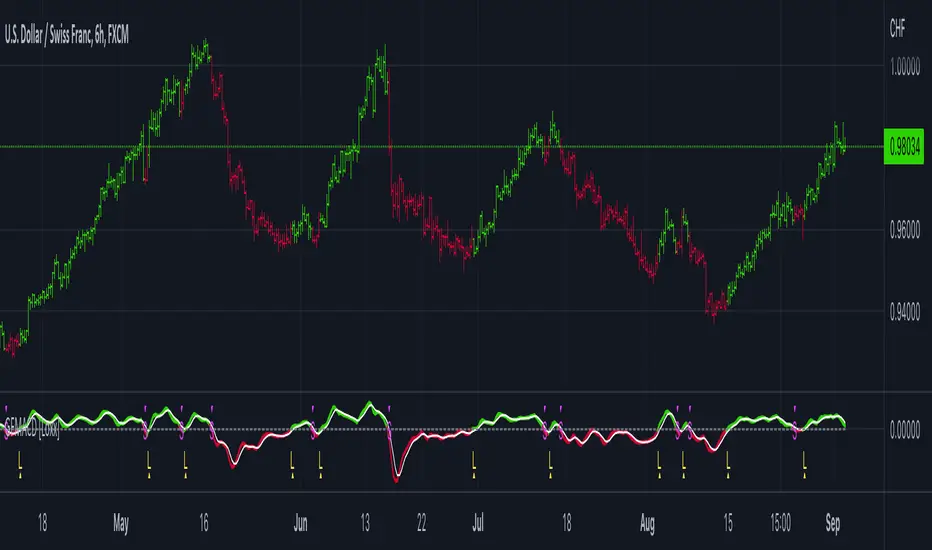
STD-Filtered, Gaussian Moving Average (GMA) [Loxx]STD-Filtered, Gaussian Moving Average (GMA) is a 1-4 pole Ehlers Gaussian Filter with standard deviation filtering. This indicator should perform similar to Ehlers Fisher Transform.
The purpose of the standard deviation filter is to filter out noise by and by default it will filter 1 standard deviation. Adjust this number and the filter selections (price, both, GMA, none) to reduce the signal noise.
What is Ehlers Gaussian filter?
This filter can be used for smoothing. It rejects high frequencies (fast movements) better than an EMA and has lower lag. published by John F. Ehlers in "Rocket Science For Traders". First implemented in Wealth-Lab by Dr René Koch.
A Gaussian filter is one whose transfer response is described by the familiar Gaussian bell-shaped curve. In the case of low-pass filters, only the upper half of the curve describes the filter. The use of gaussian filters is a move toward achieving the dual goal of reducing lag and reducing the lag of high-frequency components relative to the lag of lower-frequency components.
A gaussian filter with...
one pole is equivalent to an EMA filter.
two poles is equivalent to EMA(EMA())
three poles is equivalent to EMA(EMA(EMA()))
and so on...
For an equivalent number of poles the lag of a Gaussian is about half the lag of a Butterworth filters: Lag = N * P / (2 * ¶2), where,
N is the number of poles, and
P is the critical period
Special initialization of filter stages ensures proper working in scans with as few bars as possible.
From Ehlers Book: "The first objective of using smoothers is to eliminate or reduce the undesired high-frequency components in the eprice data. Therefore these smoothers are called low-pass filters, and they all work by some form of averaging. Butterworth low-pass filtters can do this job, but nothing comes for free. A higher degree of filtering is necessarily accompanied by a larger amount of lag. We have come to see that is a fact of life."
References John F. Ehlers: "Rocket Science For Traders, Digital Signal Processing Applications", Chapter 15: "Infinite Impulse Response Filters"
Included
Loxx's Expanded Source Types
Signals
Alerts
Bar coloring
Related indicators
STD-Filtered, Gaussian-Kernel-Weighted Moving Average
One-Sided Gaussian Filter w/ Channels
Fisher Transform w/ Dynamic Zones
R-sqrd Adapt. Fisher Transform w/ D. Zones & Divs.
TheATR: Fisher Oscillator.Fisher Oscillator(FO).
The Fisher Oscillator is inspired by John Ehlers "Fisher Transform".
The oscillator highlights when prices have moved to an extreme, based on recent prices.
The FO may help in spotting turning points, in the short-medium trends of an asset, also, it helps in recognizing the asset's trends themselves, giving a picture of mkt conditions affected by less noise.
Fisher Oscillator Components.
Fisher V1 -> Main FO.
Fisher V2 -> Past Candle FO.
0-line threshold -> Directional Component.
How to read the Fisher Oscillator.
The FO is super easy to read by itself.. also, I coded some features which make it even easier to read.
It's suggestions, which we can call "Signals", come from 2 different sources, accessible thanks to the variable "Signals Type".
- 0-Line Crosses:
When the "Fisher V1" upcrosses the oscillator 0-line, the oscillator suggests a Long scenario.
When the "Fisher V1" downcrosses the oscillator 0-line, the oscillator suggests a Short scenario.
- Classic Lines Crosses:
When the "Fisher V1" upcrosses the "Fisher V2", the oscillator suggests a Long scenario.
When the "Fisher V1" downcrosses the "Fisher V2", the oscillator suggests a Short scenario.
Users will be able to recognise these Signals visually, thanks to some color customisation to the "Fisher V1" line, and thanks to the ability of the oscillator of plotting Signals.
TheATR Documentation regarding TheATR: Fisher Oscillator.
Researching and backtesting the FO, I noticed it's skill of being able to dynamically identify trend reversals with a nice degree of reliability.
Also, the FO's able to keep up with trends up to their tops/bottoms, as it's very responsive.
This makes the FO a trend-following oscillator in my personal view, because its nature of being very fast in detecting reversals will lead to many false reversals as well.
On the other face of this coin, if we look at the FO as a source for confirmations for a trend-following strategy, may be very useful.
To conclude, I would use the FO as a confirmation oscillator, in a trend-following strategy that needs to have other components.
Thanks for reading,
TheATR.

Non-Lag Inverse Fisher Transform of RSX [Loxx]Non-Lag Inverse Fisher Transform of RSX is an Inverse Fisher Transform on the Non-Lagged Smoothing Filter of Jurik RSX.
What is the Inverse Fisher Transform?
The Inverse Fisher Transform was authored by John Ehlers. The IFT applies some math functions and constants to a moving average of the relative strength index (rsi) of the closing price to calculate its oscillator position. T
read more here: www.mesasoftware.com
What is RSX?
RSI is a very popular technical indicator, because it takes into consideration market speed, direction and trend uniformity. However, the its widely criticized drawback is its noisy (jittery) appearance. The Jurk RSX retains all the useful features of RSI , but with one important exception: the noise is gone with no added lag.
What is the Non-lag moving average?
The Non Lag Moving average follows price closely and gives very quick signals as well as early signals of price change. As a standalone Moving Average, it should not be used on its own, but as an additional confluence tool for early signals.
Included:
Alerts
Signals
Bar coloring
One-Sided Gaussian Support & Resistance Rate [Loxx]One-Sided Gaussian Support & Resistance Rate is a mean reversion oscillator much like Fisher Transform. This indicator is built using a one-sided Gaussian filter. If you pair this with Fisher Transform and line up the settings, you'll notice similar outcomes. You'll notice that as the oscillator levels out at around zero or one that this signifies a zone of resistance or support. See here for more details on calculating the OS Gaussian Filter:
Included:
Bar coloring
Signals
Alerts
Ehlers 2-Pole Super Smoothing for smoothing source inputs

R-sqrd Adapt. Fisher Transform w/ D. Zones & Divs. [Loxx]The full name of this indicator is R-Squared Adaptive Fisher Transform w/ Dynamic Zones and Divergences. This is an R-squared adaptive Fisher transform with adjustable dynamic zones, signals, alerts, and divergences.
What is Fisher Transform?
The Fisher Transform is a technical indicator created by John F. Ehlers that converts prices into a Gaussian normal distribution.
The indicator highlights when prices have moved to an extreme, based on recent prices. This may help in spotting turning points in the price of an asset. It also helps show the trend and isolate the price waves within a trend.
What is R-squared Adaptive?
One tool available in forecasting the trendiness of the breakout is the coefficient of determination ( R-squared ), a statistical measurement.
The R-squared indicates linear strength between the security's price (the Y - axis) and time (the X - axis). The R-squared is the percentage of squared error that the linear regression can eliminate if it were used as the predictor instead of the mean value. If the R-squared were 0.99, then the linear regression would eliminate 99% of the error for prediction versus predicting closing prices using a simple moving average .
R-squared is used here to derive an r-squared value that is then modified by a user input "factor"
What are Dynamic Zones?
As explained in "Stocks & Commodities V15:7 (306-310): Dynamic Zones by Leo Zamansky, Ph .D., and David Stendahl"
Most indicators use a fixed zone for buy and sell signals. Here’ s a concept based on zones that are responsive to past levels of the indicator.
One approach to active investing employs the use of oscillators to exploit tradable market trends. This investing style follows a very simple form of logic: Enter the market only when an oscillator has moved far above or below traditional trading lev- els. However, these oscillator- driven systems lack the ability to evolve with the market because they use fixed buy and sell zones. Traders typically use one set of buy and sell zones for a bull market and substantially different zones for a bear market. And therein lies the problem.
Once traders begin introducing their market opinions into trading equations, by changing the zones, they negate the system’s mechanical nature. The objective is to have a system automatically define its own buy and sell zones and thereby profitably trade in any market — bull or bear. Dynamic zones offer a solution to the problem of fixed buy and sell zones for any oscillator-driven system.
An indicator’s extreme levels can be quantified using statistical methods. These extreme levels are calculated for a certain period and serve as the buy and sell zones for a trading system. The repetition of this statistical process for every value of the indicator creates values that become the dynamic zones. The zones are calculated in such a way that the probability of the indicator value rising above, or falling below, the dynamic zones is equal to a given probability input set by the trader.
To better understand dynamic zones, let's first describe them mathematically and then explain their use. The dynamic zones definition:
Find V such that:
For dynamic zone buy: P{X <= V}=P1
For dynamic zone sell: P{X >= V}=P2
where P1 and P2 are the probabilities set by the trader, X is the value of the indicator for the selected period and V represents the value of the dynamic zone.
The probability input P1 and P2 can be adjusted by the trader to encompass as much or as little data as the trader would like. The smaller the probability, the fewer data values above and below the dynamic zones. This translates into a wider range between the buy and sell zones. If a 10% probability is used for P1 and P2, only those data values that make up the top 10% and bottom 10% for an indicator are used in the construction of the zones. Of the values, 80% will fall between the two extreme levels. Because dynamic zone levels are penetrated so infrequently, when this happens, traders know that the market has truly moved into overbought or oversold territory.
Calculating the Dynamic Zones
The algorithm for the dynamic zones is a series of steps. First, decide the value of the lookback period t. Next, decide the value of the probability Pbuy for buy zone and value of the probability Psell for the sell zone.
For i=1, to the last lookback period, build the distribution f(x) of the price during the lookback period i. Then find the value Vi1 such that the probability of the price less than or equal to Vi1 during the lookback period i is equal to Pbuy. Find the value Vi2 such that the probability of the price greater or equal to Vi2 during the lookback period i is equal to Psell. The sequence of Vi1 for all periods gives the buy zone. The sequence of Vi2 for all periods gives the sell zone.
In the algorithm description, we have: Build the distribution f(x) of the price during the lookback period i. The distribution here is empirical namely, how many times a given value of x appeared during the lookback period. The problem is to find such x that the probability of a price being greater or equal to x will be equal to a probability selected by the user. Probability is the area under the distribution curve. The task is to find such value of x that the area under the distribution curve to the right of x will be equal to the probability selected by the user. That x is the dynamic zone.
Included:
Bar coloring
4 signal variations w/ alerts
Divergences w/ alerts
Loxx's Expanded Source Types

Fisher Transform of MACD w/ Quantile Bands [Loxx]Fisher Transform of MACD w/ Quantile Bands is a Fisher Transform indicator with Quantile Bands that takes as it's source a MACD. The MACD has two different source inputs for fast and slow moving averages.
What is Fisher Transform?
The Fisher Transform is a technical indicator created by John F. Ehlers that converts prices into a Gaussian normal distribution.
The indicator highlights when prices have moved to an extreme, based on recent prices. This may help in spotting turning points in the price of an asset. It also helps show the trend and isolate the price waves within a trend.
What is Quantile Bands?
In statistics and the theory of probability, quantiles are cutpoints dividing the range of a probability distribution into contiguous intervals with equal probabilities, or dividing the observations in a sample in the same way. There is one less quantile than the number of groups created. Thus quartiles are the three cut points that will divide a dataset into four equal-size groups (cf. depicted example). Common quantiles have special names: for instance quartile, decile (creating 10 groups: see below for more). The groups created are termed halves, thirds, quarters, etc., though sometimes the terms for the quantile are used for the groups created, rather than for the cut points.
q-Quantiles are values that partition a finite set of values into q subsets of (nearly) equal sizes. There are q − 1 of the q-quantiles, one for each integer k satisfying 0 < k < q. In some cases the value of a quantile may not be uniquely determined, as can be the case for the median (2-quantile) of a uniform probability distribution on a set of even size. Quantiles can also be applied to continuous distributions, providing a way to generalize rank statistics to continuous variables. When the cumulative distribution function of a random variable is known, the q-quantiles are the application of the quantile function (the inverse function of the cumulative distribution function) to the values {1/q, 2/q, …, (q − 1)/q}.
What is MACD?
Moving average convergence divergence ( MACD ) is a trend-following momentum indicator that shows the relationship between two moving averages of a security’s price. The MACD is calculated by subtracting the 26-period exponential moving average ( EMA ) from the 12-period EMA .
Included:
Zero-line and signal cross options for bar coloring, signals, and alerts
Alerts
Signals
Loxx's Expanded Source Types
35+ moving average types

Fisher Transform w/ Dynamic Zones [Loxx]What is Fisher Transform?
The Fisher Transform is a technical indicator created by John F. Ehlers that converts prices into a Gaussian normal distribution.
The indicator highlights when prices have moved to an extreme, based on recent prices. This may help in spotting turning points in the price of an asset. It also helps show the trend and isolate the price waves within a trend.
What are Dynamic Zones?
As explained in "Stocks & Commodities V15:7 (306-310): Dynamic Zones by Leo Zamansky, Ph .D., and David Stendahl"
Most indicators use a fixed zone for buy and sell signals. Here’ s a concept based on zones that are responsive to past levels of the indicator.
One approach to active investing employs the use of oscillators to exploit tradable market trends. This investing style follows a very simple form of logic: Enter the market only when an oscillator has moved far above or below traditional trading lev- els. However, these oscillator- driven systems lack the ability to evolve with the market because they use fixed buy and sell zones. Traders typically use one set of buy and sell zones for a bull market and substantially different zones for a bear market. And therein lies the problem.
Once traders begin introducing their market opinions into trading equations, by changing the zones, they negate the system’s mechanical nature. The objective is to have a system automatically define its own buy and sell zones and thereby profitably trade in any market — bull or bear. Dynamic zones offer a solution to the problem of fixed buy and sell zones for any oscillator-driven system.
An indicator’s extreme levels can be quantified using statistical methods. These extreme levels are calculated for a certain period and serve as the buy and sell zones for a trading system. The repetition of this statistical process for every value of the indicator creates values that become the dynamic zones. The zones are calculated in such a way that the probability of the indicator value rising above, or falling below, the dynamic zones is equal to a given probability input set by the trader.
To better understand dynamic zones, let's first describe them mathematically and then explain their use. The dynamic zones definition:
Find V such that:
For dynamic zone buy: P{X <= V}=P1
For dynamic zone sell: P{X >= V}=P2
where P1 and P2 are the probabilities set by the trader, X is the value of the indicator for the selected period and V represents the value of the dynamic zone.
The probability input P1 and P2 can be adjusted by the trader to encompass as much or as little data as the trader would like. The smaller the probability, the fewer data values above and below the dynamic zones. This translates into a wider range between the buy and sell zones. If a 10% probability is used for P1 and P2, only those data values that make up the top 10% and bottom 10% for an indicator are used in the construction of the zones. Of the values, 80% will fall between the two extreme levels. Because dynamic zone levels are penetrated so infrequently, when this happens, traders know that the market has truly moved into overbought or oversold territory.
Calculating the Dynamic Zones
The algorithm for the dynamic zones is a series of steps. First, decide the value of the lookback period t. Next, decide the value of the probability Pbuy for buy zone and value of the probability Psell for the sell zone.
For i=1, to the last lookback period, build the distribution f(x) of the price during the lookback period i. Then find the value Vi1 such that the probability of the price less than or equal to Vi1 during the lookback period i is equal to Pbuy. Find the value Vi2 such that the probability of the price greater or equal to Vi2 during the lookback period i is equal to Psell. The sequence of Vi1 for all periods gives the buy zone. The sequence of Vi2 for all periods gives the sell zone.
In the algorithm description, we have: Build the distribution f(x) of the price during the lookback period i. The distribution here is empirical namely, how many times a given value of x appeared during the lookback period. The problem is to find such x that the probability of a price being greater or equal to x will be equal to a probability selected by the user. Probability is the area under the distribution curve. The task is to find such value of x that the area under the distribution curve to the right of x will be equal to the probability selected by the user. That x is the dynamic zone.
Included
3 signal types
Bar coloring
Alerts
Channels fill
Loxx's Expanded Source Types
