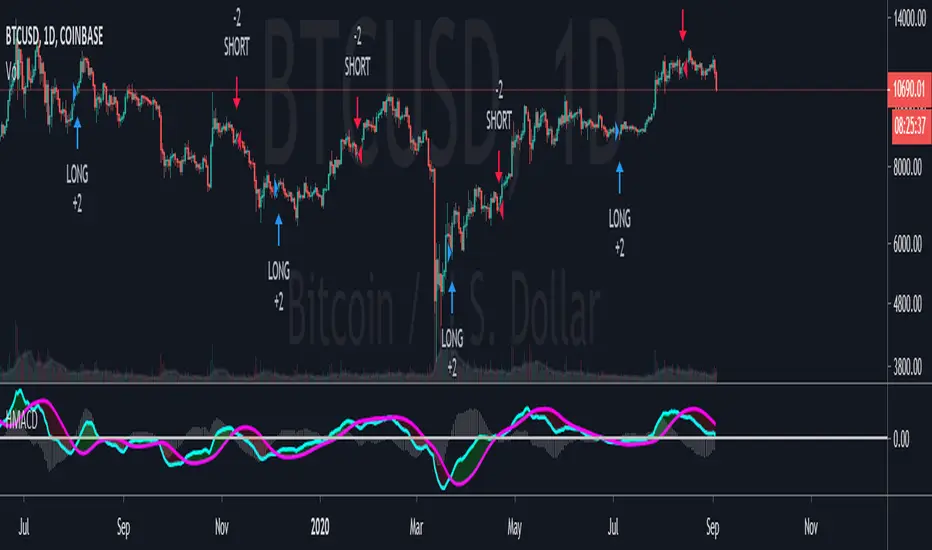
HULL MACDA modified version of MACD.
Uses Hull moving average for the signal line instead of your typical EMA.
Can be used as a crossover strategy with decent win rate.
Alternatively, can also be used for histogram divergences.
Try it out! :)
Hull Moving Average (HMA)
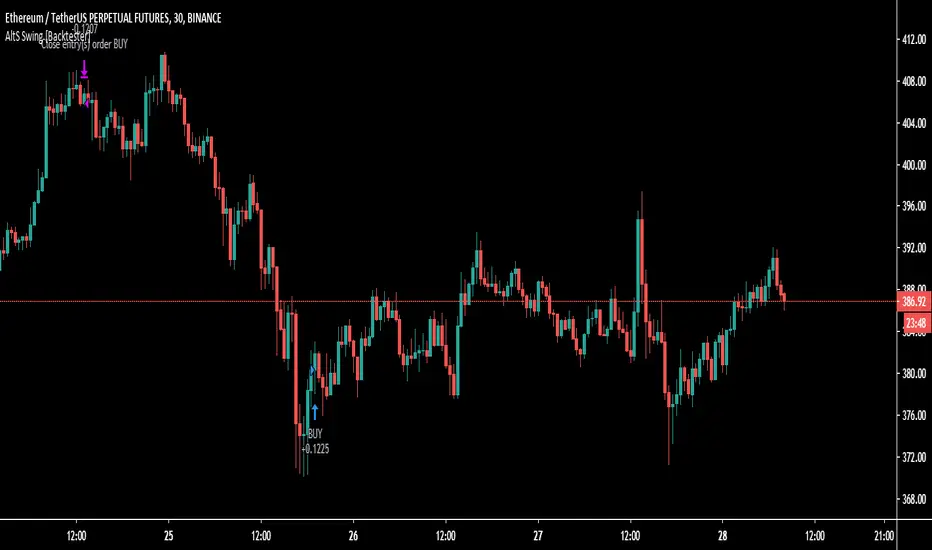
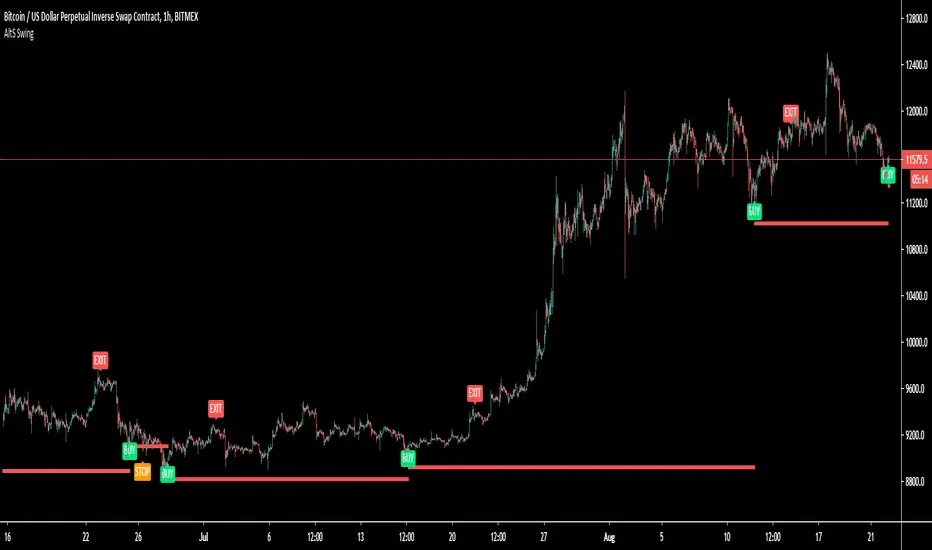
AltS Swing [Backtester]
PLEASE READ THIS DESCRIPTION TO SAVE TIME AND UNDERSTAND WHAT THIS INDICATOR DOES
This is the backtesting version for this script
In this back tested version I have shown it to be used on regular candles with realistic calculations in regards to positions sizes, slippage, fees and more
Kind Regards
This is a official version of AltSignals Long/Short Reverse Indicator
Description:
This indicator uses various indicators in combination with each other, some of the key ones to mention is Hulls, EMA , MA. Along with that it uses EMA crossovers to get the precise entries and exits.
The recommended time frames with this indictor are shorter ones, for example 5m,10m,15m work well, along with that I have found that some of the more unique time frames also work well such as 20m,45m,2hr and so on.
This indicator is not super advanced but it's still very powerful, with only 130 lines of code.
This indicator works on every chart, time, and candle type but you must play with the settings to find what is best, the same setting will not work on every pair etc.
With AltSignals Swing Indicator it trades one way, that means it gives 3 pieces of information. BUY/TakeProfit/StopLoss.
Unlike most indicators which Buy and Sell both ways this one focuses on one direction of trading so please take into account when using this.
I have added in a reverse strategy which basically shows the opposite values of of the buy, so if you select the box in the settings and un-tick it, then it will show opposite directions so sells only.
This feature is very useful especially in general bear markets when buying is difficult.
I have also added in the option for no stop losses to be used, if you set the stop loss value = 100 then it will show no stop losses.
I suggest a stop loss somewhere in the region of 1-2-3%, please note that you can use decimal stop losses too so for example 0.1 or 0.5.
This indicator is NOT a once size fits all, every chart is different, time frame and candles also, so i would suggest spending some time going through and playing with the channel length settings, which will change the EMA numbers.
Using this along with the back script to find the ideal settings is the best way to use this script, once you have done that make sure to save those values somewhere.
Its important to remember that the Regular script and the back testing script values should be the same for them to match up on the chart, so the channel lengths, stop losses and so on values should be the same.
Side note
This is not financial advice.
We will continue making updates as time goes on.
If you would like to try this script for free please visit our website or message us on Tradingview live chat.

AltS Swing (INV)
PLEASE READ THIS DESCRIPTION TO SAVE TIME AND UNDERSTAND WHAT THIS INDICATOR DOES
This is a official version of AltSignals Long/Short Reverse Indicator
Description:
This indicator uses various indicators in combination with each other, some of the key ones to mention is Hulls, EMA , MA. Along with that it uses EMA crossovers to get the precise entries and exits.
The recommended time frames with this indictor are shorter ones, for example 5m,10m,15m work well, along with that I have found that some of the more unique time frames also work well such as 20m,45m,2hr and so on.
This indicator is not super advanced but it's still very powerful, with only 130 lines of code.
This indicator works on every chart, time, and candle type but you must play with the settings to find what is best, the same setting will not work on every pair etc.
With AltSignals Swing Indicator it trades one way, that means it gives 3 pieces of information. BUY/TakeProfit/StopLoss.
Unlike most indicators which Buy and Sell both ways this one focuses on one direction of trading so please take into account when using this.
I have added in a reverse strategy which basically shows the opposite values of of the buy, so if you select the box in the settings and un-tick it, then it will show opposite directions so sells only.
This feature is very useful especially in general bear markets when buying is difficult.
I have also added in the option for no stop losses to be used, if you set the stop loss value = 100 then it will show no stop losses.
I suggest a stop loss somewhere in the region of 1-2-3%, please note that you can use decimal stop losses too so for example 0.1 or 0.5.
This indicator is NOT a once size fits all, every chart is different, time frame and candles also, so i would suggest spending some time going through and playing with the channel length settings, which will change the EMA numbers.
Using this along with the back script to find the ideal settings is the best way to use this script, once you have done that make sure to save those values somewhere.
Its important to remember that the Regular script and the back testing script values should be the same for them to match up on the chart, so the channel lengths, stop losses and so on values should be the same.
Side note
This is not financial advice.
We will continue making updates as time goes on.
If you would like to try this script for free please visit our website or message us on Tradingview live chat.
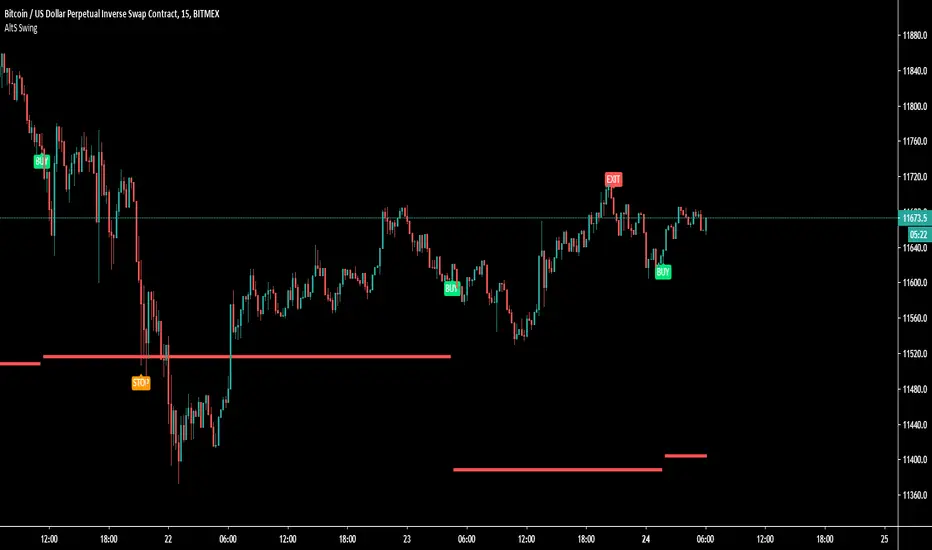
AltS Swing
PLEASE READ THIS DESCRIPTION TO SAVE TIME AND UNDERSTAND WHAT THIS INDICATOR DOES
This is a official version of AltSignals Long/Short Reverse Indicator
Description:
This indicator uses various indicators in combination with each other, some of the key ones to mention is Hulls, EMA, MA. Along with that it uses EMA crossovers to get the precise entries and exits.
The recommended time frames with this indictor are shorter ones, for example 5m,10m,15m work well, along with that I have found that some of the more unique time frames also work well such as 20m,45m,2hr and so on.
This indicator is not super advanced but it's still very powerful, with only 130 lines of code.
With AltSignals Swing Indicator it trades one way, that means it gives 3 pieces of information. BUY/TakeProfit/StopLoss.
Unlike most indicators which Buy and Sell both ways this one focuses on one direction of trading so please take into account when using this.
I have added in a reverse strategy which basically shows the opposite values of of the buy, so if you select the box in the settings and un-tick it, then it will show opposite directions so sells only.
This feature is very useful especially in general bear markets when buying is difficult.
I have also added in the option for no stop losses to be used, if you set the stop loss value = 100 then it will show no stop losses.
I suggest a stop loss somewhere in the region of 1-2-3%, please note that you can use decimal stop losses too so for example 0.1 or 0.5.
This indicator is NOT a once size fits all, every chart is different, time frame and candles also, so i would suggest spending some time going through and playing with the channel length settings, which will change the EMA numbers.
Using this along with the back script to find the ideal settings is the best way to use this script, once you have done that make sure to save those values somewhere.
Its important to remember that the Regular script and the back testing script values should be the same for them to match up on the chart, so the channel lengths, stop losses and so on values should be the same.
Side note
This is not financial advice.
We will continue making updates as time goes on.
If you would like to try this script for free please visit our website or message us on Tradingview live chat.
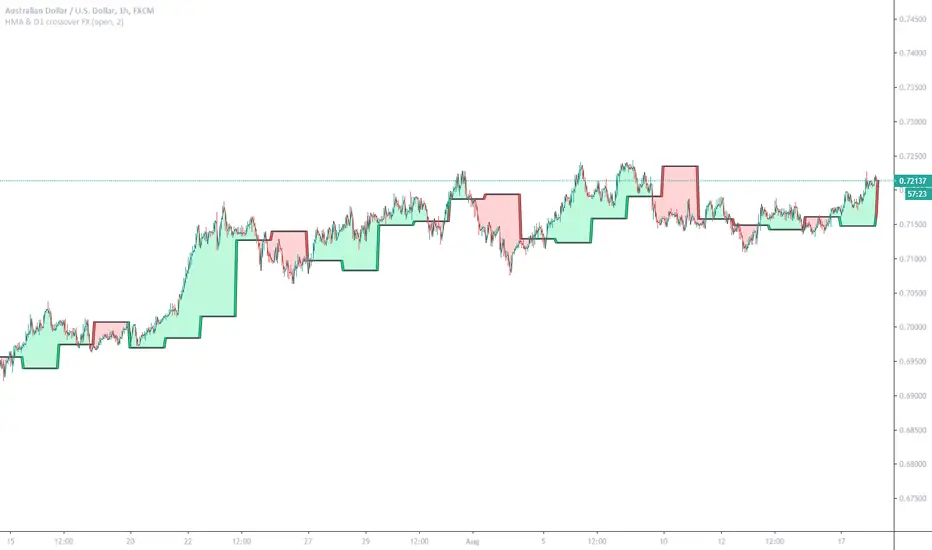
HMA & D1 crossover FX (Study)Can work on other Forex pairs if change settings: Period
This example tuned for AUDUSD (FX Version)
Enter new order on HMA ( Hull Moving Average ) and D1 ( Daily Candle) crossovers, Exit orders as basket when profit = Your Target Profit
This study version built for users of Alerts. Crossover of HMA and DailyCandle1 (and/or DailyCandle1 cross DailyCandle2) (also possible Price cross HMA)
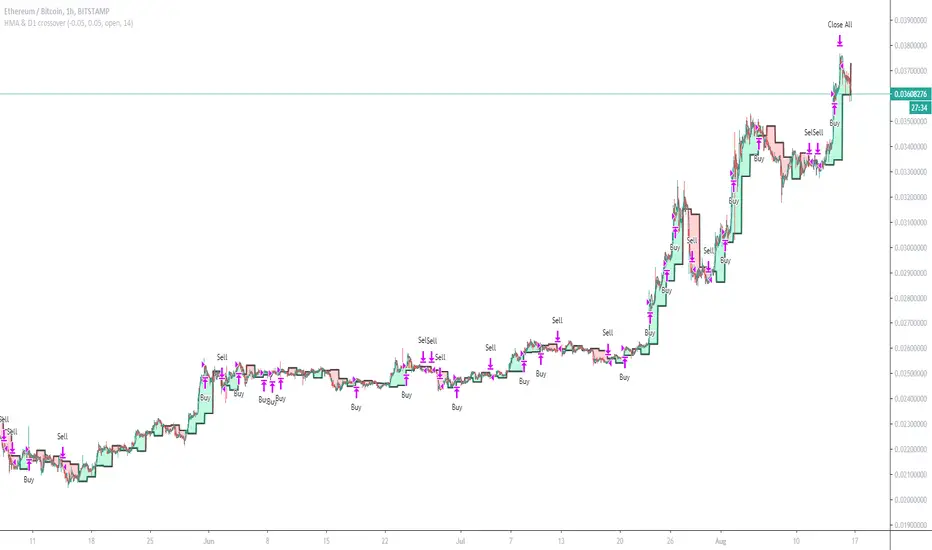
HMA & D1 crossoverCan work on Forex if change equity currency and SL and TP etc
This example tuned for ETH/BTC
Enters on HMA (Hull Moving Average) and D1 (Daily Candle) crossovers, Exits basket when profit = TP (Target Profit)
Has Commission and slippage added, test equity at 1 BTC lotsize set too 1% of equity for each order
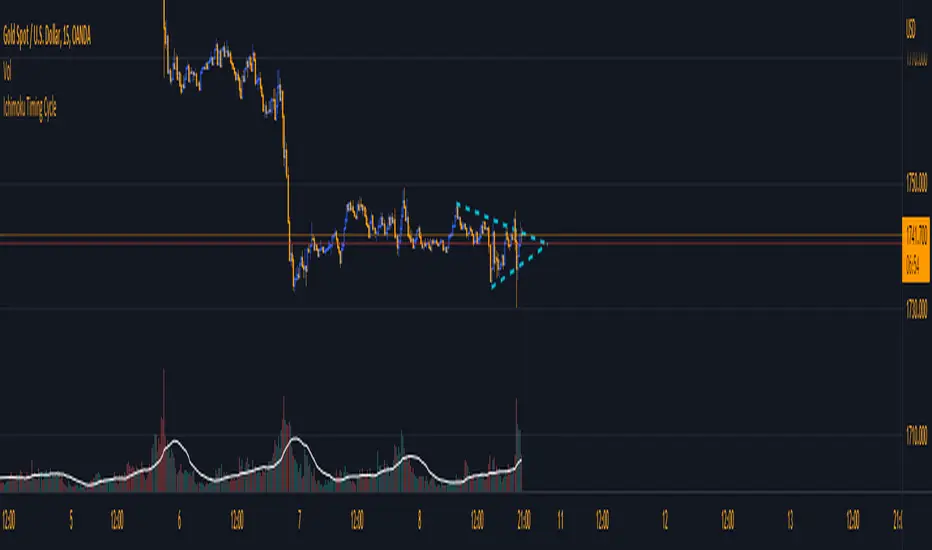
Ichimoku Candles V1Candles breakout use numbers ichimoku 9 17 26 52 65 129
+ candles up is white
+ candles up is yellow
+ symbol & number 17 ,52, 129 breakout HL zone (the previous candles)
+ symbol & no number breakout HL zone (the previous candles 9 ,26, 65 )
+ xcross top & bottom is 9 , 17
+ triangleup top candles is 26 , 52
+ flag bottom candles is 65 , 129
Best when combined with Ichimoku for Crypto , FX.....
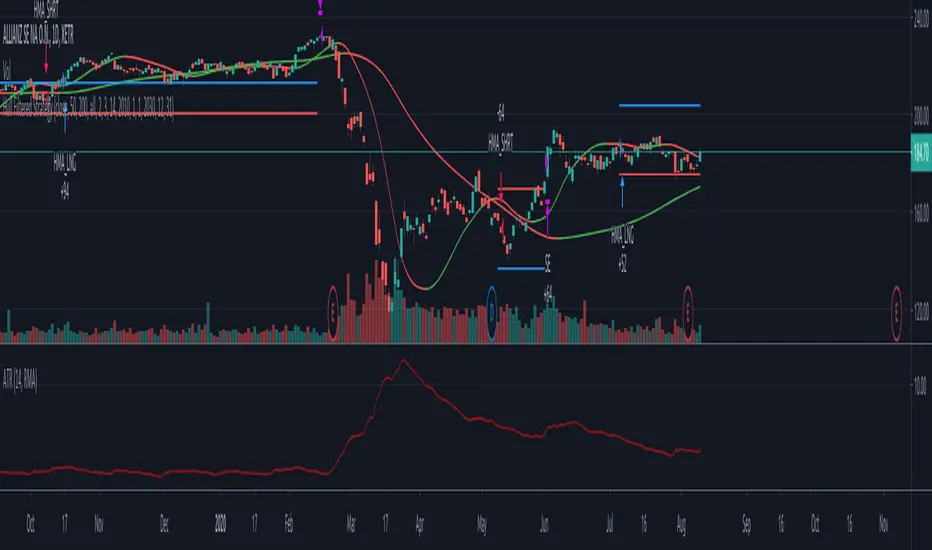
Hull Moving Average based strategyThis is a simple Hull Moving Average based strategy using a short term HMA for signal generation and a long term HMA for filtering purposes.
A long entry is generated if the short term HMA changes direction from decreasing to increasing values and if the long term HMA indicates an uptrend (i.e. previous value < current value)
A short entry is generated if the short term HMA changes direction from increasing to decreasing values and if the long term HMA indicates a downtrend (i.e. previous value > current value)
Positions are closed using an ATR based stop loss/take profit system. Stop Loss (red) and Take Profit (blue) levels are plotted on the chart.
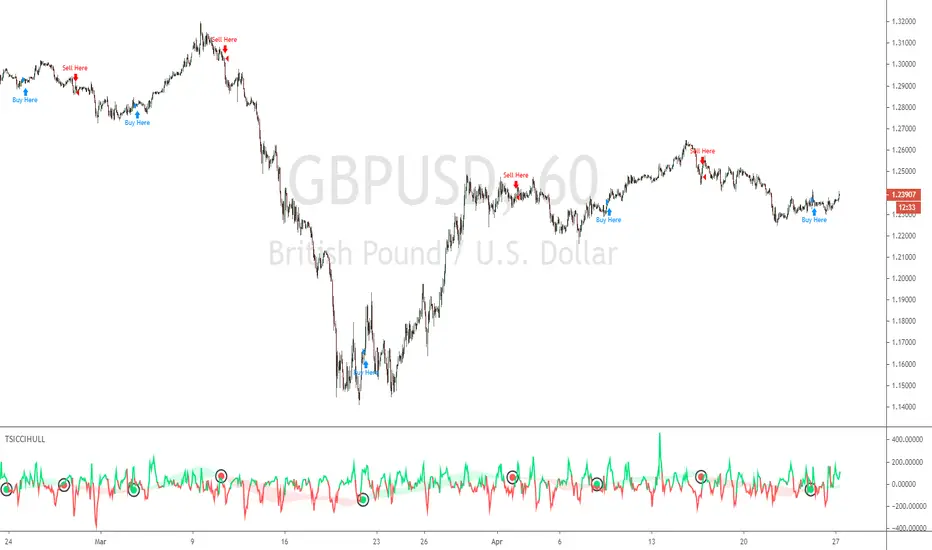
TSI CCI Hull with profit$$$$ , Alert versionThis is a modified version of @SeaSide420 TSI CCI Hull with profits exit on long and short order with alert as well
original script :
the strategy script:
/// feel free to edit/improve and comment

RSI Season Tracker by KrisWatersSeason tracker identifies the momentum with tracking dominance and market capitalization data of Bitcoin , Altcoin and USDT .
With this indicator you can able to get know about Bitcoin, Altcoin and USDT dominance and market capitalization easily.
Backgrond Color Definations:
If the background color of indicator is ORANGE means that Bitcoin dominance is the most powerful. It is a good sign for Bitcoin.
If the background color of indicator is BLUE means that Altcoin dominance is the most powerful. It is a good sign for Altcoins.
If the background color of indicator is GREEN means that USDT dominance is the most powerful. It is a good sign for USDT.
Plus Sign (+) Meaning and Color Definations:
If ORANGE plus sign is visible on indicator means that market capitalization of Bitcoin is increasing. It is a good sign for Bitcoin.
If BLUE plus sign is visible on indicator means that market capitalization of Altcoin is increasing. It is a good sign for Altcoins.
If GREEN plus sign is visible on indicator means that market capitalization of Bitcoin and Altcoins are decreasing. It is not a good sign for both.
Light and Dark RSI Line Color Definations:
If the line of Bitcoin color is Orange means that, RSI value was increased compared with previous bar. It is one of the good sign of the momentum strength.
If the line of Bitcoin color is Yellow means that, RSI value was decreased compared with previous bar. It is not a good sign.
If the line of Altcoin color is Navy means that, RSI value was increased compared with previous bar. It is one of the good sign of the momentum strength.
If the line of Altcoin color is Blue means that, RSI value was decreased compared with previous bar. It is not a good sign.
If the line of USDT color is Green means that, RSI value was increased compared with previous bar. It is one of good the sign of the momentum strength.
If the line of USDT color is Lime means that, RSI value was decreased compared with previous bar. It is not a good sign.
Simple RSI rules are valid for this indicator.
RSI value is under 30 indicates that asset is OVERSOLD .
RSI value is upper 70 indicates that asset is OVERBOUGHT .
Important Notice: Dominance data is not correlated with price. For example; sometimes dominance is increasing but the price is not. And that's where the market capitalization comes in.
If the plus sign is not visible , you can get questioning for the movement. It is not a good sign at all.
If the plus sign is visible and RSI is increasing , It is a good sign for the strength of assets movement.
I recommended to use on DAILY timeframe . But you can use different timeframes as well.
Please leave comment below If you have any question or development idea.

Cracking Cryptocurrency - Exponential Moving AveragesCracking Cryptocurrency - Exponential Moving Averages
This is the preferred EMA Indicator of Cracking Cryptocurrency Traders. We have based our statistical levels of support and resistance , trend, and momentum utilizing Fibonacci Numbers for our EMA inputs.
This script utilizes the Key Numbers of 8, 13, 21, 55, 100, and 200 as we have found those to work the best for Bitcoin and other Cryptocurrencies.
Features and Functions
Multi-Time Frame Function
Multiple Source Rendering
Multiple Smoothing Options
Adjust Look back Length
Plot Custom Signals
Multiple Time Frame Feature
Do you want to watch the EMA's of a higher or lower time frame while analyzing the price action of a different time frame? With this indicator, it's quite easy! Just select the desired Time Frame to display your EMA's and they will automatically change without affecting the price action you're currently looking at, or having to change your Time Frame Resolution. This has been upgraded and simplified with a drop-down menu for selecting your desired Time Frame.
Plot Crossovers
Want to keep it simple? Select Plot Crossovers and this script will display optimum times to buy and sell based on Trending Momentum utilizing your selected EMA crosses. Highly effective, back-test it and see!

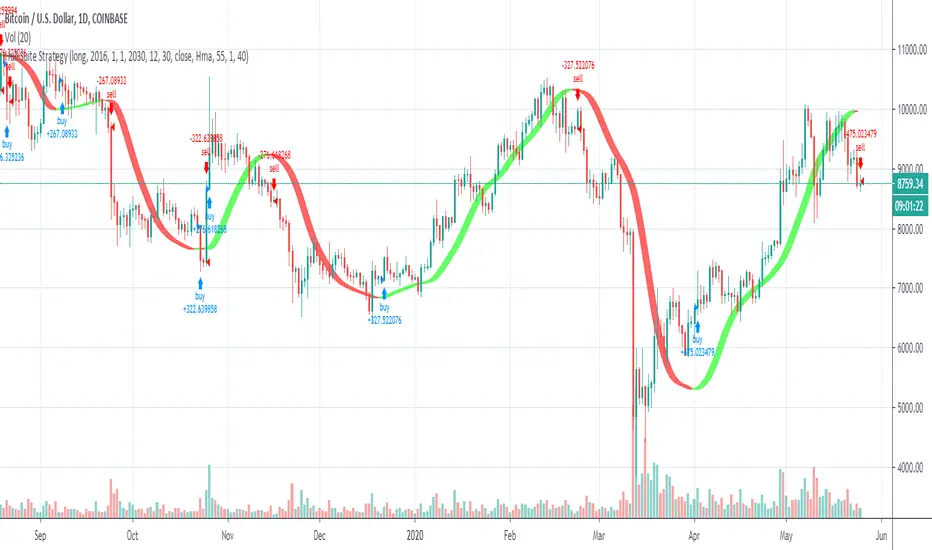
TSI CCI Hull with profit$$$This is a modified version of @SeaSide420 TSI CCI Hull with profits exit on long and short order
ORIGINAL SCRIPT:
/// /// feel free to edit/improve and comment

Hull Suite StrategyConverted the hull suite into a strategy script for easy backtesting and added ability to specify a time periods to backtest over.
1337 StrategyThis is a WIP strategy based on the 1337 Oscillator. It seems to catch some of the nice trending moves on the 1H but needs work to filter the choppy signals after a move and during consolidation.

VolHMA [sluggishmoney]Currently published volume scripts typically plot volume as a positive value. This one is different.
---WHAT IS IT---
If the close is greater than the open, the volume is considered positive, and if the close is less than the open, the volume is made negative. I have taken the HMA (Hull Moving Average) of this positive or negative volume with a default length of 100, and have plotted it as a histogram that is green if positive, and red if negative. The signal line is an SMA of this volume HMA with a default length of 10. The purple background is a suggested holding period for a potential long position.
---HOW TO USE IT---
When the HMA100 crosses above 0, this is considered a buy signal. This means that the smoothed volume is starting to become bullish (but delayed due to length of moving averages). When the HMA100 crosses under the signal, this is considered a sell signal.
---WHICH MARKETS---
I wrote this script specifically for cryptocurrency markets. The indicator does best with continuous volume data that's typically found in crypto markets, although I can picture this working well in FOREX as well. A volatile and continuous market can provide volume data that best captures the magnitude and direction of a move.

OneGreenCandle - Hull Keltner Channel
The Keltner Channel, a classic indicator of technical analysis developed by Chester Keltner in 1960.
The indicator is a bit like Bollinger Bands and Envelopes.
This variation uses the Hull Moving Average as the centre line for the channel.

Squeeze Momentum Indicator [LazyBear] vHMAThis is a remake of the famous LazyBear Indicator, the Squeeze Momentum Indicator.
All i did was take out the SMA's and replace them with HMA's. HMA is a more responsive moving average.
Hull Moving Average.
This is a derivative of John Carter's "TTM Squeeze" volatility indicator, as discussed in his book "Mastering the Trade" (chapter 11).
Black crosses on the midline show that the market just entered a squeeze ( Bollinger Bands are with in Keltner Channel). This signifies low volatility , market preparing itself for an explosive move (up or down). Gray crosses signify "Squeeze release".
Mr.Carter suggests waiting till the first gray after a black cross, and taking a position in the direction of the momentum (for ex., if momentum value is above zero, go long). Exit the position when the momentum changes (increase or decrease --- signified by a color change). My (limited) experience with this shows, an additional indicator like ADX / WaveTrend, is needed to not miss good entry points. Also, Mr.Carter uses simple momentum indicator , while I have used a different method (linreg based) to plot the histogram.
More info:
- Book: Mastering The Trade by John F Carter
Here is the original version:


TSI CCI HullThis Strategy is Using TSI and CCI and Hull Moving Average to make swing trades on 1H chart but can be used on any pair and timeframe just change settings to suit (Hull Period mostly)
Open Close Profit - [Alerts]This script comes with the following indicators and features:
Moving Average trend filter (Hull, ZLEMA, McGinley)
Pin Bar Filter
MACD indicator
Pump and Dump filter
Entry, Take Profit, and Stop Loss Alerts
And a few more indicators in the back-end to increase accuracy, optimize entries and filter out sideways PA
This script works really well as a scalper on lower Time Frames as well as on higher Time Frames. Besides that you can also use it on pretty much any coin or asset.
This script is not repainting. We advise to use alerts on “Once Per Bar Close”.
If you’d like to automate this script you can do that by using AutoView, ProfitView, ProfitTrailer, CryptoHopper etc.
Leave a message if you’d like to try it out.

The V_Wave: Volatility Adaptive Moving AverageThis is work in progress - but i wanted to see if there's interest to use or test it - or if someone finds it useful. there's already a crowd of great moving averages out there :)
This is a different type of zero-lag weighted moving average - and it's a concept that i have been working on for a while now. Given that this is WIP, i decided to keep the code protected for now.
The idea is to create a moving average that responds faster to the changes in the underlying data - which is the case with other zero-lag moving averages - but in this case, i also wanted to make it adaptive, so it accelerate when the volatility increases and at the same time, maintain limited lag and reasonable smoothing, even at longer length.
How Does it Compare to other MA's
==============================
in the chart, we can see a comparison between the V_Wave (thick yellow line) and the 3 common MAs, Hull Moving Average (HMA, aqua), a Weighted Moving Average (WMA, brown) and an Exponential Moving Average (EMA, grey)
the most important advantage in V_Wave, is because of the way the algorithm works, and that it maintains direct association with the underlying data and the given length, the V_Wave will have less overshoot when compared to other moving averages - i.e, it stays closer to the underlying data points at times of quick reversals or big changes - like the V reversal on the right of the chart. You can also test it against other MAs you may be already using and share your findings back with me.
settings:
=========
- the settings provide the ability to choose the source data (close vs hl2, ..etc), the length, and the ability to adjust the "aggressiveness" of the line (Accelerator) ..
- this accelerator is the factor that tells the V_Wave how fast to respond to the volatility changes. when you increase the accelerator, the V_Wave is more aggressive, and will respond faster to changes in volatility -- it becomes more responsive to changes in the trend, but that will sacrifice the smoothness of the line.
- i capped this value to 7, because beyond that, the accelerator will have a diminished effect.
- Also note that due to association with volatility, the V_Wave will behave differently at lower time frames -- and becomes closer to an EMA but better (in responsiveness) than a WMA.
- the smoothing is built-in for now, and will adjust based on the length, in a way similar to how HMA smoothing works (see my previous post on Evolving the Zero Lag MA for details on that) - in future versions, i may make it a manual entry or a selection between manual/automatic
Usage:
=======
Use the V_Wave as you use other moving averages - once you get to know how it behaves and adapts to underlying data changes.
you can use it as a filter to generate signals once it crosses other MAs, or another V_Wave of a different length / acceleration.
will be great if you share your test results and your use cases to help me improve how the V_Wave works.
best of luck!

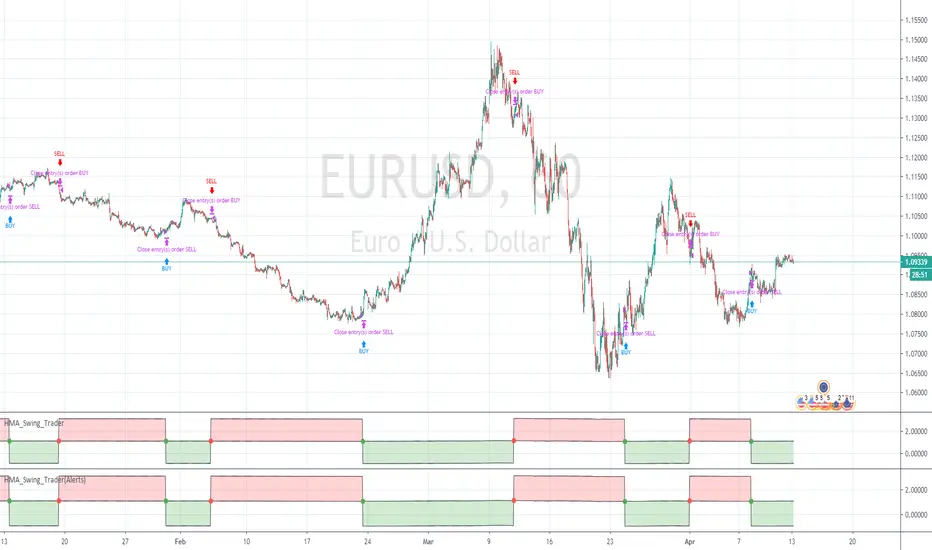
Hull Moving Average Swing Trader (Alerts)Hull Moving Average Strategy (Study version for ALERTS)
2 X HMA's,
1st HMA on current price (recommended source OPEN)
2nd HMA on previous candle. signal on crossover.
Buy and Sell signals on chart, red & green view pane (Green Buy, Red Sell) (RED & GREEN DOTS)