Jerry Buy Sell IndicatorThis indicator has unique conditions in the script that create the following:
1. Buy and Sell zones
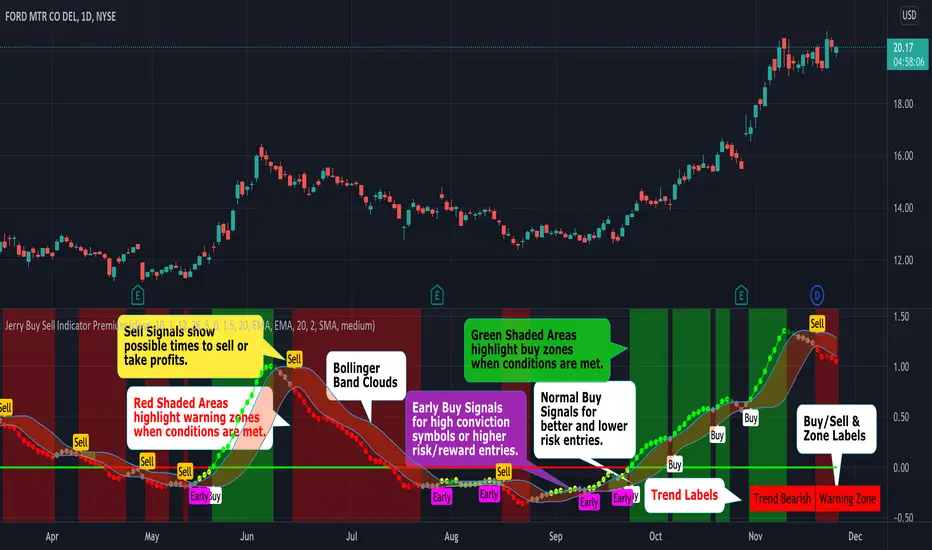
2. Early Buy, Buy and Sell signals that are determined by conditions including relative position to the zero line.
3. Defines 6 different short term trends
4. Trend Labels to show the current short term trend (located in the lower right corner).
5. Buy, Sell, Buy Zone & Warning Zone Labels
6. 14 user controlled inputs allow the user to customize the settings.
7. Unique functionality that allows you to create trade alerts based on conditions being met with criteria scans built into the indicator.
# 7 is a cool unique feature of our indicator. For example you can easily create a TRADE ALERT for a symbol based on a Buy Signal being met in any time frame. This is possible because we have built into the script the ability to select multiple conditions including BUY ALERT, EARLY BUY ALERT AND SELL ALERT. You can also use the alerts to scan your stocks individually for buy zones and warning zones or for crossing above or below the clouds. TradingView alerts can notify you via pop-up, email, sound notification, email to SMS & sound notifications.
Buy Sell Indicator Features
----- Trends
- Red Dots (Red Cloud) = Warning zone. Generally do not buy or consider selling.
- Dark Red Dots = Warning BUT Improving. Things are getting better.
- Grey Dots = Neutral. No clear short term trend.
- Yellow Dots = Early. Great for high conviction stocks but early for the main buy signal.
- Dark Green Dots = In the buy zone but losing strength.
- Green Dots (Green Cloud) = Trend is bullish & stock is in the buy zone.
- Trend Line = Shows the prevailing direction of price and if the momentum is beamish, bullish or neutral.
----- Buy & Sell Signals
- Early Buy Bubble= The first day the Early Buy signal is triggered. Early Buy Signals occur below the zero line and are higher risk/reward. This is a unique feature of this indicator.
- Buy Bubble = Indicator Buy Signal Triggered. Buy Signals occur above the zero line.
- Sell Bubble = Indicator Sell Signal Triggered.
----- Ways To Use The Indicator
1. Buy/Sell during with the main buy and sell Alerts in the Buy (green shaded) and Warning (red shaded) zones.
2. In The Red You’re Dead. Most buy signals happen outside of the red warning zone. There are exceptions like reversals and momentum squeezes.
3. Buy Sell Indicator can be used by itself or with other indicators (Momentum Dream works well)
4. Use Red and Green Clouds/Shading to assist with position direction. In the buy zone look to go long. In the red zone generally do not add to your position or consider selling.
5. Use Red Clouds to tighten stops or close positions.
6. Customize the indicators to vary the results by selecting Wilders, SMA, EMA, WMA, and HullMA moving averages.
7. The early buy signal/bubble appears on the chart the first day the early buy signal is triggered and can be used for entry into high conviction stocks or if you want to take a higher risk/reward trade.
8. The standard buy signal is shown when conditions have been met to indicate a better buy entry point with less risk.
Disclaimer: The information contained in our scripts/indicators/ideas does not constitute financial advice or a solicitation to buy or sell any securities of any type. We will not accept liability for any loss or damage, including without limitation any loss of profit, which may arise directly or indirectly from the use of or reliance on such information. All investments involve risk, and the past performance of a security, industry, sector, market, financial product, trading strategy, or individual’s trading does not guarantee future results or returns. Investors are fully responsible for any investment decisions they make. Such decisions should be based solely on an evaluation of their financial circumstances, investment objectives, risk tolerance, and liquidity needs.
Please Use the link below for more information.
Jerryromine
Jerry Romine Momentum Dream With Risk ManagementThe Momentum Dream Indicator with Risk Management is really two powerful indicators combined in one.
The Momentum Dream Indicator is a volatility and momentum indicator that measures the relationship between the Bollinger Bands and Keltner Channels to help identify consolidations and signal potential breakouts.
MOMENTUM DREAM INDICATOR:
SIGNALS AND ZONES:
Green Arrow = Post Squeeze Buy Triggered = GREEN ⇧ shows squeeze out on upward momentum (often a good time to buy)
Orange Arrow = Post Squeeze Sell Alert = ORANGE ⇩ shows squeeze out on downward momentum (often a good time to sell or NOT buy)
Green Dot on Chart - Day one of the buy zone
Green Shading - Buy Zone
Pink Dot on Chart - Day one of warning zone
Red Shading - Warning zone. Often a good time not to buy or to consider selling.
LABELS (Color Indicates Direction):
Momo Up / Down = Current momentum direction.
Squeeze = Squeeze is on and squeeze line dots are red.
Dots = number of day or bars the squeeze has been in red(on)
Squeeze Fired = Green or Orange arrow shows squeeze fired direction.
Stacked = Fibonacci 8, 21, 34, 55, 89 EMA are stacked up or down
SQUEEZE LINE COLOR DEFINITIONS:
Dark Red = Extra Squeeze (In & Out)
Red = Original Squeeze (In & Out)
Pink = Pre-Squeeze (In)
Yellow = Pre-Squeeze (Out)
Green = Bollinger Bands are officially outside of Keltner Channels
STRATEGY
There are multiple ways the Momentum Dream Indicator can be used.
1. Buy/Sell during the squeeze (generally lower volatility and lower option premiums)
2. Buy/Sell when the squeeze fires to catch the breakout (volume/volatility often increase)
3. Use Buy/Sell Zones with other signals for entering positions
4. Use Momentum to assist with position direction
5. Use fading momentum to tighten stops or close positions.
* The labels only show when certain criteria are met. For example if a squeeze fired the label only shows on that day but the indicator arrow will always show. For this reason the labels on the chart above will vary from day to day and only alert you when needed. :)
RISK MANAGEMENT INDICATOR
Risk management is a vital part of investing and this indicator provides 2 recommended positions sizes. One based on the classic 1-2% risk rule where you never risk more than X% of your account. A second based on position size not exceeding X% of your account.
The Risk Management Indicator does all of the hard math and provides you with a realistic trading plan, position size, and trail stop based on your customizable criteria. If you’ve ever wondered how much of a stock to buy, when to sell and when to take profits this indicator is for you!
Please Use the link below for more information or to purchase.

Jerry Romine TS BAR (PE Ratio, % Change, ATR, TS, Volume, NIM)We are excited to introduce our TradingView Bar which gives you a quick read of the stock, index, or cryptocurrency at a glance. The PE ratio helps you quickly categorize the security. Percentage of change helps you quickly assess if the stock is trending up (lots of green) or down (lots of red). The ATR (Average True Range) expresses the volatility of the stock and is used to determine the recommended trail stop. Volume Percent compares the last 3 trading days to the previous 30. And the Net Income Margin helps you quickly assess the stocks profitability.
The indicator components are:
Price to Earnings Ratio
Price Performance over time( 1 week, 1, month, 2 months 3 months, 6 months, 1 year, 2 years)
ATR (volatility indicator). Shown as a dollar and %
Recommended Trail Stop (Based on ATR multiple)
Volume Percent
Dividend Yield (stocks only)
Net Income Margin (stocks only)
* The Trail Stop and Volume indicator can be easily adjusted in the settings.
Please Use the link below for more information or to purchase.
