Standardized PSAR Oscillator [AlgoAlpha]Enhance your trading experience with the "Standardized PSAR Oscillator" 🪝, a powerful tool that combines the Parabolic Stop and Reverse (PSAR) with standardization techniques to offer more nuanced insights into market trends and potential reversals.
🔑 Key Features:
- 🛠 Customizable PSAR Settings: Adjust the starting point, increment, and maximum values for the PSAR to tailor the indicator to your strategy.
- 📏 Standardization: Smooth out volatility by standardizing the PSAR values using a customizable EMA, making reversals easier to identify.
- 🎨 Dynamic Color-Coding: The oscillator changes colors based on market conditions, helping you quickly spot bullish and bearish trends.
- 🔄 Divergence Detection: Automatic detection of bullish and bearish divergences with customizable sensitivity and confirmation settings.
- 🔔 Alerts: Set up alerts for key events like zero-line crossovers and trend weakening, ensuring you never miss a critical market move.
🚀 How to Use:
✨ Add the Indicator: Add the indicator to favorites by pressing the star icon, adjust the settings to suite your needs.
👀 Monitor Signals: Watch for the automatic plotting of divergences and reversal signals to identify potential market entries and exits.
🔔 Set Alerts: Configure alerts to get notified of key changes without constantly monitoring the charts.
🔍 How It Works:
The Standardized PSAR Oscillator is an advanced trading tool that refines the traditional PSAR (Parabolic Stop and Reverse) indicator by incorporating several key enhancements to improve trend analysis and signal accuracy. The script begins by calculating the PSAR, a widely used indicator known for its effectiveness in identifying trend reversals. To make the PSAR more adaptive and responsive to market conditions, it is standardized using an Exponential Moving Average (EMA) of the high-low range over a user-defined period. This standardization helps to normalize the PSAR values, making them more comparable across different market conditions.
To further enhance signal clarity, the standardized PSAR is then smoothed using a Weighted Moving Average (WMA). This combination of EMA and WMA creates an oscillator that not only captures trend direction but also smooths out market noise, providing a cleaner signal. The oscillator's values are color-coded to visually indicate its position relative to the zero line, with additional emphasis on whether the WMA is rising or falling—this helps traders quickly interpret the trend’s strength and direction.
The oscillator also includes built-in divergence detection by comparing pivot points in price action with those in the oscillator. This feature helps identify potential discrepancies between the price and the oscillator, signaling possible trend reversals. Alerts can be configured for when the oscillator crosses the zero line or when a trend shows signs of weakening, ensuring that traders receive timely notifications to act on emerging opportunities. These combined elements make the Standardized PSAR Oscillator a robust tool for enhancing your trading strategy with more reliable and actionable signals
Meanreversion

HMA Z-Score Probability Indicator by Erika BarkerThis indicator is a modified version of SteverSteves's original work, enhanced by Erika Barker. It visually represents asset price movements in terms of standard deviations from a Hull Moving Average (HMA), commonly known as a Z-Score.
Key Features:
Z-Score Calculation: Measures how many standard deviations the current price is from its HMA.
Hull Moving Average (HMA): This moving average provides a more responsive baseline for Z-Score calculations.
Flexible Display: Offers both area and candlestick visualization options for the Z-Score.
Probability Zones: Color-coded areas showing the statistical likelihood of prices based on their Z-Score.
Dynamic Price Level Labels: Displays actual price levels corresponding to Z-Score values.
Z-Table: An optional table showing the probability of occurrence for different Z-Score ranges.
Standard Deviation Lines: Horizontal lines at each standard deviation level for easy reference.
How It Works:
The indicator calculates the Z-Score by comparing the current price to its HMA and dividing by the standard deviation. This Z-Score is then plotted on a separate pane below the main chart.
Green areas/candles: Indicate prices above the HMA (positive Z-Score)
Red areas/candles: Indicate prices below the HMA (negative Z-Score)
Color-coded zones:
Green: Within 1 standard deviation (high probability)
Yellow: Between 1 and 2 standard deviations (medium probability)
Red: Beyond 2 standard deviations (low probability)
The HMA line (white) shows the trend of the Z-Score itself, offering insight into whether the asset is becoming more or less volatile over time.
Customization Options:
Adjust lookback periods for Z-Score and HMA calculations
Toggle between area and candlestick display
Show/hide probability fills, Z-Table, HMA line, and standard deviation bands
Customize text color and decimal rounding for price levels
Interpretation:
This indicator helps traders identify potential overbought or oversold conditions based on statistical probabilities. Extreme Z-Score values (beyond ±2 or ±3) often suggest a higher likelihood of mean reversion, while consistent Z-Scores in one direction may indicate a strong trend.
By combining the Z-Score with the HMA and probability zones, traders can gain a nuanced understanding of price movements relative to recent trends and their statistical significance.

Ranges and Breakouts [AlgoAlpha]💥 Ranges and Breakouts by AlgoAlpha is a dynamic indicator designed for traders seeking to identify market ranges and capitalize on breakout opportunities. This tool automatically detects ranges based on price action over a specified period, visualizing these ranges with shaded boxes and midlines, making it easy to spot potential breakout scenarios. The indicator includes advanced features such as customizable pivot detection, internal range allowance, and automatic trend color changes for quick market analysis.
Key Features
💹 Dynamic Range Detection : Automatically identifies market ranges using customizable look-back and confirmation periods.
🎯 Breakout Alerts : Get alerted to bullish and bearish breakouts for potential trading opportunities.
📊 Visual Aids : Displays pivot highs/lows within ranges and plots midlines with adjustable styles for easier market trend interpretation.
🔔 Alerts : Signals potential take-profit points based on volatility and moving average crossovers.
🎨 Customizable Appearance : Choose between solid, dashed, or dotted lines for midlines and adjust the colors for bullish and bearish zones.
How to Use
⭐ Add the Indicator : Add the indicator to favorites by pressing the star icon. Adjust the settings like the look-back period, confirmation length, and pivot detection to match your trading strategy.
👀 Monitor the Chart : Watch for new ranges to form, highlighted by shaded boxes on the chart. Midlines and range bounds will appear to help you gauge potential breakout points.
⚡ React to Breakouts : Pay attention to color changes and alert signals for bullish or bearish breakouts. Use these signals to enter or exit trades.
🔔 Set Alerts : Customize alert conditions for new range formations, breakout signals, and take-profit levels to stay on top of market movements without constant monitoring.
How It Works
The indicator detects price ranges by analyzing the highest and lowest prices over a specified period. It confirms a range if these levels remain unchanged for a set number of bars, at which point it visually marks the range with shaded boxes. Pivots are identified within these ranges, and a midline is plotted to help interpret potential breakouts. When price breaks out of these defined ranges, the indicator changes the chart's background color to signal a bullish or bearish trend. Alerts can be set for range formation, breakouts, and take-profit opportunities, helping traders stay proactive in volatile markets.

Machine Learning Support and Resistance [AlgoAlpha]🚀 Elevate Your Trading with Machine Learning Dynamic Support and Resistance!
The Machine Learning Dynamic Support and Resistance by AlgoAlpha leverages advanced machine learning techniques to identify dynamic support and resistance levels on your chart. This tool is designed to help traders spot key price levels where the market might reverse or stall, enhancing your trading strategy with precise, data-driven insights.
Key Features:
🎯 Dynamic Levels: Continuously adjusts support and resistance levels based on real-time price data using a K-means clustering algorithm.
🧠 Machine Learning: Utilizes clustering methods to optimize the identification of significant price zones.
⏳ Configurable Lookback Periods: Customize the training length and confirmation length for better adaptability to different market conditions.
🎨 Visual Clarity: Clearly distinguish bullish and bearish zones with customizable color schemes.
📉 Trailing and Fixed Levels: Option to display both trailing and fixed support/resistance levels for comprehensive analysis.
🚮 Auto-Cleaning: Automatically removes outdated levels after a specified number of bars to keep your chart clean and relevant.
Quick Guide to Using the Machine Learning Dynamic Support and Resistance Indicator
Maximize your trading with this powerful indicator by following these streamlined steps! 🚀✨
🛠 Add the Indicator: Add the indicator to favorites by pressing the star icon. Customize settings like clustering training length, confirmation length, and whether to show trailing or fixed levels to fit your trading style.
📊 Market Analysis: Monitor the dynamic levels to identify potential reversal points. Use these levels to inform entry and exit points, or to set stop losses.
How It Works
This indicator employs a K-means clustering algorithm to dynamically identify key price levels based on the historical price data within a specified lookback window. It starts by initializing three centroids based on the highest, lowest, and an average between the highest and lowest price over the lookback period. The algorithm then iterates through the price data to cluster the prices around these centroids, dynamically adjusting them until they stabilize, representing potential support and resistance levels. These levels are further confirmed based on a separate confirmation length parameter to identify "fixed" levels, which are then drawn as horizontal lines on the chart. The script continuously updates these levels as new data comes in, while also removing older levels to keep the chart clean and relevant, offering traders a clear and adaptive view of market structure.

AutocorrelationWhat is Autocorrelation?
Autocorrelation is a mathematical concept used to measure the degree of similarity between a given time series and a lagged version of itself over successive time intervals. Mathematically, it is the correlation of a signal with a delayed copy of itself as a function of delay. In simpler terms, autocorrelation helps us understand whether and how past values in a time series are related to future values.
Autocorrelation in Finance:
In finance, the autocorrelation is a tool used to analyze the behavior of time series data, such as asset prices or returns. It can reveal "patterns", trends, or cycles within the data.
Price Autocorrelation: When applied to prices, autocorrelations can indicate whether an asset price tends to follow a trend. On price you will typically observe positive autocorrelation because price often exhibits a momentum effect where today's price is positively correlated with past prices. As a result, when prices are trending, they tend to continue in the same direction, creating a positive autocorrelation.
Returns Autocorrelation: Returns on the other hand, generally show less autocorrelation than prices. This is because returns represent the change in prices over time, and in efficient markets, returns are often modeled as a random walk, leading to low or no significant autocorrelation. However, under certain market conditions, you may observe positive or negative autocorrelation in returns. Positive Autocorrelation of returns indicates a trend effect, where past returns can predict future returns. Negative Returns Autocorrelation suggest mean reversion, where large positive returns are often followed by negative returns and vice versa.
Critical Value Analysis:
This indicator comes with critical values based on user-selected confidence levels (90%,95%,99%). It assesses whether the autocorrelation at a particular lag is statistically significant, which is crucial for distinguishing between random noise and meaningful events.
Trading Based on Autocorrelation:
While this indicator was not really developed to be directly used for trading, this indicator is was instead to raise awareness on why you should avoid strategies involving mean reversion on price.

Hullinger Percentile Oscillator [AlgoAlpha]🚀 Introducing the Hullinger Percentile Oscillator by AlgoAlpha! 🚀
This versatile Pine Script™ indicator is designed to help you identify swing trends and potential reversals with precision. Whether you're looking to catch market swings or spot divergences, the Hullinger Percentile Oscillator offers a comprehensive suite of features to enhance your trading strategy.
Key Features
🎯 Customizable Hullinger Settings: Adjust the main length, source, and standard deviation multipliers to fine-tune the indicator to your preferred trading style.
🔄 Dynamic Oscillator Modes: Switch between "Swing" mode for trend identification and "Contrarian" mode for reversal spotting, adapting the indicator to your market view.
📉 Divergence Detection: The indicator includes parameters to control the sensitivity and confirmation of divergence signals, helping to filter out noise and highlight significant market moves.
🌈 Color-Coded Visuals: Easily distinguish between bullish and bearish signals with customizable color settings for a clear visual representation on your chart.
🔔 Alert Integration: Stay ahead of the market with built-in alerts for key conditions, including strong and weak reversals, as well as bullish and bearish swings.
Quick Guide to Using the Hullinger Percentile Oscillator
Maximize your trading edge with the Hullinger Percentile Oscillator by following these steps! 📈✨
🛠 Add the Indicator: Add the indicator to favorites by pressing the star icon ⭐. Customize settings like Main Length, Oscillator Mode, and Appearance to fit your trading needs.
📊 Market Analysis: Use "Swing" mode to track trends and "Contrarian" mode to spot reversals. Watch for divergence signals to catch potential trend changes.
🔔 Alerts: Set up alerts to be notified of significant market movements without constantly monitoring your chart.
How It Works
The Hullinger Percentile Oscillator calculates its signals by applying a modified standard deviation approach to the Hull Moving Average (HMA) of a selected price source. It creates both inner and outer bands based on different multipliers. The oscillator then measures the position of the price relative to these bands, smoothing the result for swing trend detection. Depending on the chosen mode, the oscillator either highlights swing trends or potential reversals. Divergences are detected by comparing recent pivot highs and lows in both price and the oscillator, allowing you to spot bullish or bearish divergence setups. Alerts are triggered based on key crossovers or when specific conditions are met, ensuring that you are always informed of crucial market developments.

Hullinger Bands [AlgoAlpha]🎯 Introducing the Hullinger Bands Indicator ! 🎯
Maximize your trading precision with the Hullinger Bands , an advanced tool that combines the strengths of Hull Moving Averages and Bollinger Bands for a robust trading strategy. This indicator is designed to give traders clear and actionable signals, helping you identify trend changes and optimize entry and exit points with confidence.
✨ Key Features :
📊 Dual-Length Settings : Customize your main and TP signal lengths to fit your trading style.
🎯 Enhanced Band Accuracy : The indicator uses a modified standard deviation calculation for more reliable volatility measures.
🟢🔴 Color-Coded Signals : Easily spot bullish and bearish conditions with customizable color settings.
💡 Dynamic Alerts : Get notified for trend changes and TP signals with built-in alert conditions.
🚀 Quick Guide to Using Hullinger Bands
1. ⭐ Add the Indicator : Add the indicator to favorites by pressing the star icon. Adjust the settings to align with your trading preferences, such as length and multiplier values.
2. 🔍 Analyze Readings : Observe the color-coded bands for real-time insights into market conditions. When price is closer to the upper bands it suggests an overbought market and vice versa if price is closer to the lower bands. Price being above or below the basis can be a trend indicator.
3. 🔔 Set Alerts : Activate alerts for bullish/bearish trends and TP signals, ensuring you never miss a crucial market movement.
🔍 How It Works
The Hullinger Bands indicator calculates a central line (basis) using a simple moving average, while the upper and lower bands are derived from a modified standard deviation of price movements. Unlike the traditional Bollinger Bands, the standard deviation in the Hullinger bands uses the Hull Moving Average instead of the Simple Moving Average to calculate the average variance for standard deviation calculations, this give the modified standard deviation output "memory" and the bands can be observed expanding even after the price has started consolidating, this can identify when the trend has exhausted better as the distance between the price and the bands is more apparent. The color of the bands changes dynamically, based on the proximity of the closing price to the bands, providing instant visual cues for market sentiment. The indicator also plots TP signals when price crosses these bands, allowing traders to make informed decisions. Additionally, alerts are configured to notify you of crucial market shifts, ensuring you stay ahead of the curve.

Predictive Order Blocks [CryptoSea]The Predictive Order Blocks Indicator is a unique and innovative tool that enhances market analysis by identifying support and resistance blocks based on standard deviations from a median line. Unlike traditional indicators that rely solely on the close price, this indicator leverages the median line and standard deviations to form areas of interest, rather than targeting a single price point. This approach provides a more accurate representation of market structure, especially during periods of consolidation and expansion.
Key Features
Multi-Term Length Analysis: The indicator offers short, medium, and long-term settings, allowing traders to customise the analysis based on their preferred trading strategy and timeframe. This flexibility ensures that the tool is adaptable to various market conditions and trading styles.
Standard Deviation-Based Order Blocks: The core functionality of the indicator revolves around calculating standard deviations from a median line to form support and resistance blocks. These blocks provide a clearer and more reliable picture of market structure compared to single-point levels. By focusing on areas rather than exact price levels, the indicator helps traders identify zones where price is likely to react, leading to more informed trading decisions.
Dynamic Box Creation: The indicator dynamically creates breakout boxes based on user-selected standard deviation ranges. These boxes are formed at the start of market expansion following periods of consolidation. This feature is particularly useful because it highlights key levels where price is likely to retrace after breaking out, providing traders with actionable insights during market transitions.
Proximity-Based Gradient Colors: The indicator features gradient colors that change based on the price's proximity to the standard deviation bands. This visual aid helps traders quickly assess the current market condition and the potential significance of the support and resistance blocks.
Adaptive Display Options: To accommodate different trading preferences, the indicator includes options to toggle the display of the trend line (median line) and the standard deviation bands. This flexibility allows traders to customise their chart view to match their analysis style, whether they prefer a more clutter-free view or a detailed breakdown of market levels.
In the example below, the indicator shows the bands compressing during a period of consolidation, highlighting the potential for a breakout.
How it Works
Median Line Calculation: The indicator calculates the median line using a user-defined period. This line serves as the central reference point from which the standard deviations are calculated. By using the median line instead of just the close price, the indicator provides a more stable and reliable baseline for identifying support and resistance areas.
Standard Deviation Bands: Around the median line, the indicator calculates multiple standard deviation bands. These bands represent areas where price is statistically likely to find support or resistance. By focusing on these areas, traders can better anticipate where price might react, rather than relying on arbitrary levels.
Dynamic Box Creation and Expansion Detection: The indicator monitors the compression and expansion of the standard deviation bands. During periods of low volatility (squeeze), the bands compress, indicating consolidation. Once the bands start expanding, it signals the potential for a breakout. At this point, the indicator dynamically creates predictive order blocks based on the selected standard deviation range. These blocks highlight key levels where price might retrace or react, providing traders with valuable entry and exit points.
Color-Coded Proximity Alerts: To further enhance usability, the indicator uses color gradients to indicate how close the current price is to the calculated bands. This visual representation helps traders quickly assess the potential significance of the price's current position relative to the support and resistance areas.
In the example below, the indicator shows the bands expanding with the price, triggering the formation of the predictive order block.
In the final example, the price retraces into the order block before bouncing back to the upside, demonstrating the effectiveness of the identified support area.
Alerts
Trend Line Alerts: The indicator provides alerts when the price crosses above or below the trend line (median line). This feature is crucial for traders looking to identify potential trend changes early, allowing them to act quickly on emerging opportunities.
Band Alerts: Alerts are also triggered when the price crosses above or below the upper or lower bands for each standard deviation level. This helps traders identify potential breakout or breakdown scenarios, ensuring they are notified of significant market movements as they happen.
Customisable Alert Conditions: To cater to different trading strategies, the indicator allows users to set alert conditions for each standard deviation band and the trend line. This level of customisation ensures that traders receive alerts that are relevant to their specific trading style and market analysis.
Application
Strategic Decision-Making: The Predictive Order Blocks Indicator assists traders in making informed decisions by providing detailed analysis of potential breakout zones. By identifying key support and resistance areas, the indicator helps traders plan their entries and exits with greater precision.
Trend Confirmation: The indicator reinforces trading strategies by identifying key levels where price is likely to react. This confirmation is crucial for traders looking to enter trades with higher confidence.
Customized Analysis: The indicator adapts to various trading styles with extensive input settings that control the display and calculation of order blocks. Whether you're a day trader, swing trader, or long-term investor, the indicator can be tailored to meet your specific needs.
Visual Clarity: With customizable color settings and display options, the indicator enhances chart readability, allowing traders to quickly and easily interpret market data.
The Predictive Order Blocks Indicator by CryptoSea is an invaluable addition to a trader's toolkit, offering depth and precision in market trend analysis to navigate complex market conditions effectively.

Machine Learning Adaptive SuperTrend [AlgoAlpha]📈🤖 Machine Learning Adaptive SuperTrend - Take Your Trading to the Next Level! 🚀✨
Introducing the Machine Learning Adaptive SuperTrend , an advanced trading indicator designed to adapt to market volatility dynamically using machine learning techniques. This indicator employs k-means clustering to categorize market volatility into high, medium, and low levels, enhancing the traditional SuperTrend strategy. Perfect for traders who want an edge in identifying trend shifts and market conditions.
What is K-Means Clustering and How It Works
K-means clustering is a machine learning algorithm that partitions data into distinct groups based on similarity. In this indicator, the algorithm analyzes ATR (Average True Range) values to classify volatility into three clusters: high, medium, and low. The algorithm iterates to optimize the centroids of these clusters, ensuring accurate volatility classification.
Key Features
🎨 Customizable Appearance: Adjust colors for bullish and bearish trends.
🔧 Flexible Settings: Configure ATR length, SuperTrend factor, and initial volatility guesses.
📊 Volatility Classification: Uses k-means clustering to adapt to market conditions.
📈 Dynamic SuperTrend Calculation: Applies the classified volatility level to the SuperTrend calculation.
🔔 Alerts: Set alerts for trend shifts and volatility changes.
📋 Data Table Display: View cluster details and current volatility on the chart.
Quick Guide to Using the Machine Learning Adaptive SuperTrend Indicator
🛠 Add the Indicator: Add the indicator to favorites by pressing the star icon. Customize settings like ATR length, SuperTrend factor, and volatility percentiles to fit your trading style.
📊 Market Analysis: Observe the color changes and SuperTrend line for trend reversals. Use the data table to monitor volatility clusters.
🔔 Alerts: Enable notifications for trend shifts and volatility changes to seize trading opportunities without constant chart monitoring.
How It Works
The indicator begins by calculating the ATR values over a specified training period to assess market volatility. Initial guesses for high, medium, and low volatility percentiles are inputted. The k-means clustering algorithm then iterates to classify the ATR values into three clusters. This classification helps in determining the appropriate volatility level to apply to the SuperTrend calculation. As the market evolves, the indicator dynamically adjusts, providing real-time trend and volatility insights. The indicator also incorporates a data table displaying cluster centroids, sizes, and the current volatility level, aiding traders in making informed decisions.
Add the Machine Learning Adaptive SuperTrend to your TradingView charts today and experience a smarter way to trade! 🌟📊

Volume Spread Analysis [AlgoAlpha]Unleash the power of Volume Spread Analysis (VSA) with our state-of-the-art indicator designed to detect market divergences and convergences, helping you make informed trading decisions. 📈
Key Features:
Detects bullish and bearish divergences based on volume and price movements. 📊🔍
Identifies bullish and bearish convergences, signaling potential trend continuations or reversals. 🔄📉
Customizable parameters for period length, volume SMA period, and outlier reduction factor. ⚙️🔧
Visual highlights for detected effects, with color-coded boxes and labels. 🟩🟥
Provides alerts for divergences and convergences, keeping you updated on market conditions. 🔔📬
📚 Introduction to Volume Spread Analysis (VSA) :
Volume Spread Analysis is a method used to interpret the relationship between volume and price to identify the intentions of market participants. By analyzing the spread (range) of a price bar and its corresponding volume, VSA helps traders discern market strength and potential reversals.
In VSA, harmony occurs when price and volume move in sync, such as when increasing prices(aka "Effect" in the script) are accompanied by increasing volume. This indicates a strong and healthy trend. Conversely, divergence happens when price and volume move in opposite directions. For example, if prices are rising lesser but volume is still high, it may signal a weakening trend and a potential reversal. Identifying these patterns helps traders understand market dynamics and make more informed trading decisions.
🛠 Quick Guide to Using the Volume Spread Analysis Indicator
⭐ Add the Indicator: Add the indicator to favorites by pressing the star icon. Customize settings such as period length, volume SMA period, and outlier reduction factor to fit your trading style.
📊 Market Analysis: Watch for color-coded boxes indicating effects and labels showing effort values. Look for divergences and convergences to identify potential trading opportunities. A higher work done suggests that the markets are needing to work harder to move the price and users can use that information as displayed below each trend impulse box to analyze the likely hood of trend continuation/reversals.
🔔 Alerts: Enable alerts for divergences and convergences to stay informed of critical market conditions without constant chart monitoring.
🔍 How It Works:
Our indicator meticulously analyzes volume and price data to detect significant market movements. It identifies periods where volume is above or below a moving average, marks these points, and tracks the price effect over a user-defined range. By calculating the effort (volume) and effect (price movement), it distinguishes between divergences and convergences based on predefined conditions. Bullish and bearish conditions are visually represented with color-coded boxes and labels, making it easy to spot trading opportunities. Alerts can be set to notify you of critical market conditions, ensuring you never miss a potential trade setup.
Happy trading! 📈🚀

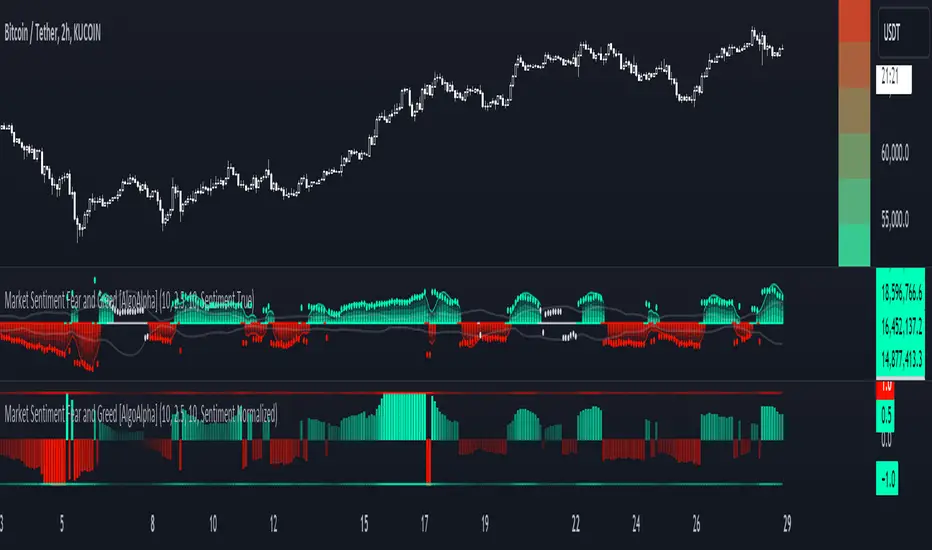
Market Sentiment Fear and Greed [AlgoAlpha]Unleash the power of sentiment analysis with the Market Sentiment Fear and Greed Indicator! 📈💡 This tool provides insights into market sentiment, helping you make informed trading decisions. Let's dive into its key features and how it works. 🚀✨
Key Features 🎯
🧠 Sentiment Analysis : Calculates market sentiment using volume and price data. 📊
📅 Customizable Lookback Window : Adjust the lookback period to fine-tune sensitivity. 🔧
🎨 Bullish and Bearish Colors : Visualize trends with customizable colors. 🟢🔴
🚀 Impulse Detection : Identifies bullish and bearish impulses for trend confirmation. 🔍
📉 Normalized Sentiment Index : Offers a normalized view of market sentiment. 📊
🔔 Alerts : Set alerts for key sentiment changes and trend impulses. 🚨
🟢🔴 Table Visualization : Displays sentiment strength using a gradient color table. 🗂️
How to Use 📖
Maximize your trading potential with this indicator by following these steps:
🔍 Add the Indicator : Search for "Market Sentiment Fear and Greed " in TradingView's Indicators & Strategies. Customize settings like the lookback window and trend breakout threshold to suit your trading strategy.
📊 Monitor Sentiment : Watch the sentiment gauge and plot changes to detect market sentiment shifts. Use the Normalized Sentiment Index for a more balanced view.
🚨 Set Alerts : Enable alerts for sentiment flips and trend impulses to stay ahead of market movements.
How It Works ⚙️
The indicator calculates market sentiment by averaging the volume and closing prices over a user-defined lookback period, creating a sentiment score. It differentiates between bullish and bearish sentiment by evaluating whether the closing price is higher or lower than the opening price, summing the respective volumes. The true sentiment is determined by comparing these summed values, with a positive score indicating bullish sentiment and a negative score indicating bearish sentiment. The indicator further normalizes this sentiment score by dividing it by the EMA of the highest high minus the lowest low over double the lookback period, ensuring values are constrained between -1 and 1. Bullish and bearish impulses are identified using Hull Moving Averages (HMA) of the positive and negative sentiments, respectively. When these impulses exceed a calculated threshold based on the standard deviation of the sentiment, it indicates a significant trend change. The script also includes a gradient color table to visually represent the strength of sentiment, and customizable alerts to notify users of key sentiment changes and trend impulses.
Unlock deeper insights into market sentiment and elevate your trading strategy with the Market Sentiment Fear and Greed Indicator! 📈✨
Rolling Price Activity Heatmap [AlgoAlpha]📈 Rolling Price Activity Heatmap 🔥
Enhance your trading experience with the Rolling Price Activity Heatmap , designed by AlgoAlpha to provide a dynamic view of price activity over a rolling lookback period. This indicator overlays a heatmap on your chart, highlighting areas of significant price activity, allowing traders to spot key price levels at a glance.
🌟 Key Features
📊 Rolling Heatmap: Visualize historical price activity intensity over a user-defined lookback period.
🔄 Customizable Lookback: Adjust the heatmap lookback period to suit your trading style.
🌫️ Transparency Filter: Fine-tune the heatmap’s transparency to filter out less significant areas.
🎨 Color Customization: Choose colors for up, down, and highlight areas to fit your chart’s theme.
🔄 Inverse Heatmap Option: Flip the heatmap to highlight less active areas if needed.
🛠 Add the Indicator: Add the Indicator to favorites. Customize settings like lookback period, transparency filter, and colors to fit your trading style.
📊 Market Analysis: Watch for areas of high price activity indicated by the heatmap to identify potential support and resistance levels.
🔧 How it Works
This script calculates the highest and lowest prices within a specified lookback period and divides the price range into 15 segments. It counts the number of candles that fall within each segment to determine areas of high and low price activity. The script then plots the heatmap on the chart, using varying levels of transparency to indicate the strength of price activity in each segment, providing a clear visual representation of where significant trading occurs.
Stay ahead of the market with this powerful visualization tool and make informed trading decisions! 📈💼

Efficiency Weighted OrderFlow [AlgoAlpha]Introducing the Efficiency Weighted Orderflow Indicator by AlgoAlpha! 📈✨
Elevate your trading game with our cutting-edge Efficiency Weighted Orderflow Indicator, designed to provide clear insights into market trends and potential reversals. This tool is perfect for traders seeking to understand the underlying market dynamics through efficiency-weighted volume calculations.
🌟 Key Features 🌟
✨ Smooth OrderFlow Calculation : Option to smooth order flow data for more consistent signals.
🔧 Customizable Parameters : Adjust the Order Flow Period and HMA Smoothing Length to fit your trading strategy.
🔍 Visual Clarity : Easily distinguish between bullish and bearish trends with customizable colors.
📊 Standard Deviation Normalization : Keeps order flow values normalized for better comparison across different market conditions.
🔔 Trend Reversal Alerts : Stay ahead with built-in alert conditions for significant order flow changes.
🚀 Quick Guide to Using the Efficiency Weighted Orderflow Indicator
🛠 Add the Indicator: Search for "Efficiency Weighted Orderflow " in TradingView's Indicators & Strategies. Customize settings like smoothing and order flow period to fit your trading style.
📊 Market Analysis: Watch for trend reversal alerts to capture trading opportunities by studying the behaviour of the indicator.
🔔 Alerts: Enable notifications for significant order flow changes to stay updated on market trends.
🔍 How It Works
The Efficiency Weighted Orderflow Indicator starts by calculating the efficiency of price movements using the absolute difference between the close and open prices, divided by volume. The order flow is then computed by summing these efficiency-weighted volumes over a specified period, with an option to apply Hull Moving Average (HMA) smoothing for enhanced signal stability. To ensure robust comparison, the order flow is normalized using standard deviation. The indicator plots these values as columns, with distinct colors representing bullish and bearish trends. Customizable parameters for period length and smoothing allow traders to tailor the indicator to their strategies. Additionally, visual cues and alert conditions for trend reversals and significant order flow changes keep traders informed and ready to act. This indicator improves on the Orderflow aspect of our Standardized Orderflow indicator. The Efficiency Weighted Orderflow is less susceptible to noise and is also quicker at detecting trend changes.
Visible Range Support and Resistance [AlgoAlpha]🌟 Introducing the Visible Range Support and Resistance 🌟
Discover key support and resistance levels with the innovative "Visible Range Support and Resistance" indicator by AlgoAlpha! 🚀📈 This advanced tool dynamically identifies significant price zones based on the visible range of your chart, providing traders with crucial insights for making informed decisions.
Key Features:
Dynamic support and resistance levels based on visible chart range 📏
User-defined resolution for tailored analysis 🎯
Clear visual representation of significant key zones 🖼️
Easy integration with any trading strategy 💼
How to Use:
🛠 Add the Indicator : Add the indicator to favourites. Adjust settings like resolution and horizontal extension to suit your trading style.
📊 Market Analysis : Identify key support and resistance zones based on the highlighted areas. These zones indicate significant price levels where the market may react.
How it Works:
The indicator segments the price range into user-defined resolutions, analyzing the highest and lowest points to establish boundaries. It calculates the frequency of price action within these segments, highlighting key levels where price movements are least concentrated (areas where price tends to pivot). Customizable settings like resolution and horizontal extension allow for tailored analysis, while the intuitive visual representation makes it easy to spot potential support and resistance zones directly on your chart.
By leveraging this indicator, you can gain deeper insights into market dynamics and improve your trading strategy with data driven support and resistance analysis. Happy trading! 💹✨

Institutional Liquidity and Price Action Concepts [AlgoAlpha]🚀 Introducing the Institutional Liquidity and Price Action Concepts™ (ILPAC) , a comprehensive toolkit developed by AlgoAlpha as part of our Premium Collection. This All-in-One indicator offers a robust approach to understanding price action and liquidity, empowering traders with hyper customizable features to tailor their analysis to their specific trading strategies.
Designed with efficiency and compactness in mind, the script shows Price action and liquidity through four methods: Market Structure , Liquidity Heatmap , Trend Lines , and FOMO Bubbles . Additionally, the script also includes a fully customizable interface, to match each individual's trading style. By utilizing a blend of advanced algorithms and customizable parameters, Institutional Liquidity and Price Action Concepts™ (ILPAC) provides traders with a vast array of trading strategies ranging from high frequency scalping to timing better entries on long-term swing and investing positions.
The ILPAC ™ can be used with or without other AlgoAlpha Premium Collection indicators as this indicator has been designed to be able to act as a standalone toolkit.
Let's delve into the key features and functionalities of this versatile indicator:
🎯 Key Features (summary):
Market Structure Analysis :
Customizable time-horizon
BOS confirmation methods
Adjustable CHoCH/BOS line styles
Swing point highlighting
Color customization
Liquidity Heatmap:
Configurable look-back period
Adjustable resolution
Customizable scale colors
Trend Lines :
Look-back period settings
Noise filter factor
Trend line signals with color options
FOMO Bubbles :
Configurable look-back period
Adjustable noise filter factor
Customizable bubble colors
🎯 Key Features (in-depth):
The Market Structure component within ILPAC ™ shows the underlying trend of the market using swing high and lows and is purely price action based. Higher Highs(HH), Higher Lows(HL) labels generally indicate an uptrend and Lower Highs(LH) and Lower Lows(LL) indicate a downtrend. The trend of the market is also determined by Change of Characters (CHoCH) and Break of Structure patterns (BOS). The Market Structure component marks out all these automatically and colours the bars on your chart for easy visualisation of trend.
The Liquidity Heatmap component within ILPAC ™ visualizes areas of high and low liquidity in the market. It identifies zones where liquidity is concentrated not only at specific price levels but also over time, giving the user a 3 Dimensional view of liquidity. The heatmap colours represent different levels of liquidity, making it easy to see where large volumes of orders may exist. This component helps traders understand the liquidity landscape and make informed decisions based on potential support and resistance levels.
The Trend Lines component within ILPAC ™ automatically draws trend lines based on historical price data. It identifies significant highs and lows, connecting them to form trend lines that highlight the overall market direction as well as give breakout signals as shown in the image below. The component also includes a noise filter to reduce false signals and ensure only valid trend breakouts are displayed. Customizable colour settings allow traders to personalize the visual representation of trend lines on their charts.
The FOMO Bubbles component within ILPAC ™ identifies periods of market activity driven by Fear of Missing Out (FOMO). By analysing price action and volume, it highlights bubbles where traders are likely entering positions impulsively. These bubbles are displayed on the chart with customizable colours, providing a visual cue for potential overbought or oversold conditions. This component helps traders recognize and potentially capitalize on market exuberance or panic.
🎯Usage Examples:
At its core, the components within ILPAC ™ were designed to operate with each other as a form of confluence and robust analysis. Typically, Price action components such as the Market Structure and Trend Lines can be used for entries while the Liquidity components like FOMO Bubbles and the Heatmap can be used to find exit points. Here are some examples of how they can be used.
Trend Trading
Using the Market Structure component, enter a trade during a CHoCH and set TP at key areas of liquidity using the heatmap. Users can also choose to enter into a BOS which is an indication of a trend continuation.
Reversal Trading
Using the Liquidity Heatmap to find areas of liquidity for possible reversals, wait for a rejection from a liquidity zone and use the Trend Line Breakout signals as confluence for an entry. Exits can be set at liquidity zones or using FOMO Bubbles as take profit signals.
(These are just examples for reference, the ILPAC ™ offers significantly more possibilities for customisation and fine tuning of your trading strategy.)
🎯Conclusion:
The Institutional Liquidity and Price Action Concepts™ (ILPAC) indicator by AlgoAlpha is a powerful tool for traders, offering in-depth market insights through its Market Structure, Liquidity Heatmap, Trend Lines, and FOMO Bubbles components. By integrating Price Action based analysis with Liquidity analysis, ILPAC ™ boasts a superior design for the confluence between its components, using Price Action components for entry opportunities and Liquidity based components for exit opportunities. With its highly customizable settings, this indicator caters to all trading styles, from scalping to long-term investing. By providing clear visualizations and automatic trend and liquidity detection, ILPAC ™ empowers traders to make informed decisions, enhancing their trading strategies and improving overall market understanding.
Paid script

RSI DeviationAn oscillator which de-trends the Relative Strength Index. Rather, it takes a moving average of RSI and plots it's standard deviation from the MA, similar to a Bollinger %B oscillator. This seams to highlight short term peaks and troughs, Indicating oversold and overbought conditions respectively. It is intended to be used with a Dollar Cost Averaging strategy, but may also be useful for Swing Trading, or Scalping on lower timeframes.
When the line on the oscillator line crosses back into the channel, it signals a trade opportunity.
~ Crossing into the band from the bottom, indicates the end of an oversold condition, signaling a potential reversal. This would be a BUY signal.
~ Crossing into the band from the top, indicates the end of an overbought condition, signaling a potential reversal. This would be a SELL signal.
For ease of use, I've made the oscillator highlight the main chart when Overbought/Oversold conditions are occurring, and place fractals upon reversion to the Band. These repaint as they are calculated at close. The earliest trade would occur upon open of the following day.
I have set the default St. Deviation to be 2, but in my testing I have found 1.5 to be quite reliable. By decreasing the St. Deviation you will increase trade frequency, to a point, at the expense of efficiency.
Cheers
DJSnoWMan06

Log Regression Channel [UAlgo]The "Log Regression Channel " channel is useful for analyzing price trends and volatility in a financial instrument over a specified period. By using logarithmic scaling, this indicator can more effectively handle the wide range of price movements seen in many financial markets, making it particularly valuable for assets with exponential growth characteristics.
The indicator plots the central regression line along with upper and lower deviation bands, providing a visual representation of potential support and resistance levels.
🔶 Key Features
Logarithmic Regression Line: The central line represents the logarithmic regression, which fits the price data over the specified length using a logarithmic scale. This helps in identifying the overall trend direction.
Deviation Bands: The upper and lower bands are plotted at a specified multiple of the standard deviation from the regression line, highlighting areas of potential overbought and oversold conditions.
Customizable Parameters: Users can adjust the length of the regression, the deviation multiplier, the color of the labels, and the size of the text labels to suit their preferences.
R-Squared Display: The R-squared value, which measures the goodness of fit of the regression model, is displayed on the chart. This helps traders assess the reliability of the regression line.
🔶 Calculations
The indicator performs several key calculations to plot the logarithmic regression channel:
Logarithmic Transformation: The prices and time indices are transformed using the natural logarithm to handle exponential growth in price data.
Regression Coefficients: The slope and intercept of the regression line are calculated using the least squares method on the transformed data.
Predicted Values: The regression equation is used to calculate predicted values for each data point.
Standard Deviation: The standard deviation of the residuals (differences between actual and predicted values) is computed to determine the width of the deviation bands.
Deviation Bands: Upper and lower bands are plotted at a specified multiple of the standard deviation above and below the regression line.
R-Squared Value: The R-squared value is calculated to measure how well the regression line fits the data. This value is displayed on the chart to inform the user of the model's reliability.
🔶 Disclaimer
The "Log Regression Channel " indicator is provided for educational and informational purposes only.
It is not intended as investment advice or a recommendation to buy or sell any financial instrument. Trading financial instruments involves substantial risk and may not be suitable for all investors.
Past performance is not indicative of future results. Users should conduct their own research.

Activity and Volume Orderflow Profile [AlgoAlpha]🔍 Activity and Volume Orderflow Profile 📊
🚀 Unlock the power of market order flow analysis with the Activity and Volume Orderflow Profile indicator by AlgoAlpha . This versatile tool helps you visualize and understand the dynamics of buying and selling pressure within a specified lookback period. Perfect for traders who want to dig deeper into volume-based market insights!
Key Features:
📊 Profile Type Options : Choose between "Comparison" and "Net Order Flow" to analyze market activity based on your preferred method.
🔎 Adjustable Lookback Period : Customize the lookback period to fit your trading strategy.
🎨 Flexible Appearance Settings : Toggle the display of the profile, lookback period visualization, and heatmap to suit your preferences.
🖍 Color Customization : Set your preferred colors for up and down volumes.
🕹 High Activity Highlight : Use the minimum transparency setting to highlight areas of significant activity.
Quick Guide to Using the Activity and Volume Orderflow Profile
🛠 Add the Indicator: Add the indicator to your favorites. Customize settings like profile type, lookback period, and resolution to fit your trading style.
📊 Market Analysis: Use the profile to identify areas of high buying or selling pressure. In "Comparison" mode, look for significant volume differences; in "Net Order Flow" mode, focus on net volume changes. Additionally, you can use the activity heatmap to find key levels that can act as support and resistance as price is likely to react to the zones as indicated by the heatmap.
How it Works:
The indicator operates by first gathering data on high and low prices, as well as buy and sell volumes, over a user-defined lookback period. It then calculates the maximum and minimum prices during this period and divides this range into bins based on the chosen resolution. For each bin, it computes the total volume of buy and sell orders. In "Comparison" mode, it displays side-by-side boxes representing buy and sell volumes, while in "Net Order Flow" mode, it shows the net volume difference. The indicator visually presents these profiles on the chart with customizable colors, transparency levels, and the option to display a heatmap for enhanced volume activity insights.
Maximize your trading with the Activity and Volume Orderflow Profile from AlgoAlpha! 🚀✨

Dickey-Fuller Test for Mean Reversion and Stationarity **IF YOU NEED EXTRA SPECIAL HELP UNDERSTANDING THIS INDICATOR, GO TO THE BOTTOM OF THE DESCRIPTION FOR AN EVEN SIMPLER DESCRIPTION**
Dickey Fuller Test:
The Dickey-Fuller test is a statistical test used to determine whether a time series is stationary or has a unit root (a characteristic of a time series that makes it non-stationary), indicating that it is non-stationary. Stationarity means that the statistical properties of a time series, such as mean and variance, are constant over time. The test checks to see if the time series is mean-reverting or not. Many traders falsely assume that raw stock prices are mean-reverting when they are not, as evidenced by many different types of statistical models that show how stock prices are almost always positively autocorrelated or statistical tests like this one, which show that stock prices are not stationary.
Note: This indicator uses past results, and the results will always be changing as new data comes in. Just because it's stationary during a rare occurrence doesn't mean it will always be stationary. Especially in price, where this would be a rare occurrence on this test. (The Test Statistic is below the critical value.)
The indicator also shows the option to either choose Raw Price, Simple Returns, or Log Returns for the test.
Raw Prices:
Stock prices are usually non-stationary because they follow some type of random walk, exhibiting positive autocorrelation and trends in the long term.
The Dickey-Fuller test on raw prices will indicate non-stationary most of the time since prices are expected to have a unit root. (If the test statistic is higher than the critical value, it suggests the presence of a unit root, confirming non-stationarity.)
Simple Returns and Log Returns:
Simple and log returns are more stationary than prices, if not completely stationary, because they measure relative changes rather than absolute levels.
This test on simple and log returns may indicate stationary behavior, especially over longer periods. (The test statistic being below the critical value suggests the absence of a unit root, indicating stationarity.)
Null Hypothesis (H0): The time series has a unit root (it is non-stationary).
Alternative Hypothesis (H1): The time series does not have a unit root (it is stationary)
Interpretation: If the test statistic is less than the critical value, we reject the null hypothesis and conclude that the time series is stationary.
Types of Dickey-Fuller Tests:
1. (What this indicator uses) Standard Dickey-Fuller Test:
Tests the null hypothesis that a unit root is present in a simple autoregressive model.
This test is used for simple cases where we just want to check if the series has a consistent statistical property over time without considering any trends or additional complexities.
It examines the relationship between the current value of the series and its previous value to see if the series tends to drift over time or revert to the mean.
2. Augmented Dickey-Fuller (ADF) Test:
Tests for a unit root while accounting for more complex structures like trends and higher-order correlations in the data.
This test is more robust and is used when the time series has trends or other patterns that need to be considered.
It extends the regular test by including additional terms to account for the complexities, and this test may be more reliable than the regular Dickey-Fuller Test.
For things like stock prices, the ADF would be more appropriate because stock prices are almost always trending and positively autocorrelated, while the Dickey-Fuller Test is more appropriate for more simple time series.
Critical Values
This indicator uses the following critical values that are essential for interpreting the Dickey-Fuller test results. The critical values depend on the chosen significance levels:
1% Significance Level: Critical value of -3.43.
5% Significance Level: Critical value of -2.86.
10% Significance Level: Critical value of -2.57.
These critical values are thresholds that help determine whether to reject the null hypothesis of a unit root (non-stationarity). If the test statistic is less than (or more negative than) the critical value, it indicates that the time series is stationary. Conversely, if the test statistic is greater than the critical value, the series is considered non-stationary.
This indicator uses a dotted blue line by default to show the critical value. If the test-static, which is the gray column, goes below the critical value, then the test-static will become yellow, and the test will indicate that the time series is stationary or mean reverting for the current period of time.
What does this mean?
This is the weekly chart of BTCUSD with the Dickey-Fuller Test, with a length of 100 and a critical value of 1%.
So basically, in the long term, mean-reversion strategies that involve raw prices are not a good idea. You don't really need a statistical test either for this; just from seeing the chart itself, you can see that prices in the long term are trending and no mean reversion is present.
For the people who can't understand that the gray column being above the blue dotted line means price doesn't mean revert, here is a more simple description (you know you are):
Average (I have to include the meaning because they may not know what average is): The middle number is when you add up all the numbers and then divide by how many numbers there are. EX: If you have the numbers 2, 4, and 6, you add them up to get 12, and then divide by 3 (because there are 3 numbers), so the average is 4. It tells you what a typical number is in a group of numbers.
This indicator checks if a time series (like stock prices) tends to return to its average value or time.
Raw prices, which is just the regular price chart, are usually not mean-reverting (It's "always" positively autocorrelating but this group of people doesn't like that word). Price follows trends.
Simple returns and log returns are more likely to have periods of mean reversion.
How to use it:
Gray Column (the gray bars) Above the Blue Dotted Line: The price does not mean revert (non-stationary).
Gray Column Below Blue Line: The time series mean reverts (stationary)
So, if the test statistic (gray column) is below the critical value, which is the blue dotted line, then the series is stationary and mean reverting, but if it is above the blue dotted line, then the time series is not stationary or mean reverting, and strategies involving mean reversion will most likely result in a loss given enough occurrences.

Swing Failure Zones and Signals [AlgoAlpha]Elevate your trading strategy with the Swing Failure Zones and Signals indicator by AlgoAlpha! This powerful tool helps you identify potential swing failure zones, offering clear bullish and bearish signals to guide your trading decisions. 📈💡
🎨 Bullish/Bearish Color Customization : Easily set the colors for bullish and bearish signals to match your chart preferences.
🧹 Mitigated Zone Removal : Option to remove mitigated zones from the chart for a cleaner view.
🔍 Range High/Low Lookback : Adjustable lookback period for determining significant highs and lows.
🖌 Dynamic Zone Creation : Automatically draws zones based on swing failure criteria.
🔔 Alert Conditions : Set alerts for both bullish and bearish swing failure conditions to stay informed without constant monitoring.
Quick Guide to Using the Swing Failure Zones and Signals Indicator
🛠 Add the Indicator : Search for "Swing Failure Zones and Signals " in TradingView's Indicators & Strategies. Customize settings like lookback period, colors, and zone removal options to fit your trading style.
📊 Market Analysis : Watch for the appearance of the zones and the directional arrows for potential reversal signals. Use these signals to identify key market entries and exits.
🔔 Alerts : Enable alerts for bullish and bearish swing failure conditions to capture trading opportunities without constant chart monitoring.
How it works
The indicator calculates the direction and length of each candle to identify swing failure points by comparing current high and low prices with those from the lookback period. A bullish swing failure is detected when the current low is lower than the previous low and the close is higher than the previous high, while a bearish swing failure occurs when the current high is higher than the previous high and the close is lower than the previous low. Upon detection, the script creates zones on the chart to indicate these failure points and manages them by removing invalidated zones based on the user's settings. Visual signals are plotted on the chart as arrows, and alerts are set for these conditions to help traders capture potential entry opportunities efficiently.
Enhance your trading edge with this robust tool designed to spotlight critical swing failure points in the market! 💪📈

Trend Strength Signals [AlgoAlpha]🌟Introducing the Trend and Strength Signals indicator by AlgoAlpha ! This tool is designed to help you identify trends and gauge market strength with precision and ease. 📈🚀
🛠 Customizable Parameters : Adjust the period, standard deviation multiplier, gauge size, and colors to fit your trading style.
📊 Trend Detection : Visualize trends with clear color-coded signals for uptrends and downtrends.
📈 Strength Gauge : Assess market strength with a dynamic gauge that adapts to the current price action.
🔔 Alerts : Set alerts for bullish and bearish trend crossovers and take profit points to stay ahead of the market.
🎨 Visual Enhancements : Enjoy a clutter-free chart with the integration of plot shapes, color fills, and gradient gauges.
🚀 Quick Guide to Using the Trend and Strength Signals Indicator
Maximize your trading with the Trend and Strength Signals indicator by following these streamlined steps! 🎯✨
🛠 Add the Indicator : Add the indicator to your favorites. Customize settings like period, standard deviation multiplier, and colors to fit your trading style.
📊 Market Analysis : Observe the color-coded candles and gauge to understand market trend direction and strength. Use the alerts for key trading signals.
🔔 Alerts : Enable notifications for trend crossovers and take profit points to catch trading opportunities without constantly monitoring the chart.
⚙️ How it works
This indicator calculates the moving average and standard deviation of the closing price over a customizable period to identify the upper and lower bounds. When the price crosses these bounds, it signals an uptrend or downtrend. The gauge measures market strength by comparing the price to the moving average and scaling it over a customizable range, while the underlying logic uses concepts from the Bollinger Bands, this indicator gives a unique perspective on price behavior through added features and signals derived from it.
Unleash the power of trend and strength analysis with this comprehensive indicator! Happy trading! 🚀📈✨
Cipher Mean ReversionThe Cipher Mean Reversion Indicator is an advanced trading tool that dynamically adjusts to market volatility to provide optimal entry and exit signals. This indicator is designed to identify significant deviations from a calculated mean, signaling potential reversal points where prices might revert to their average.
Core Functionality:
Cipher Mean Reversion uses an Exponential Moving Average (EMA) as the foundation for its mean price calculation. What sets Cipher apart is its dynamic adjustment mechanism that adapts the sensitivity of the EMA based on a volatility index. This index assesses both the rate and magnitude of price changes over a user-specified period, utilizing standard deviation and average true range calculations to gauge market volatility.
Unique Features:
Dynamic Sensitivity Adjustment: The sensitivity of our mean reversion detection changes in real-time, driven by our proprietary volatility index. This index is calculated using a combination of standard deviation and average true range, providing a robust measure of market volatility that informs the adjustment of our signal thresholds.
Adaptive Signal Thresholds: Instead of static buy and sell thresholds, Cipher uses thresholds that adapt to ongoing market conditions. These thresholds expand during periods of high volatility to reduce the risk of false signals and contract during quieter market conditions to capture smaller price reversals.
Signal Generation:
Buy Signals: Generated when the price falls significantly below the dynamically adjusted lower threshold, indicating an oversold condition ripe for reversal.
Sell Signals: Occur when the price exceeds the dynamically adjusted upper threshold, suggesting an overbought condition likely to revert.
Usage Tips:
Parameter Customization: Users can adjust the lookback period for the volatility assessment and the length of the EMA to better fit different assets and trading styles.
Complementary Analysis: For enhanced trading decisions, combine the Cipher Mean Reversion with other analytical tools such as volume indicators or momentum oscillators.
Risk Management: Employ risk management strategies, including predefined stop-loss and take-profit levels, tailored to the volatility insights provided by the indicator.
Originality and Usefulness:
The Cipher Mean Reversion Indicator offers a novel approach to mean reversion analysis by integrating real-time volatility adaptations into the signal generation process. This methodology ensures that the indicator remains highly responsive to changing market dynamics, providing traders with signals that are both timely and relevant.
Intended Use:
Cipher is versatile and can be used across various asset classes, including stocks, forex, and commodities. It is ideal for traders who require an indicator that can adapt to different market environments, from fast-moving markets to more stable conditions.

Volume Weighted Relative Strength Index (VWRSI) [AlgoAlpha]Volume Weighted Relative Strength Index 📈✨
The Volume Weighted Relative Strength Index (VWRSI) by AlgoAlpha enhances traditional RSI by incorporating volume weighting, providing a more nuanced view of market strength. It uses custom range detection to measure consolidation strength, applying dynamic scoring to highlight trend phases. The indicator includes customizable moving averages (SMA, EMA, WMA, VWMA) and color-coded visual cues for uptrends and downtrends. Additionally, it marks significant bullish and bearish trend points with symbols, making it easier to identify potential trading opportunities. This powerful tool helps traders make informed decisions by combining volume, price action, and trend analysis.
✨ Key Features :
📊 Volume-Weighted RSI : Combines RSI with volume for better accuracy.
🔄 Range Detection : Identifies consolidation phases.
🎨 Customizable MAs : Choose from various moving averages.
🔔 Alert Capabilities : Set notifications for trend points.
🚀 How to Use :
🛠 Add Indicator : Add the indicator to favorites, and customize the settings to suite your trading style.
📊 Analyze Market : Watch RSI and range score for trends.
🔔 Set Alerts : Get notified of bullish/bearish points.
✨ How It Works :
The Volume Weighted Relative Strength Index (VWRSI) combines traditional RSI with volume weighting to offer a more comprehensive view of market momentum. It calculates the RSI using the closing price, then weights it by volume to enhance the accuracy of the trend analysis. The indicator also includes a custom range detection feature that evaluates consolidation strength by dynamically scoring the RSI over a specified period. This scoring helps identify phases of strong trends and consolidations. Visual elements like color-coded trend fills and symbols for bullish and bearish points make it easier to spot key market movements and potential trading opportunities.
Stay ahead with VWRSI by AlgoAlpha! 📈💡
