Higher Timeframe TrendMap [BigBeluga]🔵HTF TrendMap
A powerful visual overlay that brings higher timeframe market structure directly onto your intraday chart.
This tool maps directional bias, trend strength, and dynamic range boundaries from a user-selected HTF (like Daily or 4H), offering a real-time confluence layer for scalpers, day traders, and swing traders.
By plotting the evolving average (HL2), it acts as a volatility-weighted trend anchor, allowing you to align lower timeframe entries with higher timeframe intent.
Technical Overview:
At the close of each higher timeframe (HTF) candle, the indicator stores the high, low, and calculates the HL2 midpoint. These values are then referenced on the lower timeframe chart to plot trend direction and price boundaries.
🔵 KEY FEATURES
Maps the selected higher timeframe (HTF) (e.g., Daily) onto your current chart.
At the close of each HTF candle , it starts to calculate and store the highest, lowest, and average (HL2) price levels .
The average (HL2) value is treated as the HTF trend baseline —plotted in orange for uptrend , blue for downtrend .
Visual curve thickens and fades to show progress through the HTF period (stronger color = fresher data).
Horizontal dashed lines show HTF high and low levels that persist until the next period closes.
On every HTF close, two price labels are printed for the high and low levels.
Vertical separators visually mark the start of each HTF candle for easy structural recognition.
A real-time dashboard shows selected HTF, current trend direction (🢁/🢃), and updates dynamically.
🔵 HOW TO USE
Use the HTF average line as a bias filter —only long when the trend is up (orange), short when down (blue).
HTF high/low labels help identify key breakout or rejection zones .
Combine with intraday systems or reversal tools for multi-timeframe confluence setups .
Ideal for scalpers and swing traders who rely on HTF momentum shifts .
🔵 CONCLUSION
HTF TrendMap provides a clean, data-rich layer of higher timeframe context to any chart. With adaptive trend coloring, volatility mapping, and real-time data labeling, it enables traders to stay in sync with macro structure while executing on the micro.
Indicators and strategies

Volume Cluster Support & ResistanceVolume Cluster Support & Resistance
This indicator identifies potential Support and Resistance (S/R) levels on the chart using Volume-Based Point of Control (POC) Clustering. It offers extensive customization for calculation parameters, display styles, and visualization options, including S/R zones, color gradients, and historical reaction markers.
How It Works
Volume Based S/R:
Scans the specified Clustering Lookback period for "High Volume Bars", defined as bars where volume exceeds the average volume (over Volume Lookback Period) multiplied by the High Volume Threshold Multiplier.
Calculates the Point of Control (POC) for each high-volume bar using hl2.
Clusters these high-volume bar POCs: POCs within a proximity defined by Cluster Proximity (ATR) (Average True Range multiplier) are grouped together.
Filters these clusters, requiring a Min Bars in Cluster to form a valid S/R zone.
(Image showing the indicator being used on the Bitcoin 5min chart)
The center price of valid clusters determines the S/R level. Clusters above the current price become potential Resistance, and those below become potential Support.
Calculates the offset based on the most recent bar included in the cluster.
Level Selection & Display:
The indicator identifies multiple potential S/R levels.
It then selects and displays the top Number of S/R Levels to Display support levels below the current price and resistance levels above the current price.
(Image showing the indicator on the GBP/USD 5min chart)
ATR Usage:
The Average True Range (ta.atr(14)) is used in two key areas:
Determining the proximity threshold for grouping POCs in the 'Volume Based' clustering (clusterProximityAtr).
Calculating the width of the S/R zones when 'Use Zone Visualization' is enabled (zoneAtrMultiplier).
Key Features & Components
Dual Calculation Methods: Choose between Pivot-based S/R or Volume-based POC clustering.
Volume Confirmation: Pivots require volume confirmation; Volume method directly analyzes high-volume bars.
POC Clustering: Groups high-volume areas to identify significant price zones.
Configurable Lookbacks: Adjust periods for volume averaging, pivot detection, and clustering analysis.
Dynamic S/R Display: Shows a configurable number of the most relevant S/R levels relative to the current price.
Optional Zone Visualization: Display levels as filled zones with configurable width (ATR-based), fill transparency, and border transparency. Includes a dashed center line.
Optional Historical Reactions: Mark past price interactions (lows bouncing off support zones, highs rejecting from resistance zones) directly on the chart (Warning: Can significantly impact performance).
Customizable Styling: Control line style (Solid, Dashed, Dotted), width, color (separate for Support & Resistance), and horizontal extension (None, Left, Right, Both).
Price Labels: Toggle visibility of price labels next to each S/R level/zone.
Visual Elements Explained
S/R Lines/Zones: Plotted lines or filled zones representing calculated support and resistance levels. Color-coded for Support (default green) and Resistance (default magenta).
Line/Zone Borders: Appearance controlled by Style settings (Style, Width, Extension). Can have a gradient color effect based on age if enabled.
Zone Fills: Semi-transparent fills for zones (if enabled), with configurable transparency. Fill color matches the border color (including gradient effect if enabled).
Zone Center Line: A thin, dashed line indicating the exact calculated S/R price within a zone.
Price Labels: Text labels showing the exact price of the S/R level.
Historical Reactions: Small dot markers appearing on historical bars where price potentially reacted to a displayed zone (only if Show Historical Reactions is enabled).
Configuration Options
Users can adjust the following parameters in the indicator settings:
Calculation Method: Select "Pivot Based" or "Volume Based".
Volume Zone Settings (Volume Based): Threshold multiplier, clustering lookback, cluster proximity (ATR), minimum bars per cluster.
Display Options: Toggle S/R visibility, price tags, set the number of levels to show.
Volume Settings: Volume lookback period, volume multiplier (for Pivot confirmation).
Style Settings: Line style, width, extension, support/resistance text and line colors, enable gradient coloring, set gradient start/end colors.
Zone Visualization: Enable/disable zones, set zone width (ATR multiplier), fill and border transparency, enable/disable historical reaction markers (performance warning).
Interpretation Notes
This indicator identifies potential areas of support and resistance based on historical price action and volume analysis. These levels are not guaranteed reversal points.
The 'Volume Based' method focuses on areas where significant trading activity occurred, while the 'Pivot Based' method focuses on price turning points confirmed by volume.
Use the displayed levels in conjunction with other technical analysis tools, price action patterns, and risk management strategies.
Be mindful of the performance impact when enabling Show Historical Reactions, especially on longer timeframes or with large lookback periods. The default setting is false for optimal performance.
The max_bars_back setting is optimized for performance; increasing it significantly may slow down chart loading.
Risk Disclaimer
Trading involves significant risk. This indicator is provided for analytical and educational purposes only and does not constitute financial advice or a trading recommendation. Past performance is not indicative of future results. Always use sound risk management practices and never trade with capital you cannot afford to lose.

SMC Structures and FVG📌 SMC Structures + FVG + Trend Viewer Pro
This advanced indicator helps traders visualize market structure with key tools:
✅ Break of Structure (BOS)
✅ Change of Character (CHoCH)
✅ Current Structure
✅ Fair Value Gaps (FVG)
✅ Automatic Fibonacci Levels
✅ Fixed Top-Right Trend Viewer (Bullish, Bearish, Sideways)
Designed for Smart Money Traders, this tool combines multiple key elements into one easy-to-use package. Perfect for day trading, swing trading, and spotting key zones.
⚡ Disclaimer:
This indicator is for educational purposes only. It is not financial advice. Please trade responsibly and use proper risk management.
📌 SMC Structures + FVG + Trend Viewer Pro
อินดิเคเตอร์ที่ออกแบบมาเพื่อช่วยให้นักเทรดมองเห็นโครงสร้างตลาดอย่างชัดเจนด้วยเครื่องมือสำคัญ:
✅ Break of Structure (BOS)
✅ Change of Character (CHoCH)
✅ โครงสร้างปัจจุบัน
✅ Fair Value Gaps (FVG)
✅ เส้น Fibonacci อัตโนมัติ
✅ ตัวบอกแนวโน้มค้างมุมขวาบน (Bullish, Bearish, Sideways)
เหมาะสำหรับสาย Smart Money, Day Trade, Swing Trade และผู้ที่เน้นหาจุดเข้าออกในโซนสำคัญ
⚡ คำเตือน:
อินดิเคเตอร์นี้ใช้เพื่อการศึกษาเท่านั้น ไม่ใช่คำแนะนำทางการเงิน โปรดบริหารจัดการความเสี่ยงอย่างเหมาะสม

OTE & A-B-C Zone Indicator SwiftEdgeOTE & A-B-C Zone Indicator SwiftEdge
Overview
The OTE & A-B-C Zone Indicator SwiftEdge is a versatile tool designed to help traders identify high-probability trading setups using a combination of Optimal Trade Entry (OTE) zones, Fibonacci levels, and A-B-C price patterns. This indicator is particularly useful for traders who rely on price action and Fibonacci-based strategies to find entry points, set stop-losses, and target potential take-profit levels. By integrating swing point detection, trend analysis, and Fibonacci projections, SwiftEdge provides a clear visual framework for making informed trading decisions across various timeframes.
What It Does
SwiftEdge identifies key price levels and zones to guide your trading:
OTE Zone: Highlights the Optimal Trade Entry zone between swing points A (swing high) and B (swing low) using Fibonacci retracement levels (default: 0.618 to 0.786). This zone represents a high-probability area for price reversals, making it an ideal entry point for trades.
A-B-C Pattern: Marks the latest swing points as A (swing high), B (swing low), and C (projected take-profit level) with dashed lines and labels. A solid line connects A to B to C, visually illustrating the price movement from entry to target.
Take-Profit Zones: Projects three customizable take-profit levels (TP1, TP2, TP3) based on Fibonacci extensions (default: 1.272, 1.618, 2.0) from the A-B swing, helping traders plan exits with favorable risk-reward ratios.
How It Works
SwiftEdge combines several technical components to create a cohesive trading system:
Swing Point Detection: Identifies significant swing highs (A) and swing lows (B) using a dynamic lookback period that adjusts to the selected timeframe. On lower timeframes like 1-minute charts, an ATR-based filter reduces noise by requiring price movements to exceed a threshold (0.5 * ATR(14)).
Trend Analysis: Uses an Exponential Moving Average (EMA) to determine the trend direction (default: 50-period EMA on 1H). The indicator marks uptrends (price above EMA) in green and downtrends (price below EMA) in red, ensuring trades align with the market's direction.
Fibonacci Levels: Applies Fibonacci retracement to define the OTE zone between A and B, and Fibonacci extensions to project take-profit levels (C) beyond the initial swing. This approach leverages the natural tendency of markets to respect Fibonacci ratios for reversals and extensions.
Visual Clarity: Displays only the latest A-B-C pattern with three dashed lines (A, B, C) and a solid connecting line, ensuring the chart remains uncluttered and easy to interpret.
The combination of these elements creates a structured setup where the OTE zone (between A and B) serves as an entry point, while the projected C level offers a target, all within the context of the prevailing trend. This synergy makes SwiftEdge a powerful tool for traders seeking to combine price action, trend analysis, and Fibonacci strategies.
How to Use
Add the Indicator: Apply the indicator to your chart via TradingView's indicator menu.
Identify the Trend: The OTE zone and A-B-C pattern will be colored green in uptrends (price above EMA) or red in downtrends (price below EMA). Use this to determine the market direction.
Entry Point: Look for price reversals within the OTE zone (between A and B). This zone is typically between the 0.618 and 0.786 Fibonacci retracement levels of the A-B swing, making it a high-probability area for entries.
Stop-Loss: Place your stop-loss below the OTE zone in an uptrend (or above in a downtrend) to protect against false breakouts.
Take-Profit Targets: Use the projected take-profit zones (TP1, TP2, TP3) as potential exit levels. These are based on Fibonacci extensions and can be toggled on/off in the settings.
Customization:
Adjust the Fibonacci levels for the OTE zone (Fibonacci Level 1 and Fibonacci Level 2) to suit your strategy.
Modify the take-profit levels (Fibonacci Extension Level for TP1/TP2/TP3) to target different extension ratios.
Change the lookback period (Base Lookback Period) and EMA period (Base EMA Period) to fine-tune swing point detection and trend sensitivity.
Customize colors for uptrends, downtrends, and A-B-C lines to match your preferences.
What Makes It Unique
SwiftEdge stands out by integrating swing point detection, Fibonacci-based OTE zones, and A-B-C price patterns into a single, visually intuitive indicator. Unlike standalone Fibonacci tools or trend indicators, SwiftEdge combines these elements to provide a complete trading setup: it identifies entry zones (OTE), confirms trend direction (EMA), and projects take-profit targets (Fibonacci extensions). The dynamic timeframe adjustment ensures consistent performance across all chart intervals, while the clean A-B-C visualization (with only the latest pattern displayed) prevents chart clutter, making it easier to focus on the most relevant price levels.
Notes
This indicator is designed for traders familiar with price action and Fibonacci strategies. It does not guarantee profits and should be used in conjunction with other analysis tools and proper risk management.
Performance may vary depending on market conditions and timeframe. Test the indicator on a demo account before using it in live trading.

DECODE Multi SMA EMANo need to keep reconfiguring your moving averages. Set up to 10 moving averages, 5 x SMA and 5 x EMA, and optionally apply coloured shading between pairs. Once it's set up, just turn them on or off as needed!

ConeCastConeCast is a forward-looking projection indicator that visualizes a future price range (or "cone") based on recent trend momentum and adaptive volatility. Unlike lagging bands or reactive channels, this tool plots a predictive zone 3–50 bars ahead, allowing traders to anticipate potential price behavior rather than merely react to it.
How It Works
The core of ConeCast is a dynamic trend-slope engine derived from a Linear Regression line fitted over a user-defined lookback window. The slope of this trend is projected forward, and the cone’s width adapts based on real-time market volatility. In calm markets, the cone is narrow and focused. In volatile regimes, it expands proportionally, using an ATR-based % of price to scale.
Key Features
📈 Predictive Cone Zone: Visualizes a forward range using trend slope × volatility width.
🔄 Auto-Adaptive Volatility Scaling: Expands or contracts based on market quiet/chaotic states.
📊 Regime Detection: Identifies Bull, Bear, or Neutral states using a tunable slope threshold.
🧭 Multi-Timeframe Compatible: Slope and volatility can be calculated from higher timeframes.
🔔 Smart Alerts: Detects price entering the cone, and signals trend regime changes in real time.
🖼️ Clean Visual Output: Optionally includes outer cones, trend-trail marker, and dashboard label.
How to Use It
Use on 15m–4H charts for best forward visibility.
Look for price entering the cone as a potential trend continuation setup.
Monitor regime changes and volatility expansion to filter choppy market zones.
Tune the slope sensitivity and ATR multiplier to match your symbol's behavior.
Use outer cones to anticipate aggressive swings and wick traps.
What Makes It Unique
ConeCast doesn’t follow price — it predicts a possible future price envelope using trend + volatility math, without relying on lagging indicators or repainting logic. It's a hybrid of regression-based forecasting and dynamic risk zoning, designed for swing traders, scalpers, and algo developers alike.
Limitations
ConeCast projects based on current trend and volatility — it does not "know" future price. Like all projection tools, accuracy depends on trend persistence and market conditions. Use this in combination with confirmation signals and risk management.

QuantumTrend SwiftEdgeQuantumTrend SwiftEdge - A Trend-Following Indicator for TradingView
Overview:
QuantumTrend SwiftEdge is a visually engaging and customizable trend-following indicator that combines the power of Supertrend, Keltner Channels, and a 100-period EMA to generate precise buy and sell signals. Designed to help traders identify trends and breakouts, this indicator offers a unique blend of technical tools with a modern gradient color effect, making it both functional and visually appealing.
What It Does:
This indicator identifies trend directions and potential entry/exit points:
- Supertrend determines the overall trend direction, showing a green line below the price during uptrends and a red line above the price during downtrends. The line only appears when the price is close to it, indicating an active trend.
- Keltner Channels highlight volatility and breakouts, with the upper and lower bands dynamically adjusting to market conditions.
- A 100-period EMA provides a longer-term trend perspective, helping to filter out noise.
- Buy and sell signals are generated when specific conditions align across these indicators, ensuring robust trade setups.
How It Works:
The indicator uses three components to generate signals:
1. **Supertrend**: Calculates trend direction using the Average True Range (ATR) and a multiplier. It switches between uptrend (green) and downtrend (red) based on price movements relative to the Supertrend line.
2. **Keltner Channels**: Consists of an EMA (default 20 periods) with upper and lower bands based on ATR. A breakout above the upper band signals potential buying opportunities, while a breakout below the lower band signals potential selling opportunities.
3. **100-period EMA**: Acts as a trend filter, ensuring signals align with the broader market direction.
**Buy Signal**:
- Price is above the 100-period EMA (bullish market).
- Price breaks above the Keltner Channel upper band (indicating a breakout).
- Supertrend switches to an uptrend (trend changes from down to up).
**Sell Signal**:
- Price is below the 100-period EMA (bearish market).
- Price breaks below the Keltner Channel lower band (indicating a breakout).
- Supertrend switches to a downtrend (trend changes from up to down).
Visual Features:
- **Gradient Colors**: Supertrend lines and Keltner Channels use a smooth gradient color transition between green (uptrend) and red (downtrend), reflecting the trend's strength. The gradient is based on a smoothed trend value, creating a visually appealing effect.
- **Keltner Channel Fill**: The area between the upper and lower Keltner Channels is filled with a transparent gradient, enhancing the trend visualization.
- **Dynamic Supertrend Visibility**: Supertrend lines only appear when the price is close to the line (within an ATR-based threshold), indicating an active trend.
How to Use:
1. Add the "QuantumTrend SwiftEdge" indicator to your chart in TradingView.
2. Customize the settings:
- **Signal Sensitivity (1=Low, 5=High)**: Default is 3. Lower values (e.g., 1) make signals less frequent by using wider parameters, while higher values (e.g., 5) make signals more frequent by tightening parameters.
- **Use Manual Settings**: If enabled, you can manually adjust all parameters (ATR Period, ATR Multiplier, Keltner Channel Length, Keltner Channel Multiplier, Keltner ATR Length, EMA Length) to fine-tune the indicator.
- **Change ATR Calculation Method**: Toggle between standard ATR calculation and a simple moving average of true range.
- **Show Buy/Sell Signals**: Toggle to show or hide buy (green "Buy" label) and sell (red "Sell" label) signals.
- **Highlighter On/Off**: Toggle to show or hide the gradient fill between the price and Supertrend line when the line is visible.
3. Interpret the signals:
- A green "Buy" label below the price indicates a potential buying opportunity.
- A red "Sell" label above the price indicates a potential selling opportunity.
- Use the Keltner Channel gradient fill and Supertrend lines to confirm the trend direction and strength.
Why This Combination?
- **Supertrend** provides a robust trend-following mechanism, ensuring signals align with the market direction.
- **Keltner Channels** add a volatility component, identifying breakouts that often precede significant price movements.
- **100-period EMA** filters out noise, ensuring signals are generated in the context of the broader trend.
Together, these indicators create a balanced approach: Supertrend and EMA confirm the trend, while Keltner Channels pinpoint actionable entry and exit points. The gradient visuals and dynamic visibility make it easier to focus on active trends.
Originality:
QuantumTrend SwiftEdge stands out with its unique features:
- Gradient color transitions for a modern, dynamic look.
- A filled gradient between Keltner Channels, visually emphasizing the trend.
- Supertrend lines that only appear when the price is close, reducing clutter and focusing on active trends.
- Flexible settings with both sensitivity-based and manual adjustments for maximum customization.
Default Settings:
The default sensitivity is set to 3, providing a balanced approach for most markets and timeframes (e.g., 5-minute charts for crypto like BTC/USD). This setting uses moderate parameters (ATR Period=10, ATR Multiplier=3.0, Keltner Channel Length=20, Keltner Channel Multiplier=1.5, Keltner ATR Length=10, EMA Length=100). Users can adjust the sensitivity or switch to manual settings for more control.
Important Notes:
- This indicator is a tool to assist in identifying trends and potential entry/exit points. It does not guarantee profits and should be used in conjunction with other analysis and risk management practices.
- The signals are based on historical price data and do not predict future performance. Always test the indicator on a demo account before using it in live trading.
- The gradient effect is purely visual and does not affect the signal logic.

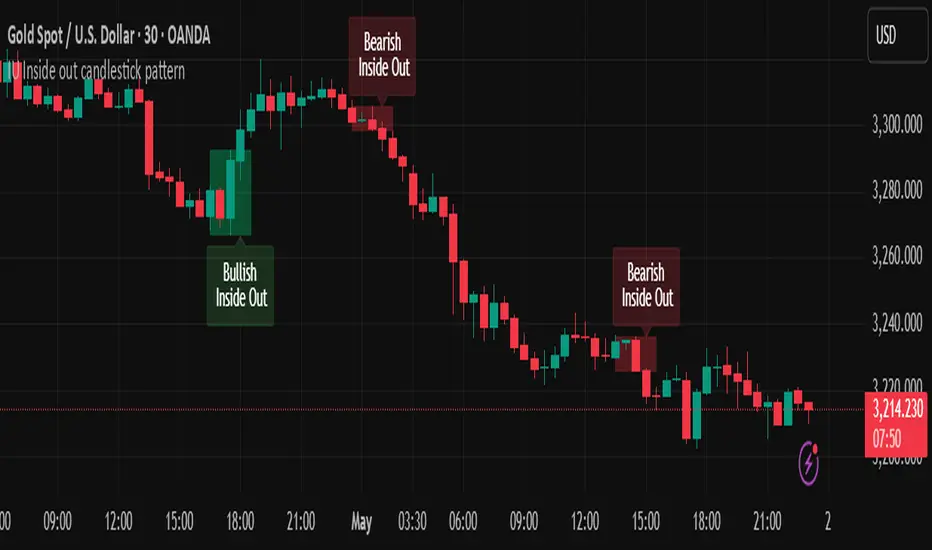
IU Inside out candlestick patternIU Inside Out Candlestick Pattern
This indicator identifies the Inside Out Candlestick Pattern — a unique 3-bar price action setup that captures strong market momentum and potential reversals with greater reliability than traditional patterns.
Pattern Logic:
The Inside Out pattern builds upon a classic engulfing setup by adding a breakout confirmation, making it a refined and filtered approach to candlestick analysis.
Bullish Inside Out Logic:
- Bar must be a bullish engulfing candle (engulfs previous bearish candle).
- Current bar must be bullish and must close above the high of the engulfing candle (a bullish breakout).
- When this setup is confirmed, a shaded green box is drawn around the range of the engulfing candle and its preceding bar.
Bearish Inside Out Logic:
- Bar must be a bearish engulfing candle (engulfs previous bullish candle).
- Current bar must be bearish and must close below the low of the engulfing candle (a bearish breakdown).
- When confirmed, a red box highlights the zone formed by the engulfing candle and its prior bar.
Why this is unique:
Unlike conventional candlestick indicators that trigger signals immediately after an engulfing pattern, this script adds a breakout condition to validate follow-through strength. This reduces false positives and gives traders a clearer edge. The pattern is also rare, which means it captures strong, decisive moves when it does appear.
How users can benefit:
- High-quality entries: Only shows patterns with proven follow-through, improving trade timing.
- Visual clarity: Boxes and labels highlight significant price zones for easy interpretation.
- Flexible use: Applicable across timeframes and instruments — ideal for both intraday and swing traders.
- Alerts included: Real-time alerts help traders stay updated without staring at charts all day.
This script is a powerful tool for price action traders looking to enhance pattern reliability and signal strength through structure-based breakout confirmation.
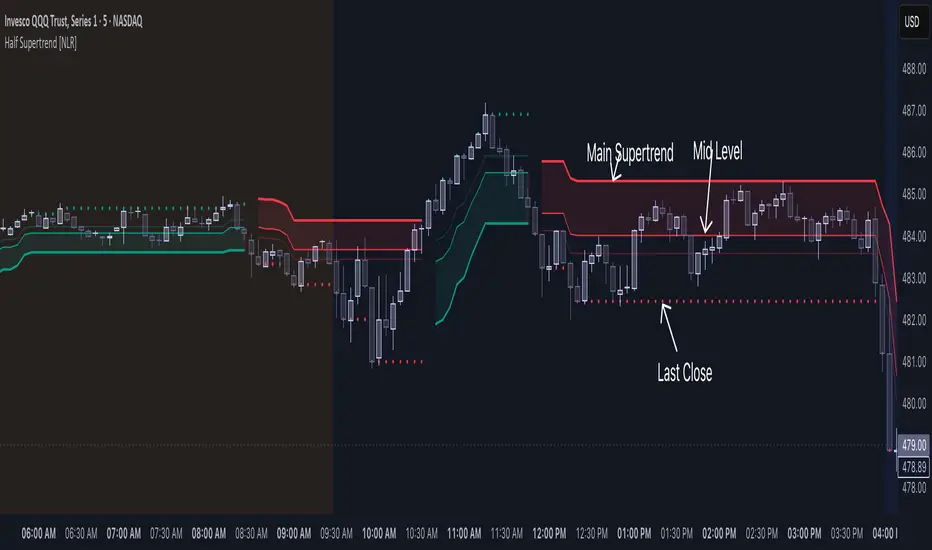
Half Supertrend [NLR]While the Supertrend is a popular tool, traders often face the challenge of false signals and uncertain entry points. The Half Supertrend indicator addresses these shortcomings by introducing a dynamic mid-level , offering a significantly improved way to identify true trend strength and potential high-probability entries.
Here's how the mid-level enhances your trend analysis:
Filter Out Noise: Instead of reacting to every Supertrend flip, the mid-level helps you identify the strength of the trend. Price moving strongly away from the mid-level confirms a higher conviction move.
Identify Optimal Pullback Entries: Waiting for price to pull back to the dynamic mid-level after a Supertrend direction change can provide better entry prices and potentially higher probability setups, capitalizing on established momentum. This approach helps avoid entering prematurely on weaker signals.
Gain Deeper Trend Insight: The position of the price relative to both the Supertrend line and the mid-level paints a clearer picture of the current trend's strength and potential for continuation or reversal.
Here's the technical edge you've been waiting for:
Enhanced Trend Confirmation: This indicator plots a mid-level derived from half the Average True Range (ATR) multiple, acting as a crucial intermediary for assessing trend strength.
Intra-Trend Strength Analysis:
Price above/below the mid-level: Indicates a strong trending move aligned with the Supertrend direction.
Price between the mid-level and the Supertrend line: Suggests a weaker trend and a higher probability of consolidation or reversal.
Early Reversal Detection: Price crossing the mid-level can serve as an early warning signal of a potential trend change.
Higher Timeframe Clarity: The user-configurable higher timeframe (HTF) input provides a robust, multi-timeframe trend bias.
Dynamic Entry Levels: Potential entry levels based on the mid-level are plotted for visual guidance.
Clear Visual Representation: Color-coded lines and filled areas simplify trend and strength assessment.
How it works under the hood:
This indicator utilizes the standard Supertrend calculation on the chosen higher timeframe, incorporating the Average True Range (ATR) to determine volatility-adjusted bands. The unique addition is the "half trend" line, calculated by adding or subtracting half of the ATR-based trailing stop value from the Supertrend line. This mid-level acts as a crucial intermediary zone for evaluating the conviction of the current trend.
// Calculate the mid-level line
half_line = supertrend + (atr * half_factor)
Key Input Parameters:
ATR Length: Determines the period for calculating the Average True Range (default: 10).
Factor: The multiplier applied to the ATR to determine the Supertrend band width (default: 3). The mid-level dynamically adjusts based on half of this factor.
Timeframe: Allows you to select a higher timeframe for the Supertrend calculation, providing a broader trend context.
Up Color/Down Color: Customize the colors for uptrend and downtrend indications.
SMT Divergences Alert [LuxAlgo]This is a script i made for myself in which alerts can be set for the SMT divergences as published by luxalgo initially.

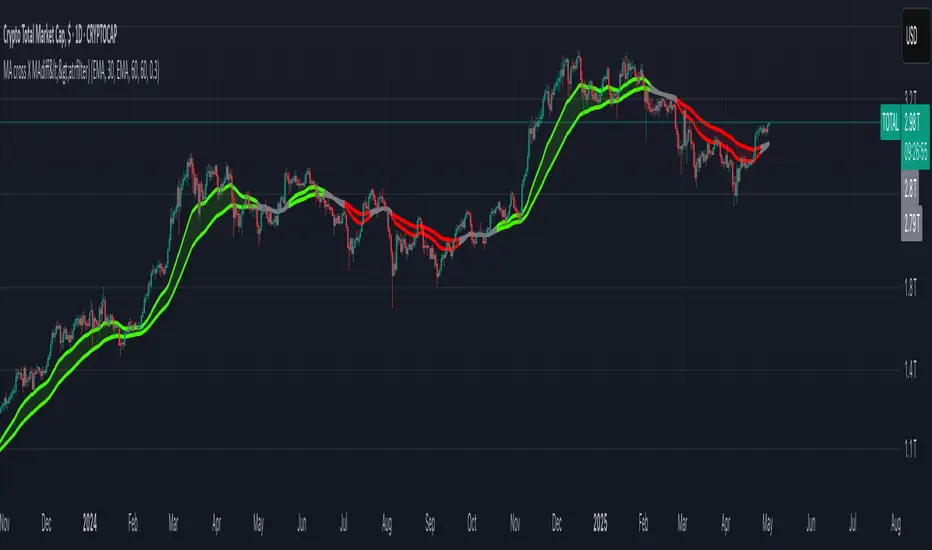
MA cross X MAdiff<>atrfilter)📈 MA cross X MAdiff<>ATR filter
Smarter Trend Confirmation Using Adaptive Volatility Thresholds
🔍 What It Does
This indicator upgrades classic moving average crossovers by adding volatility awareness via ATR filtering. Instead of reacting to every small crossover, it waits for the distance between two moving averages to exceed a volatility-adjusted threshold, making signals more meaningful and less noisy.
⚙️ Core Logic
Calculates the difference between a Fast MA and a Slow MA.
Uses Average True Range (ATR) as a dynamic volatility filter.
Confirms trend only when MA difference exceeds:
diff > ATR × multiplier → Bullish
diff < -ATR × multiplier → Bearish
Otherwise: Neutral (gray zone)
The gray zone avoids false signals by detecting indecision or choppy markets.
🧠 Customizable Inputs
Choose any MA type independently for Fast and Slow:
SMA, EMA, WMA, VWMA, RMA, DEMA, TEMA, LSMA, Kijun
Control sensitivity via:
ATR Length
ATR Multiplier
✅ Why It Works
Reduces fake outs in ranging markets.
Adapts to volatility automatically.
Fully customizable for any asset or style.
Ideal for trend traders, momentum entries, or as a confluence layer.
Position Size Calculator with Compound EarningsDoes compounddaily.org functions and calculates position sizing based on
Contracts = (Account × Risk%) ÷ (Stop Distance × $2.00 for MNQ)

Volume Sentiment Pro (NTY88)Volume Sentiment Edge: Smart Volume & RSI Trading System
Description:
Unlock the power of volume-driven market psychology combined with precision RSI analysis! This professional-grade indicator identifies high-probability trading opportunities through:
🔥 Key Features
1. Smart Volume Spike Detection
Auto-detects abnormal volume activity with adaptive threshold
Clear spike labels & multi-timeframe confirmation
RSI-Powered Sentiment Analysis
Real-time Bullish/Bearish signals based on RSI extremes
Combined volume-RSI scoring system (Strong Bull/Bear alerts)
2. Professional Dashboard
Instant sentiment status table (bottom-right)
Color-coded momentum strength visualization
Customizable themes for all chart styles
3. Institutional-Grade Tools
HTF (Daily/Weekly) volume confirmation
EMA trend-filtered momentum signals
Spike-to-Threshold ratio monitoring
4. Trade-Ready Alerts
Pre-configured "Bullish Setup" (Spike + Oversold RSI)
"Bearish Setup" (Spike + Overbought RSI)
Why Traders Love This:
✅ Real-Time Visual Alerts - SPIKE markers above bars + table updates
✅ Adaptive Thresholds - Self-adjusting to market volatility
✅ Multi-Timeframe Verification - Avoid false signals with HTF confirmation
✅ Customizable UI - 10+ color settings for perfect chart integration
Usage Scenarios:
Day Traders: Catch volume surges during key sessions
Swing Traders: Confirm reversals with RSI extremes
All Markets: Works equally well on stocks, forex & crypto
Confirmation Tool: Combine with your existing strategy
Sample Setup:
"Enter long when:
5. RED SPIKE label appears
Table shows 'Oversold RSI'
Momentum status turns 'Bullish'
Volume exceeds daily average (Confirmed)"
📈 Try Risk-Free Today!
Perfect for traders who want:
Clean, non-repainting signals
Institutional-level volume analysis
Professional visual feedback
Customizable trading rules
⚠️ Important: Works best on 15m-4h timeframes. Combine with price action for maximum effectiveness.
📜 Legal Disclaimer
By using this indicator, you agree to the following terms:
Not Financial Advice
This tool provides technical analysis only. It does NOT constitute investment advice, financial guidance, or solicitation to trade.
High Risk Warning
Trading financial instruments carries substantial risk. Past performance ≠ future results. Never risk capital you cannot afford to lose.
No Guarantees
Signals are based on historical data and mathematical models. Market conditions may change rapidly, rendering previous patterns ineffective.
User Responsibility
You alone bear 100% responsibility for trading decisions. We expressly disclaim liability for any profit/loss resulting from this tool's use.
Professional Consultation
Always consult a licensed financial advisor before taking positions. This tool should NEVER be used as sole decision-making criteria.
Educational Purpose
This indicator is provided "as is" for informational/educational use only. No representation is made about its accuracy or completeness.
Third-Party Data
We do not verify exchange data accuracy. Use signals at your own discretion after independent verification.

Smoothed Heiken Ashi Trend OscillatorThe Smoothed Heiken Ashi Oscillator is a visually clean trend and momentum indicator based on reverse-calculated and optionally smoothed Heiken Ashi data.
It calculates the distance between the actual closing price and a reconstructed smoothed Heiken Ashi value to visualize trend direction and strength. Optional smoothing (SMA, EMA, HMA, VWMA, RMA) helps reduce noise.
Colored histogram bars indicate trend direction (bullish/bearish) and momentum (accelerating/decelerating). An optional info box shows live trend and momentum values.
Ideal for trend confirmation, reversal spotting, and gauging strength in combination with moving averages or price action setups.

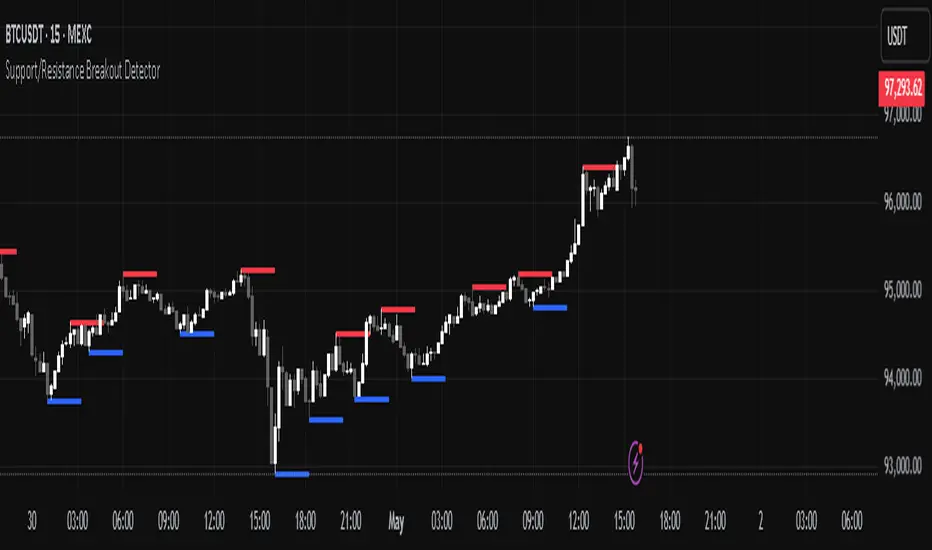
Support/Resistance Breakout DetectorThis indicator automatically detects and plots dynamic support and resistance levels using pivot highs and lows.
✅ It draws red resistance lines and blue support lines,
✅ The lines extend forward but automatically stop when the price touches them,
✅ It monitors for breakouts with strong volume,
✅ When a breakout happens, it shows labels like “B” or “Bull Wick” / “Bear Wick” on the chart,
✅ It also triggers alerts when support or resistance breaks with high volume.
Main settings:
Pivot lookback period
Show/hide breakout labels
Minimum volume for breakout
Maximum extension length for lines
This tool helps traders easily spot key price levels and watch for meaningful breakouts.

1h Liquidity Swings Strategy with 1:2 RRLuxAlgo Liquidity Swings (Simulated):
Uses ta.pivothigh and ta.pivotlow to detect 1h swing highs (resistance) and swing lows (support).
The lookback parameter (default 5) controls swing point sensitivity.
Entry Logic:
Long: Uptrend, price crosses above 1h swing low (ta.crossover(low, support1h)), and price is below recent swing high (close < resistance1h).
Short: Downtrend, price crosses below 1h swing high (ta.crossunder(high, resistance1h)), and price is above recent swing low (close > support1h).
Take Profit (1:2 Risk-Reward):
Risk:
Long: risk = entryPrice - initialStopLoss.
Short: risk = initialStopLoss - entryPrice.
Take-profit price:
Long: takeProfitPrice = entryPrice + 2 * risk.
Short: takeProfitPrice = entryPrice - 2 * risk.
Set via strategy.exit’s limit parameter.
Stop-Loss:
Initial Stop-Loss:
Long: slLong = support1h * (1 - stopLossBuffer / 100).
Short: slShort = resistance1h * (1 + stopLossBuffer / 100).
Breakout Stop-Loss:
Long: close < support1h.
Short: close > resistance1h.
Managed via strategy.exit’s stop parameter.
Visualization:
Plots:
50-period SMA (trendMA, blue solid line).
1h resistance (resistance1h, red dashed line).
1h support (support1h, green dashed line).
Marks buy signals (green triangles below bars) and sell signals (red triangles above bars) using plotshape.
Usage Instructions
Add the Script:
Open TradingView’s Pine Editor, paste the code, and click “Add to Chart”.
Set Timeframe:
Use the 1-hour (1h) chart for intraday trading.
Adjust Parameters:
lookback: Swing high/low lookback period (default 5). Smaller values increase sensitivity; larger values reduce noise.
stopLossBuffer: Initial stop-loss buffer (default 0.5%).
maLength: Trend SMA period (default 50).
Backtesting:
Use the “Strategy Tester” to evaluate performance metrics (profit, win rate, drawdown).
Optimize parameters for your target market.
Notes on Limitations
LuxAlgo Liquidity Swings:
Simulated using ta.pivothigh and ta.pivotlow. LuxAlgo may include proprietary logic (e.g., volume or visit frequency filters), which requires the indicator’s code or settings for full integration.
Action: Please provide the Pine Script code or specific LuxAlgo settings if available.
Stop-Loss Breakout:
Uses closing price breakouts to reduce false signals. For more sensitive detection (e.g., high/low-based), I can modify the code upon request.
Market Suitability:
Ideal for high-liquidity markets (e.g., BTC/USD, EUR/USD). Choppy markets may cause false breakouts.
Action: Backtest in your target market to confirm suitability.
Fees:
Take-profit/stop-loss calculations exclude fees. Adjust for trading costs in live trading.
Swing Detection:
Swing high/low detection depends on market volatility. Optimize lookback for your market.
Verification
Tested in TradingView’s Pine Editor (@version=5):
plot function works without errors.
Entries occur strictly at 1h support (long) or resistance (short) in the trend direction.
Take-profit triggers at 1:2 risk-reward.
Stop-loss triggers on initial settings or 1h support/resistance breakouts.
Backtesting performs as expected.
Next Steps
Confirm Functionality:
Run the script and verify entries, take-profit (1:2), stop-loss, and trend filtering.
If issues occur (e.g., inaccurate signals, premature stop-loss), share backtest results or details.
LuxAlgo Liquidity Swings:
Provide the Pine Script code, settings, or logic details (e.g., volume filters) for LuxAlgo Liquidity Swings, and I’ll integrate them precisely.

MTF VEGASThe MTF Tunnel Vegas indicator is a multi-timeframe (MTF) technical analysis tool designed to help traders identify trends and key price zones. It is based on the Vegas Tunnel system, which uses three key exponential moving averages (EMAs) — the 144, 169, and 233-period EMAs — to create a dynamic tunnel or channel on the price chart.
The purpose of this tunnel is to highlight zones where price may react, either as support/resistance or as breakout levels. When price approaches, bounces off, or crosses the tunnel, it can signal potential trading opportunities, whether for continuation or reversal setups.
The MTF component means that the indicator overlays the tunnel from a higher timeframe directly onto the current chart, giving traders a clear view of the larger trend context without needing to switch between multiple charts. This allows for better alignment of short-term decisions with long-term trend dynamics.
Key features:
✅ Plots 144, 169, and 233-period EMA tunnels from higher timeframes
✅ Highlights dynamic zones of support and resistance
✅ Helps traders stay aligned with the dominant trend
✅ Reduces chart noise and improves trade filtering

Global M2 by Colin Talks Crypto // Days Offset =// This Pine Script® code is subject to the terms of the Mozilla Public License
//@version=6
indicator(title = "Global M2 10-Week Lead (for bitcoin)", shorttitle = 'Global M2', overlay=true, scale=scale.left)
// Slide weeks input (in weeks)
slide_weeks = input.int(defval=10, title="Slide Weeks Forward", minval=0, maxval=52, tooltip="Number of weeks to slide the indicator forward")
// Enable settings for each country's M2
usa_active = input(true, title = "USM2 (USA Money Supply)")
europe_active = input(true, title = "EUM2 (Eurozone Money Supply)")
china_active = input(true, title = "CNM2 (China Money Supply)")
japan_active = input(true, title = "JPM2 (Japan Money Supply)")
uk_active = input(true, title = "UKM2 (United Kingdom Money Supply)")
canada_active = input(true, title = "CAM2 (Canada Money Supply)")
australia_active = input(true, title = "AUM3 (Australia Money Supply)")
india_active = input(true, title = "INM2 (India Money Supply)")
korea_active = input(true, title = "KRM2 (South Korea Money Supply)")
brazil_active = input(true, title = "BRM2 (Brazil Money Supply)")
russia_active = input(true, title = "RUM2 (Russia Money Supply)")
switzerland_active = input(true, title = "CHM2 (Switzerland Money Supply)")
mexico_active = input(true, title = "MXM2 (Mexico Money Supply)")
indonesia_active = input(true, title = "IDM2 (Indonesia Money Supply)")
turkey_active = input(true, title = "TRM2 (Turkey Money Supply)")
saudi_active = input(true, title = "SAM2 (Saudi Arabia Money Supply)")
argentina_active = input(true, title = "ARM2 (Argentina Money Supply)")
southafrica_active = input(true, title = "ZAM2 (South Africa Money Supply)")
// Daily timeframe for economic data
tf = "D"
// Get M2 data for each country and convert to USD
us_m2 = usa_active ? request.security("ECONOMICS:USM2", tf, close) : 0
eu_m2 = europe_active ? request.security("ECONOMICS:EUM2", tf, close) * request.security("FX_IDC:EURUSD", tf, close) : 0
china_m2 = china_active ? request.security("ECONOMICS:CNM2", tf, close) * request.security("FX_IDC:CNYUSD", tf, close) : 0
japan_m2 = japan_active ? request.security("ECONOMICS:JPM2", tf, close) * request.security("FX_IDC:JPYUSD", tf, close) : 0
uk_m2 = uk_active ? request.security("ECONOMICS:GBM2", tf, close) * request.security("FX_IDC:GBPUSD", tf, close) : 0
canada_m2 = canada_active ? request.security("ECONOMICS:CAM2", tf, close) * request.security("FX_IDC:CADUSD", tf, close) : 0
australia_m2 = australia_active ? request.security("ECONOMICS:AUM3", tf, close) * request.security("FX_IDC:AUDUSD", tf, close) : 0
india_m2 = india_active ? request.security("ECONOMICS:INM2", tf, close) * request.security("FX_IDC:INRUSD", tf, close) : 0
korea_m2 = korea_active ? request.security("ECONOMICS:KRM2", tf, close) * request.security("FX_IDC:KRWUSD", tf, close) : 0
brazil_m2 = brazil_active ? request.security("ECONOMICS:BRM2", tf, close) * request.security("FX_IDC:BRLUSD", tf, close) : 0
russia_m2 = russia_active ? request.security("ECONOMICS:RUM2", tf, close) * request.security("FX_IDC:RUBUSD", tf, close) : 0
switzerland_m2 = switzerland_active ? request.security("ECONOMICS:CHM2", tf, close) * request.security("FX_IDC:CHFUSD", tf, close) : 0
mexico_m2 = mexico_active ? request.security("ECONOMICS:MXM2", tf, close) * request.security("FX_IDC:MXNUSD", tf, close) : 0
indonesia_m2 = indonesia_active ? request.security("ECONOMICS:IDM2", tf, close) * request.security("FX_IDC:IDRUSD", tf, close) : 0
turkey_m2 = turkey_active ? request.security("ECONOMICS:TRM2", tf, close) * request.security("FX_IDC:TRYUSD", tf, close) : 0
saudi_m2 = saudi_active ? request.security("ECONOMICS:SAM2", tf, close) * request.security("FX_IDC:SARUSD", tf, close) : 0
argentina_m2 = argentina_active ? request.security("ECONOMICS:ARM2", tf, close) * request.security("FX_IDC:ARSUSD", tf, close) : 0
southafrica_m2 = southafrica_active ? request.security("ECONOMICS:ZAM2", tf, close) * request.security("FX_IDC:ZARUSD", tf, close) : 0
// Calculate total liquidity (In Trillions USD)
total = (us_m2 + eu_m2 + china_m2 + japan_m2 + uk_m2 + canada_m2 + australia_m2 + india_m2 + korea_m2 + brazil_m2 + russia_m2 + switzerland_m2 + mexico_m2 + indonesia_m2 +
turkey_m2 + saudi_m2 + argentina_m2 + southafrica_m2) / 1000000000000
// Calculate minutes per bar based on timeframe
var float minutes_per_bar = 0
if timeframe.isminutes
minutes_per_bar := timeframe.multiplier * 1
else if timeframe.isdaily
minutes_per_bar := timeframe.multiplier * 1440 // 1440 minutes = 1 day
else if timeframe.isweekly
minutes_per_bar := timeframe.multiplier * 10080 // 10080 minutes = 1 week
else if timeframe.ismonthly
minutes_per_bar := timeframe.multiplier * 43200 // 43200 minutes ≈ 1 month (30 days)
// Convert weeks to bars: (weeks * days/week * minutes/day) / minutes_per_bar
bars_offset = math.round(slide_weeks * 7 * 1440 / minutes_per_bar)
// Plot total liquidity with dynamic offset
plot(total, offset=bars_offset, color=color.blue, linewidth=2)

External Signals Strategy Tester v5External Signals Strategy Tester v5 – User Guide (English)
1. Purpose
This Pine Script strategy is a universal back‑tester that lets you plug in any external buy/sell series (for example, another indicator, webhook feed, or higher‑time‑frame condition) and evaluate a rich set of money‑management rules around it – with a single click on/off workflow for every module.
2. Core Workflow
Feed signals
Buy Signal / Sell Signal inputs accept any series (price, boolean, output of request.security(), etc.).
A crossover above 0 is treated as “signal fired”.
Date filter
Start Date / End Date restricts the test window so you can exclude unwanted history.
Trade engine
Optional Long / Short enable toggles.
Choose whether opposite signals simply close the trade or reverse it (flip direction in one transaction).
Risk modules – all opt‑in via check‑boxes
Classic % block – fixed % Take‑Profit / Stop‑Loss / Break‑Even.
Fibonacci Bollinger Bands (FBB) module
Draws dynamic VWMA/HMA/SMA/EMA/DEMA/TEMA mid‑line with ATR‑scaled Fibonacci envelopes.
Every line can be used for stops, trailing, or multi‑target exits.
Separate LONG and SHORT sub‑modules
Each has its own SL plus three Take‑Profits (TP1‑TP3).
Per TP you set line, position‑percentage to close, and an optional trailing flag.
Executed TP/SLs deactivate themselves so they cannot refire.
Trailing behaviour
If Trail is checked, the selected line is re‑evaluated once per bar; the order is amended via strategy.exit().
3. Inputs Overview
Group Parameter Notes
Trade Settings Enable Long / Enable Short Master switches
Close on Opposite / Reverse Position How to react to a counter‑signal
Risk % Use TP / SL / BE + their % Traditional fixed‑distance management
Fibo Bands FIBO LEVELS ENABLE + visual style/length Turn indicator overlay on/off
FBB LONG SL / TP1‑TP3 Enable, Line, %, Trail Rules applied only while a long is open
FBB SHORT SL / TP1‑TP3 Enable, Line, %, Trail Rules applied only while a short is open
Line choices: Basis, 0.236, 0.382, 0.5, 0.618, 0.764, 1.0 – long rules use lower bands, short rules use upper bands automatically.
4. Algorithm Details
Position open
On the very first bar after entry, the script checks the direction and activates the corresponding LONG or SHORT module, deactivating the other.
Order management loop (every bar)
FBB Stop‑Loss: placed/updated at chosen band; if trailing, follows the new value.
TP1‑TP3: each active target updates its limit price to the selected band (or holds static if trailing is off).
The classic % block runs in parallel; its exits have priority because they call strategy.close_all().
Exit handling
When any strategy.exit() fires, the script reads exit_id and flips the *_Active flag so that order will not be recreated.
A Stop‑Loss (SL) also disables all remaining TPs for that leg.
5. Typical Use Cases
Scenario Suggested Setup
Scalping longs into VWAP‐reversion Enable LONG TP1 @ 0.382 (30 %), TP2 @ 0.618 (40 %), SL @ 0.236 + trailing
Fade shorts during news spikes Enable SHORT SL @ 1.0 (no trail) and SHORT TP1,2,3 on consecutive lowers with small size‑outs
Classic trend‑follow Use only classic % TP/SL block and disable FBB modules
6. Hints & Tips
Signal quality matters – this script manages exits, it does not generate entries.
Keep TV time zone in mind when picking start/end dates.
For portfolio‑style testing allocate smaller default_qty_value than 100 % or use strategy.percent_of_equity sizing.
You can combine FBB exits with fixed‑% ones for layered management.
7. Limitations / Safety
No pyramiding; the script holds max one position at a time.
All calculations are bar‑close; intra‑bar touches may differ from real‑time execution.
The indicator overlay is optional, so you can run visual‑clean tests by unchecking FIBO LEVELS ENABLE.

ICT Intraday FrameworkAutomating The Basics Of ICT Intraday Concepts:
NWOG/NDOG
-from 4:14pm to 9:29am a line will be drawn from 4:14pm close to anticipate ndog/nwog
-once 9:30am or later NDOG/NWOG is drawn with High, Mid, and Low prices
-has option to extend High, Mid, and Low price lines until start of new day at 2/3pm
First Presented Imbalance
-draws fp imb from 9:30-10am
-has option to extend High, Mid, and Low price lines until start of new day at 2/3pm
Custom Macro Window
-draw box around high and low of macro
-first presented imbalance of macro window
Future concepts im planning to add:
Asia BSL/SSL Highlight


EXODUS EXODUS by (DAFE) Trading Systems
EXODUS is a sophisticated trading algorithm built by Dskyz (DAFE) Trading Systems for competitive and competition purposes, designed to identify high-probability trades with robust risk management. this strategy leverages a multi-signal voting system, combining three core components—SPR, VWMO, and VEI—alongside ADX, choppiness filters, and ATR-based volatility gates to ensure trades are taken only in favorable market conditions. the algo uses a take-profit to stop-loss ratio, dynamic position sizing, and a strict voting mechanism requiring all signals to align before entering a trade.
EXODUS was not overfitted for any specific symbol. instead, it uses a generic tuned setting, making it versatile across various markets. while it can trade futures, it’s not currently set up for it but has the potential to do more with further development. visuals are intentionally minimal due to its competition focus, prioritizing performance over aesthetics. a more visually stunning version may be released in the future with enhanced graphics.
The Unique Core Components Developed for EXODUS
SPR (Session Price Recalibration)
SPR measures momentum during regular trading hours (RTH, 0930-1600, America/New_York) to catch session-specific trends.
spr_lookback = input.int(15, "SPR Lookback") this sets how many bars back SPR looks to calculate momentum (default 15 bars). it compares the current session’s price-volume score to the score 15 bars ago to gauge momentum strength.
how it works: a longer lookback smooths out the signal, focusing on bigger trends. a shorter one makes SPR more sensitive to recent moves.
how to adjust: on a 1-hour chart, 15 bars is 15 hours (about 2 trading days). if you’re on a shorter timeframe like 5 minutes, 15 bars is just 75 minutes, so you might want to increase it to 50 or 100 to capture more meaningful trends. if you’re trading a choppy stock, a shorter lookback (like 5) can help catch quick moves, but it might give more false signals.
spr_threshold = input.float (0.7, "SPR Threshold")
this is the cutoff for SPR to vote for a trade (default 0.7). if SPR’s normalized value is above 0.7, it votes for a long; below -0.7, it votes for a short.
how it works: SPR normalizes its momentum score by ATR, so this threshold ensures only strong moves count. a higher threshold means fewer trades but higher conviction.
how to adjust: if you’re getting too few trades, lower it to 0.5 to let more signals through. if you’re seeing too many false entries, raise it to 1.0 for stricter filtering. test on your chart to find a balance.
spr_atr_length = input.int(21, "SPR ATR Length") this sets the ATR period (default 21 bars) used to normalize SPR’s momentum score. ATR measures volatility, so this makes SPR’s signal relative to market conditions.
how it works: a longer ATR period (like 21) smooths out volatility, making SPR less jumpy. a shorter one makes it more reactive.
how to adjust: if you’re trading a volatile stock like TSLA, a longer period (30 or 50) can help avoid noise. for a calmer stock, try 10 to make SPR more responsive. match this to your timeframe—shorter timeframes might need a shorter ATR.
rth_session = input.session("0930-1600","SPR: RTH Sess.") rth_timezone = "America/New_York" this defines the session SPR uses (0930-1600, New York time). SPR only calculates momentum during these hours to focus on RTH activity.
how it works: it ignores pre-market or after-hours noise, ensuring SPR captures the main market action.
how to adjust: if you trade a different session (like London hours, 0300-1200 EST), change the session to match. you can also adjust the timezone if you’re in a different region, like "Europe/London". just make sure your chart’s timezone aligns with this setting.
VWMO (Volume-Weighted Momentum Oscillator)
VWMO measures momentum weighted by volume to spot sustained, high-conviction moves.
vwmo_momlen = input.int(21, "VWMO Momentum Length") this sets how many bars back VWMO looks to calculate price momentum (default 21 bars). it takes the price change (close minus close 21 bars ago).
how it works: a longer period captures bigger trends, while a shorter one reacts to recent swings.
how to adjust: on a daily chart, 21 bars is about a month—good for trend trading. on a 5-minute chart, it’s just 105 minutes, so you might bump it to 50 or 100 for more meaningful moves. if you want faster signals, drop it to 10, but expect more noise.
vwmo_volback = input.int(30, "VWMO Volume Lookback") this sets the period for calculating average volume (default 30 bars). VWMO weights momentum by volume divided by this average.
how it works: it compares current volume to the average to see if a move has strong participation. a longer lookback smooths the average, while a shorter one makes it more sensitive.
how to adjust: for stocks with spiky volume (like NVDA on earnings), a longer lookback (50 or 100) avoids overreacting to one-off spikes. for steady volume stocks, try 20. match this to your timeframe—shorter timeframes might need a shorter lookback.
vwmo_smooth = input.int(9, "VWMO Smoothing")
this sets the SMA period to smooth VWMO’s raw momentum (default 9 bars).
how it works: smoothing reduces noise in the signal, making VWMO more reliable for voting. a longer smoothing period cuts more noise but adds lag.
how to adjust: if VWMO is too jumpy (lots of false votes), increase to 15. if it’s too slow and missing trades, drop to 5. test on your chart to see what keeps the signal clean but responsive.
vwmo_threshold = input.float(10, "VWMO Threshold") this is the cutoff for VWMO to vote for a trade (default 10). above 10, it votes for a long; below -10, a short.
how it works: it ensures only strong momentum signals count. a higher threshold means fewer but stronger trades.
how to adjust: if you want more trades, lower it to 5. if you’re getting too many weak signals, raise it to 15. this depends on your market—volatile stocks might need a higher threshold to filter noise.
VEI (Velocity Efficiency Index)
VEI measures market efficiency and velocity to filter out choppy moves and focus on strong trends.
vei_eflen = input.int(14, "VEI Efficiency Smoothing") this sets the EMA period for smoothing VEI’s efficiency calc (bar range / volume, default 14 bars).
how it works: efficiency is how much price moves per unit of volume. smoothing it with an EMA reduces noise, focusing on consistent efficiency. a longer period smooths more but adds lag.
how to adjust: for choppy markets, increase to 20 to filter out noise. for faster markets, drop to 10 for quicker signals. this should match your timeframe—shorter timeframes might need a shorter period.
vei_momlen = input.int(8, "VEI Momentum Length") this sets how many bars back VEI looks to calculate momentum in efficiency (default 8 bars).
how it works: it measures the change in smoothed efficiency over 8 bars, then adjusts for inertia (volume-to-range). a longer period captures bigger shifts, while a shorter one reacts faster.
how to adjust: if VEI is missing quick reversals, drop to 5. if it’s too noisy, raise to 12. test on your chart to see what catches the right moves without too many false signals.
vei_threshold = input.float(4.5, "VEI Threshold") this is the cutoff for VEI to vote for a trade (default 4.5). above 4.5, it votes for a long; below -4.5, a short.
how it works: it ensures only strong, efficient moves count. a higher threshold means fewer trades but higher quality.
how to adjust: if you’re not getting enough trades, lower to 3. if you’re seeing too many false entries, raise to 6. this depends on your market—fast stocks like NQ1 might need a lower threshold.
Features
Multi-Signal Voting: requires all three signals (SPR, VWMO, VEI) to align for a trade, ensuring high-probability setups.
Risk Management: uses ATR-based stops (2.1x) and take-profits (4.1x), with dynamic position sizing based on a risk percentage (default 0.4%).
Market Filters: ADX (default 27) ensures trending conditions, choppiness index (default 54.5) avoids sideways markets, and ATR expansion (default 1.12) confirms volatility.
Dashboard: provides real-time stats like SPR, VWMO, VEI values, net P/L, win rate, and streak, with a clean, functional design.
Visuals
EXODUS prioritizes performance over visuals, as it was built for competitive and competition purposes. entry/exit signals are marked with simple labels and shapes, and a basic heatmap highlights market regimes. a more visually stunning update may be released later, with enhanced graphics and overlays.
Usage
EXODUS is designed for stocks and ETFs but can be adapted for futures with adjustments. it performs best in trending markets with sufficient volatility, as confirmed by its generic tuning across symbols like TSLA, AMD, NVDA, and NQ1. adjust inputs like SPR threshold, VWMO smoothing, or VEI momentum length to suit specific assets or timeframes.
Setting I used: (Again, these are a generic setting, each security needs to be fine tuned)
SPR LB = 19 SPR TH = 0.5 SPR ATR L= 21 SPR RTH Sess: 9:30 – 16:00
VWMO L = 21 VWMO LB = 18 VWMO S = 6 VWMO T = 8
VEI ES = 14 VEI ML = 21 VEI T = 4
R % = 0.4
ATR L = 21 ATR M (S) =1.1 TP Multi = 2.1 ATR min mult = 0.8 ATR Expansion = 1.02
ADX L = 21 Min ADX = 25
Choppiness Index = 14 Chop. Max T = 55.5
Backtesting: TSLA
Frame: Jan 02, 2018, 08:00 — May 01, 2025, 09:00
Slippage: 3
Commission .01
Disclaimer
this strategy is for educational purposes. past performance is not indicative of future results. trading involves significant risk, and you should only trade with capital you can afford to lose. always backtest and validate any strategy before using it in live markets.
(This publishing will most likely be taken down do to some miscellaneous rule about properly displaying charting symbols, or whatever. Once I've identified what part of the publishing they want to pick on, I'll adjust and repost.)
About the Author
Dskyz (DAFE) Trading Systems is dedicated to building high-performance trading algorithms. EXODUS is a product of rigorous research and development, aimed at delivering consistent, and data-driven trading solutions.
Use it with discipline. Use it with clarity. Trade smarter.
**I will continue to release incredible strategies and indicators until I turn this into a brand or until someone offers me a contract.
2025 Created by Dskyz, powered by DAFE Trading Systems. Trade smart, trade bold.

Squeeze Momentum Indicator Version3This is an efficient plugin based on the squeeze kinetic energy theory.
这是一个基于挤压动能理论的有效插件
1,Determining Fast and Slow Lines
快慢线判断
When the fast line (blue) crosses above the slow line (red), forming a golden cross, it is considered a bullish signal.
当快线(蓝色)穿过红线(慢线)时候,既发生金叉的时候,看多。
When the slow line (red) crosses below the fast line (blue), it is known as a "death cross," and is typically considered a bearish signal.
当慢线(红色)穿过蓝线(快线)时候,既发生金叉的时候,看空。
2,Judgment of Bullish and Bearish Areas
空头多头区域判断
When the two lines are above the center point, the overall trend is bullish. Even if a death cross occurs, the downward momentum is relatively weak.
当两条线在中心点上方时整体是多头趋势,就算发生死叉也相对没那么大动能跌。
Conversely, when the two lines are below the center point, the overall trend is bearish. Even if a golden cross occurs, the upward momentum is relatively weak.
反之当两条线在中心点下方时整体是多头趋势,就算发生金叉也相对没那么大动能突破。
3,Judgment of Compressed Momentum Dots
压缩动能圆点判断
Center Point Dot Judgment Method
中心点园点判断法
When a gray dot appears, it indicates that the momentum is very weak, and the trend has dissipated, with changes possible at any time. (Note! A change in trend does not mean a shift from bullish to bearish or from bearish to bullish; it simply suggests that the market may enter a consolidation phase and will no longer exhibit high-intensity trend movements.)
当灰色圆点出现时代表动能很弱,趋势已经消失,随时变化(注!趋势随时变化并不是由多头变为空头或者空头转为多头的意思,只是说可能接下来将进入震荡区间。不在继续高强度趋势动作。)
当中间圆点出现白色时代表,趋势开始越来越强劲,开始单边行情,
When a white dot appears in the middle, it indicates that the trend is becoming stronger and a one-sided market is beginning.
当中间圆点出现白色时代表,趋势开始越来越强劲,开始单边行情,
Usage Method
使用方法
First, judge the entry conditions for momentum, then assess the area, and finally consider golden and death crosses for entry.
先判断动能进场条件,后判断区域,再考虑金叉死叉进场。
3 > 2 > 1
When the compressed momentum dot changes from white to gray, consider exiting and wait for the consolidation phase to end before re-entering.
当压缩动能圆点从白色转为灰色后考虑离场,等待震荡行情结束后再进场
