seekho roj kamao 3 **Seekho Roj Kamao** is a powerful trend continuation indicator designed to enhance your trading strategy with precise entry and exit signals. It combines the strength of RSI, CMO, and MACD to identify momentum shifts, while ATR-based trailing stops help manage risk effectively. The indicator dynamically plots buy/sell signals on the chart, along with clearly labeled take profit and stop loss levels. Whether you're a beginner or an experienced trader, this tool offers a structured and disciplined approach to trading trends. Seekho Roj Kamao empowers you to make informed decisions and aim for consistent profits in volatile market conditions.
Indicators and strategies


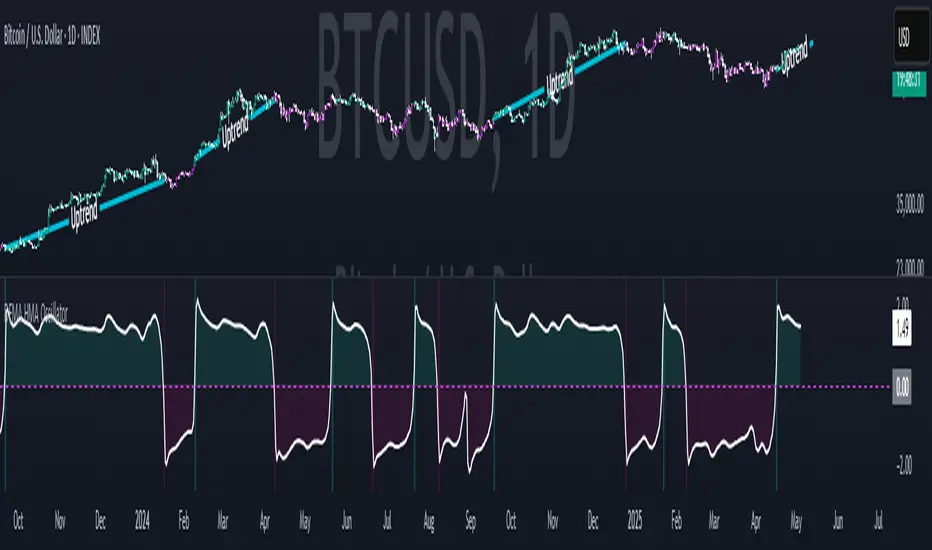
DEMA HMA Z-score OscillatorThis custom oscillator combines the power of the Hull Moving Average (HMA) with the Z-Score to identify momentum shifts and potential trend reversals. The Z-Score measures how far the current HMA is from its historical mean, helping to spot overbought or oversold conditions.
Uptrend: Long signals are generated when the Z-Score crosses above the defined Long Threshold.
Downtrend: Short signals are triggered when the Z-Score drops below the Short Threshold.
Visuals: The Z-Score is plotted along with background color changes and fills to clearly indicate trend strength. Green fills highlight uptrends, while pink fills indicate downtrends.
Alerts: Alerts are available for both long and short conditions based on Z-Score crossovers.
Customizable Inputs:
HMA Length
Smoothing Length (for DEMA)
Z-Score Length
Long and Short Thresholds
This indicator is ideal for detecting momentum shifts, confirming trend strength, and helping to time entry/exit points in your trading strategy.
Parameter Free RSI [InvestorUnknown]The Parameter Free RSI (PF-RSI) is an innovative adaptation of the traditional Relative Strength Index (RSI), a widely used momentum oscillator that measures the speed and change of price movements. Unlike the standard RSI, which relies on a fixed lookback period (typically 14), the PF-RSI dynamically adjusts its calculation length based on real-time market conditions. By incorporating volatility and the RSI's deviation from its midpoint (50), this indicator aims to provide a more responsive and adaptable tool for identifying overbought/oversold conditions, trend shifts, and momentum changes. This adaptability makes it particularly valuable for traders navigating diverse market environments, from trending to ranging conditions.
PF-RSI offers a suite of customizable features, including dynamic length variants, smoothing options, visualization tools, and alert conditions.
Key Features
1. Dynamic RSI Length Calculation
The cornerstone of the PF-RSI is its ability to adjust the RSI calculation period dynamically, eliminating the need for a static parameter. The length is computed using two primary factors:
Volatility: Measured via the standard deviation of past RSI values.
Distance from Midpoint: The absolute deviation of the RSI from 50, reflecting the strength of bullish or bearish momentum.
The indicator offers three variants for calculating this dynamic length, allowing users to tailor its responsiveness:
Variant I (Aggressive): Increases the length dramatically based on volatility and a nonlinear scaling of the distance from 50. Ideal for traders seeking highly sensitive signals in fast-moving markets.
Variant II (Moderate): Combines volatility with a scaled distance from 50, using a less aggressive adjustment. Strikes a balance between responsiveness and stability, suitable for most trading scenarios.
Variant III (Conservative): Applies a linear combination of volatility and raw distance from 50. Offers a stable, less reactive length adjustment for traders prioritizing consistency.
// Function that returns a dynamic RSI length based on past RSI values
// The idea is to make the RSI length adaptive using volatility (stdev) and distance from the RSI midpoint (50)
// Different "variant" options control how aggressively the length changes
parameter_free_length(free_rsi, variant) =>
len = switch variant
// Variant I: Most aggressive adaptation
// Uses standard deviation scaled by a nonlinear factor of distance from 50
// Also adds another distance-based term to increase length more dramatically
"I" => math.ceil(
ta.stdev(free_rsi, math.ceil(free_rsi)) *
math.pow(1 + (math.ceil(math.abs(50 - (free_rsi - 50))) / 100), 2)
) +
(
math.ceil(math.abs(free_rsi - 50)) *
(1 + (math.ceil(math.abs(50 - (free_rsi - 50))) / 100))
)
// Variant II: Moderate adaptation
// Adds the standard deviation and a distance-based scaling term (less nonlinear)
"II" => math.ceil(
ta.stdev(free_rsi, math.ceil(free_rsi)) +
(
math.ceil(math.abs(free_rsi - 50)) *
(1 + (math.ceil(math.abs(50 - (free_rsi - 50))) / 100))
)
)
// Variant III: Least aggressive adaptation
// Simply adds standard deviation and raw distance from 50 (linear scaling)
"III" => math.ceil(
ta.stdev(free_rsi, math.ceil(free_rsi)) +
math.ceil(math.abs(free_rsi - 50))
)
2. Smoothing Options
To refine the dynamic RSI and reduce noise, the PF-RSI provides smoothing capabilities:
Smoothing Toggle: Enable or disable smoothing of the dynamic length used for RSI.
Smoothing MA Type for RSI MA: Choose between SMA and EMA
Smoothing Length Options for RSI MA:
Full: Uses the entire calculated dynamic length.
Half: Applies half of the dynamic length for smoother output.
SQRT: Uses the square root of the dynamic length, offering a compromise between responsiveness and smoothness.
The smoothed RSI is complemented by a separate moving average (MA) of the RSI itself, further enhancing signal clarity.
3. Visualization Tools
The PF-RSI includes visualization options to help traders interpret market conditions at a glance.
Plots:
Dynamic RSI: Displayed as a white line, showing the adaptive RSI value.
RSI Moving Average: Plotted in yellow, providing a smoothed reference for trend and momentum analysis.
Dynamic Length: A secondary plot (in faint white) showing how the calculation period evolves over time.
Histogram: Represents the RSI’s position relative to 50, with color gradients.
Fill Area: The space between the RSI and its MA is filled with a gradient (green for RSI > MA, red for RSI < MA), highlighting momentum shifts.
Customizable bar colors on the price chart reflect trend and momentum:
Trend (Raw RSI): Green (RSI > 50), Red (RSI < 50).
Trend (RSI MA): Green (MA > 50), Red (MA < 50).
Trend (Raw RSI) + Momentum: Adds momentum shading (lighter green/red when RSI and MA diverge).
Trend (RSI MA) + Momentum: Similar, but based on the MA’s trend.
Momentum: Green (RSI > MA), Red (RSI < MA).
Off: Disables bar coloring.
Intrabar Updating: Optional real-time updates within each bar for enhanced responsiveness.
4. Alerts
The PF-RSI supports customizable alerts to keep traders informed of key events.
Trend Alerts:
Raw RSI: Triggers when the RSI crosses above (uptrend) or below (downtrend) 50.
RSI MA: Triggers when the moving average crosses 50.
Off: Disables trend alerts.
Momentum Alerts:
Triggers when the RSI crosses its moving average, indicating rising (RSI > MA) or declining (RSI < MA) momentum.
Alerts are fired once per bar close, with descriptive messages including the ticker symbol (e.g., " Uptrend on: AAPL").
How It Works
The PF-RSI operates in a multi-step process:
Initialization
On the first run, it calculates a standard RSI with a 14-period length to seed the dynamic calculation.
Dynamic Length Computation
Once seeded, the indicator switches to a dynamic length based on the selected variant, factoring in volatility and distance from 50.
If smoothing is enabled, the length is further refined using an SMA.
RSI Calculation
The adaptive RSI is computed using the dynamic length, ensuring it reflects current market conditions.
Moving Average
A separate MA (SMA or EMA) is applied to the RSI, with a length derived from the dynamic length (Full, Half, or SQRT).
Visualization and Alerts
The results are plotted, and alerts are triggered based on user settings.
This adaptive approach minimizes lag in fast markets and reduces false signals in choppy conditions, offering a significant edge over fixed-period RSI implementations.
Why Use PF-RSI?
The Parameter Free RSI stands out by eliminating the guesswork of selecting an RSI period. Its dynamic length adjusts to market volatility and momentum, providing timely signals without manual tweaking.

Gann Square NumbersThis is initial version of Gann square numbers.
This is initial version of Gann square numbers.
This is initial version of Gann square numbers.
This is initial version of Gann square numbers.
This is initial version of Gann square numbers.

GainzAlgo V2 [Alpha]// © GainzAlgo
//@version=5
indicator('GainzAlgo V2 ', overlay=true, max_labels_count=500)
show_tp_sl = input.bool(true, 'Display TP & SL', group='Techical', tooltip='Display the exact TP & SL price levels for BUY & SELL signals.')
rrr = input.string('1:2', 'Risk to Reward Ratio', group='Techical', options= , tooltip='Set a risk to reward ratio (RRR).')
tp_sl_multi = input.float(1, 'TP & SL Multiplier', 1, group='Techical', tooltip='Multiplies both TP and SL by a chosen index. Higher - higher risk.')
tp_sl_prec = input.int(2, 'TP & SL Precision', 0, group='Techical')
candle_stability_index_param = 0.7
rsi_index_param = 80
candle_delta_length_param = 10
disable_repeating_signals_param = input.bool(true, 'Disable Repeating Signals', group='Techical', tooltip='Removes repeating signals. Useful for removing clusters of signals and general clarity.')
GREEN = color.rgb(29, 255, 40)
RED = color.rgb(255, 0, 0)
TRANSPARENT = color.rgb(0, 0, 0, 100)
label_size = input.string('huge', 'Label Size', options= , group='Cosmetic')
label_style = input.string('text bubble', 'Label Style', , group='Cosmetic')
buy_label_color = input(GREEN, 'BUY Label Color', inline='Highlight', group='Cosmetic')
sell_label_color = input(RED, 'SELL Label Color', inline='Highlight', group='Cosmetic')
label_text_color = input(color.white, 'Label Text Color', inline='Highlight', group='Cosmetic')
stable_candle = math.abs(close - open) / ta.tr > candle_stability_index_param
rsi = ta.rsi(close, 14)
atr = ta.atr(14)
bullish_engulfing = close < open and close > open and close > open
rsi_below = rsi < rsi_index_param
decrease_over = close < close
var last_signal = ''
var tp = 0.
var sl = 0.
bull_state = bullish_engulfing and stable_candle and rsi_below and decrease_over and barstate.isconfirmed
bull = bull_state and (disable_repeating_signals_param ? (last_signal != 'buy' ? true : na) : true)
bearish_engulfing = close > open and close < open and close < open
rsi_above = rsi > 100 - rsi_index_param
increase_over = close > close
bear_state = bearish_engulfing and stable_candle and rsi_above and increase_over and barstate.isconfirmed
bear = bear_state and (disable_repeating_signals_param ? (last_signal != 'sell' ? true : na) : true)
round_up(number, decimals) =>
factor = math.pow(10, decimals)
math.ceil(number * factor) / factor
if bull
last_signal := 'buy'
dist = atr * tp_sl_multi
tp_dist = rrr == '2:3' ? dist / 2 * 3 : rrr == '1:2' ? dist * 2 : rrr == '1:4' ? dist * 4 : dist
tp := round_up(close + tp_dist, tp_sl_prec)
sl := round_up(close - dist, tp_sl_prec)
if label_style == 'text bubble'
label.new(bar_index, low, 'BUY', color=buy_label_color, style=label.style_label_up, textcolor=label_text_color, size=label_size)
else if label_style == 'triangle'
label.new(bar_index, low, 'BUY', yloc=yloc.belowbar, color=buy_label_color, style=label.style_triangleup, textcolor=TRANSPARENT, size=label_size)
else if label_style == 'arrow'
label.new(bar_index, low, 'BUY', yloc=yloc.belowbar, color=buy_label_color, style=label.style_arrowup, textcolor=TRANSPARENT, size=label_size)
label.new(show_tp_sl ? bar_index : na, low, 'TP: ' + str.tostring(tp) + ' SL: ' + str.tostring(sl), yloc=yloc.price, color=color.gray, style=label.style_label_down, textcolor=label_text_color)
if bear
last_signal := 'sell'
dist = atr * tp_sl_multi
tp_dist = rrr == '2:3' ? dist / 2 * 3 : rrr == '1:2' ? dist * 2 : rrr == '1:4' ? dist * 4 : dist
tp := round_up(close - tp_dist, tp_sl_prec)
sl := round_up(close + dist, tp_sl_prec)
if label_style == 'text bubble'
label.new(bear ? bar_index : na, high, 'SELL', color=sell_label_color, style=label.style_label_down, textcolor=label_text_color, size=label_size)
else if label_style == 'triangle'
label.new(bear ? bar_index : na, high, 'SELL', yloc=yloc.abovebar, color=sell_label_color, style=label.style_triangledown, textcolor=TRANSPARENT, size=label_size)
else if label_style == 'arrow'
label.new(bear ? bar_index : na, high, 'SELL', yloc=yloc.abovebar, color=sell_label_color, style=label.style_arrowdown, textcolor=TRANSPARENT, size=label_size)
label.new(show_tp_sl ? bar_index : na, low, 'TP: ' + str.tostring(tp) + ' SL: ' + str.tostring(sl), yloc=yloc.price, color=color.gray, style=label.style_label_up, textcolor=label_text_color)
alertcondition(bull or bear, 'BUY & SELL Signals', 'New signal!')
alertcondition(bull, 'BUY Signals (Only)', 'New signal: BUY')
alertcondition(bear, 'SELL Signals (Only)', 'New signal: SELL')

seekho roj kamao trendline indicatorThe Auto Trendline Indicator is a powerful technical analysis tool designed to automatically detect and plot dynamic trendlines based on recent price action. Using pivot-based logic, it identifies significant swing highs and lows and connects them to draw trendlines that visually represent market trends and potential support or resistance areas. The indicator continuously scans the chart for new pivots, updating trendlines in real-time to reflect the latest market structure. This helps traders quickly identify the direction and strength of a trend without manually drawing lines.
The trendlines offer a visual framework for traders to plan entries, exits, and risk management strategies. When price approaches these levels, it often signals a critical point of interest where breakouts, bounces, or reversals may occur. Because it reacts to actual price pivots, the indicator remains responsive to changing market conditions, making it suitable for trending and consolidating markets alike.
Ideal for traders of all levels, this indicator simplifies chart analysis by automating a traditionally manual process. It enhances decision-making by reducing subjectivity and providing clear visual cues. Whether used standalone or in conjunction with other tools, the Auto Trendline Indicator is a reliable assistant for mapping out price structure and market momentum.

Middle Finger Trading StrategyStrategy Logic Summary:
Identify Huge Volume: Finds a bar ( - the previous bar) where volume is significantly higher (activeHugeVolMultiplier) than the recent average volume (avgVolume ). The average calculation excludes specific times (RTH edges, certain ETH).
Confirm Volume Drop: Checks if the current bar's ( ) volume is lower than the previous bar's huge volume (volume < volume ).
Determine Trend Before Spike: Looks at the close two bars ago (close ) relative to the SMA two bars ago (priceSma ) to determine the trend before the huge volume bar.
Entry Signal (Base):
Long: Bearish trend before spike + Huge Volume on prev bar + Volume drop on current bar.
Short: Bullish trend before spike + Huge Volume on prev bar + Volume drop on current bar.
Time Filter: Optionally filters out entries during the first/last 15 mins of RTH and always filters specific ETH/pre-market times.
Entry Execution:
If a Long signal occurs and no position is open, place a limit order to buy at the low of the huge volume bar (low ).
If a Short signal occurs and no position is open, place a limit order to sell at the high of the huge volume bar (high ).
Order Processing: process_orders_on_close=false means limit orders can potentially be filled intra-bar if the price touches the limit level during the bar's formation.

[blackcat] L3 Twin Range Filter ProOVERVIEW
The L3 Twin Range Filter Pro indicator enhances trading strategies by filtering out market noise through a sophisticated dual-range approach. Unlike previous versions, this script not only provides clear visual indications of buy/sell signals but also incorporates a dynamic trend range filter line. By averaging two smoothed exponential moving averages—one fast and one slow—the indicator generates upper and lower range boundaries that adapt to changing market conditions. Traders can easily spot buy/sell opportunities when the closing price crosses these boundaries, supported by configurable alerts for real-time notifications.
FEATURES
Dual-Range Calculation: Combines fast and slow moving averages to create adaptive range boundaries.
Customizable Parameters:
Periods: Adjustable lengths for fast (default 9 bars) and slow (default 34 bars) moving averages.
Multipliers: Coefficients to modify the distance of the trailing lines from the price.
Dynamic Trend Range Filter Line: Visually displays buy/sell signals directly on the chart.
Trailing Stop Loss Logic: Automatically follows price movements to act as a trailing stop loss indicator.
Trade Signals: Clearly indicates buy/sell points with labeled signals.
Alerts: Configurable notifications for buy/sell signals to keep traders informed.
Visual Enhancements: Colored fills and dynamic boundary lines for easy interpretation.
HOW TO USE
Add the L3 Twin Range Filter Pro indicator to your TradingView chart.
Customize the input parameters:
Price Source: Choose the desired price source (e.g., Close).
Show Trade Signals: Toggle on/off for displaying buy/sell labels.
Fast Period: Set the period for the fast moving average (default 9 bars).
Slow Period: Set the period for the slow moving average (default 34 bars).
Fast Range Multiplier: Adjust the multiplier for the fast moving average.
Slow Range Multiplier: Adjust the multiplier for the slow moving average.
Monitor the plotted trend range filter and dynamic boundaries on the chart.
Identify buy/sell signals based on the crossing of price and range boundaries.
Configure alerts for real-time notifications when signals are triggered.
TRADE LOGIC
BUY Signal: Triggered when the price is higher than or equal to the upper range level. The indicator line will trail just below the price, acting as a trailing stop loss.
SELL Signal: Triggered when the price is lower than or equal to the lower range level. The indicator line will trail just above the price, serving as a trailing stop loss.
LIMITATIONS
The performance of this indicator relies on the selected periods and multipliers.
Market volatility can impact the accuracy of the signals.
Always complement this indicator with other analytical tools for robust decision-making.
NOTES
Experiment with different parameter settings to optimize the indicator for various market conditions.
Thoroughly backtest the indicator using historical data to ensure its compatibility with your trading strategy.
THANKS
A big thank you to Colin McKee for his foundational work on the Twin Range Filter! Your contributions have paved the way for enhanced trading tools. 🙏📈🔍

Reversal Detector [Apicode]This indicator attempts to represent significant trend changes. While it's not perfect (none are), it does allow you to be prepared for the next trend change. Remember to combine it with other indicators.

THE GOAT EMA/VWAP Cross Hilight + Bull/Bear RVOLx3 hilow🧠 Description
This all-in-one indicator is designed for serious traders who want high-conviction entries, volume-confirmed reversals, and a clean, efficient display of trend and momentum behavior.
It combines:
📈 Three independent EMA + VWAP crossover detectors
🔼 Bullish cross signals with optional arrows and highlights
🔽 Bearish cross signals with separate styling
📊 3x Relative Volume (RVOL) candles
🔷 Aqua for bullish high-volume moves
🔴 Fuchsia for bearish high-volume moves
🟤 Volume Pressure Drop Detection
Highlights dark maroon candles after a high RVOL bar followed by a sudden volume drop — often signaling a potential reversal or exhaustion
🔧 Fully Customizable:
Toggle on/off each EMA/VWAP setup
Adjust MA lengths, VWAP periods, highlight colors
Configure the RVOL threshold and lookback window
Set the volume drop sensitivity
Enable/disable the on-chart color legend for visual reference
🔔 Built-In Alerts:
✅ Bullish and bearish EMA+VWAP crosses (for all 3 setups)
✅ High RVOL candles
✅ Volume drop after RVOL (reversal zone)
🎨 Visual Key:
Condition Candle Color
📈 Bullish 3x RVOL 🔷 Aqua
📉 Bearish 3x RVOL 🔴 Fuchsia
🛑 Volume Drop After RVOL 🟤 Dark Maroon
➕ Cross Highlights Custom per setup
🧭 Best For:
Breakout and trend continuation entries
Reversal signals after climax candles
Momentum confirmation with volume
Multi-timeframe stack strategies using VWAP and EMA alignment

THE GOAT EMA/VWAP Cross Hilight + Bull/Bear RVOLx3🧠 Description
This premium tool is designed for traders who want precise entry signals based on trend confirmation, volume strength, and momentum conviction.
It combines:
📈 Three customizable EMA + VWAP crossover setups
🔼 Bullish cross detection with arrow + highlight
🔽 Bearish cross detection with arrow + highlight
🔊 Real-time alerts for all crossover events
📊 Relative Volume (RVOL) candle paint when volume exceeds a user-defined multiple of average volume
🔵 Bullish RVOL candles = aqua
🔴 Bearish RVOL candles = fuchsia
🔧 Customization Features
Enable/disable each of the 3 crossover setups independently
Customize EMA/VWAP lengths, highlight colors, and volume thresholds
Adjust RVOL lookback period and multiplier in settings
Clean, minimal styling — no background clutter, just actionable color-coded signals
🚦 Signal Logic
Signal Type Trigger Condition Visual Cue
Bullish Cross Price crosses above both EMA & VWAP Up arrow + highlight
Bearish Cross Price crosses below both EMA & VWAP Down arrow + highlight
Bullish RVOL Volume > 3× average and candle is green (close > open) Candle body turns aqua
Bearish RVOL Volume > 3× average and candle is red (close < open) Candle body turns fuchsia
🔔 Alerts Included
Setup 1, 2, 3: Bullish cross
Setup 1, 2, 3: Bearish cross
High RVOL candle detection
💡 Ideal For:
Trend continuation or reversal entries
Volume-based confirmation for breakouts
Multi-timeframe EMA/VWAP stack strategies
Traders who want clean, reliable visual cues

Peak Pulse ReversalPeak Pulse Reversal is a clean and accurate indicator designed to detect price exhaustion zones.
It uses a combination of internal logic to identify high-probability reversal points — both at tops and bottoms.
📈 Ideal for swing and intraday traders
🔍 Highlights overbought/oversold extremes with signal arrows
🧠 Combines multiple hidden tools under a simplified interface
🔎 Among the signals generated by the indicator, purple and orange signals represent moments where multiple internal indicators confirm an overbought or oversold condition simultaneously.
These signals often form at stronger exhaustion points and indicate a higher probability of reversal.
💡 Therefore, purple and orange signals are considered high-confidence zones.
🔐 Manual access only. Contact @traderpango for access

ORB Advanced Cloud Indicator & FIB's by TenAMTraderSummary: ORB Advanced Cloud Indicator with Alerts and Fibonacci Retracement Targets by TenAMTrader
This TradingView script is an advanced version of the Opening Range Breakout (ORB) indicator, enhanced with visual clouds and Fibonacci retracement/extension levels. It is designed to help traders identify key price levels and track price movements relative to those levels throughout the trading day. The script includes alert functionalities to notify traders when price crosses key levels and when Fibonacci levels are reached, which can serve as potential entry and exit targets.
Key Features:
Primary and Secondary Range Calculation:
The indicator calculates the primary range (defined by a start and end time) and optionally, a secondary range.
The primary range includes the highest and lowest prices during the designated time period, as well as the midpoint of this range.
The secondary range (if enabled) tracks another price range during a second time period, with its own high, low, and midpoint.
Visual Clouds:
The script draws colored clouds between the high, midpoint, and low of the opening range.
The upper cloud spans between the Opening High and Midpoint, while the lower cloud spans between the Midpoint and Opening Low.
Similarly, a second set of clouds can be drawn for the secondary range (if enabled).
Fibonacci Levels:
The script calculates Fibonacci retracement and extension levels based on the primary range (the difference between the Opening High and Opening Low).
Fibonacci levels can be used as entry and exit targets in a trading strategy, as these levels often act as potential support/resistance zones.
Fibonacci levels include standard values like -0.236, -0.382, -0.618, and positive extensions like 1.236, 1.618, etc.
Customizable Alerts:
Alerts can be set to trigger when:
The price crosses above the Opening High.
The price crosses below the Opening Low.
The price crosses the Opening Midpoint.
These alerts can help traders act quickly on important price movements relative to the opening range.
Customization Options:
The indicator allows users to adjust the time settings for both the primary and secondary ranges.
Custom colors can be set for the lines, clouds, and Fibonacci levels.
The visibility of each line and cloud can be toggled on or off, giving users flexibility in how the chart is displayed.
Fibonacci Levels Overview:
The script includes several Fibonacci retracement and extension levels:
Negative Retracements (e.g., -0.236, -0.382, -0.50, -0.618, etc.) are plotted below the Opening Low, and can act as potential support levels in a downtrend.
Positive Extensions (e.g., 1.236, 1.382, 1.618, 2.0, etc.) are plotted above the Opening High, and can act as potential resistance levels in an uptrend.
Fib levels can be used as entry and exit targets to capitalize on price reversals or breakouts.
Safety Warning:
This script is for educational and informational purposes only and is not intended as financial advice. While it provides valuable technical information about price ranges and Fibonacci levels, trading always involves risk. Users are encouraged to:
Paper trade or use a demo account before applying this indicator with real capital.
Use proper risk management strategies, including stop-loss orders, to protect against unexpected market movements.
Understand that no trading strategy, indicator, or tool can guarantee profits, and losses can occur.
Important: The creator, TenAMTrader, and TradingView are not responsible for any financial losses resulting from the use of this script. Always trade responsibly, and ensure you fully understand the risks involved in any trading strategy.

X OHLdesigned to plot significant levels—closed higher timeframe High, Low, Open, and an Equilibrium (EQ) level and current Open—on the current chart based on user-defined higher timeframes (HTFs). It helps traders visualize HTF price levels on lower timeframes for confluence, context, or decision-making.
Key Functional Components:
Configurable Inputs:
Four Timeframes: Customizable (default: 1H, 4H, D, W).
Visibility Toggles for:
Previous High (pHigh)
Previous Low (pLow)
EQ (midpoint between high and low)
Current Open
Previous Open
How It Works:
For each selected timeframe:
retrieves OHL Data
Previous high/low (high , low )
Current and previous open
EQ is calculated as midpoint: (high + low) / 2
Draws Horizontal Lines:
Lines are drawn from the candle where the HTF bar opens and extended until timeframe switch. Lines extends a few bars beyond current to assist in visualization
Labels:
On the most recent bar, each level is labeled with a description (pHigh 1H, EQ 6H, etc.).
Labels are customizable (size, color, background).
Anchoring:
Lines and labels are redrawn on the start of each new HTF bar to ensure accuracy and relevance.

ORB Strategy w/ Volume Confirmation & EMAsORB breakout within 15 minutes of the NY open. Uses EMA indicators to show strength in trend.

Dual-Phase Trend Regime Strategy [Zeiierman X PineIndicators]This strategy is based on the Dual-Phase Trend Regime Indicator by Zeiierman.
Full credit for the original concept and logic goes to Zeiierman.
This non-repainting strategy dynamically switches between fast and slow oscillators based on market volatility, providing adaptive entries and exits with high clarity and reliability.
Core Concepts
1. Adaptive Dual Oscillator Logic
The system uses two oscillators:
Fast Oscillator: Activated in high-volatility phases for quick reaction.
Slow Oscillator: Used during low-volatility phases to reduce noise.
The system automatically selects the appropriate oscillator depending on the market's volatility regime.
2. Volatility Regime Detection
Volatility is calculated using the standard deviation of returns. A median-split algorithm clusters volatility into:
Low Volatility Cluster
High Volatility Cluster
The current volatility is then compared to these clusters to determine whether the regime is low or high volatility.
3. Trend Regime Identification
Based on the active oscillator:
Bullish Trend: Oscillator > 0.5
Bearish Trend: Oscillator < 0.5
Neutral Trend: Oscillator = 0.5
The strategy reacts to changes in this trend regime.
4. Signal Source Options
You can choose between:
Regime Shift (Arrows): Trade based on oscillator value changes (from bullish to bearish and vice versa).
Oscillator Cross: Trade based on crossovers between the fast and slow oscillators.
Trade Logic
Trade Direction Options
Long Only
Short Only
Long & Short
Entry Conditions
Long Entry: Triggered on bullish regime shift or fast crossing above slow.
Short Entry: Triggered on bearish regime shift or fast crossing below slow.
Exit Conditions
Long Exit: Triggered on bearish shift or fast crossing below slow.
Short Exit: Triggered on bullish shift or fast crossing above slow.
The strategy closes opposing positions before opening new ones.
Visual Features
Oscillator Bands: Plots fast and slow oscillators, colored by trend.
Background Highlight: Indicates current trend regime.
Signal Markers: Triangle shapes show bullish/bearish shifts.
Dashboard Table: Displays live trend status ("Bullish", "Bearish", "Neutral") in the chart’s corner.
Inputs & Customization
Oscillator Periods – Fast and slow lengths.
Refit Interval – How often volatility clusters update.
Volatility Lookback & Smoothing
Color Settings – Choose your own bullish/bearish colors.
Signal Mode – Regime shift or oscillator crossover.
Trade Direction Mode
Use Cases
Swing Trading: Take entries based on adaptive regime shifts.
Trend Following: Follow the active trend using filtered oscillator logic.
Volatility-Responsive Systems: Adjust your trade behavior depending on market volatility.
Clean Exit Management: Automatically closes positions on opposite signal.
Conclusion
The Dual-Phase Trend Regime Strategy is a smart, adaptive, non-repainting system that:
Automatically switches between fast and slow trend logic.
Responds dynamically to changes in volatility.
Provides clean and visual entry/exit signals.
Supports both momentum and reversal trading logic.
This strategy is ideal for traders seeking a volatility-aware, trend-sensitive tool across any market or timeframe.
Full credit to Zeiierman.

Best SMA FinderThis script, Best SMA Finder, is a tool designed to identify the most robust simple moving average (SMA) length for a given chart, based on historical backtest performance. It evaluates hundreds of SMA values (from 10 to 1000) and selects the one that provides the best balance between profitability, consistency, and trade frequency.
What it does:
The script performs individual backtests for each SMA length using either "Long Only" or "Buy & Sell" logic, as selected by the user. For each tested SMA, it computes:
- Total number of trades
- Profit Factor (total profits / total losses)
- Win Rate
- A composite Robustness Score, which integrates Profit Factor, number of trades (log-scaled), and win rate.
Only SMA configurations that meet the user-defined minimum trade count are considered valid. Among all valid candidates, the script selects the SMA length with the highest robustness score and plots it on the chart.
How to use it:
- Choose the strategy type: "Long Only" or "Buy & Sell"
- Set the minimum trade count to filter out statistically irrelevant results
- Enable or disable the summary stats table (default: enabled)
The selected optimal SMA is plotted on the chart in blue. The optional table in the top-right corner shows the corresponding SMA length, trade count, Profit Factor, Win Rate, and Robustness Score for transparency.
Key Features:
- Exhaustive SMA optimization across 991 values
- Customizable trade direction and minimum trade filters
- In-chart visualization of results via table and plotted optimal SMA
- Uses a custom robustness formula to rank SMA lengths
Use cases:
Ideal for traders who want to backtest and auto-select a historically effective SMA without manual trial-and-error. Useful for swing and trend-following strategies across different timeframes.
📌 Limitations:
- Not a full trading strategy with position sizing or stop-loss logic
- Only one entry per direction at a time is allowed
- Designed for exploration and optimization, not as a ready-to-trade system
This script is open-source and built entirely from original code and logic. It does not replicate any closed-source script or reuse significant external open-source components.

Seekho roj kamao buy sell v6Take the guesswork out of trading with our powerful Auto Buy/Sell Indicator, designed exclusively for TradingView. This intelligent tool automatically identifies high-probability buy and sell opportunities based on a combination of price action, momentum, and trend confirmation. Whether you're trading crypto, forex, or stocks, the indicator adapts to any market and time frame, making it a versatile addition to your trading toolkit.
The indicator plots clear buy and sell signals directly on the chart, helping you time your entries and exits with confidence. It also includes customizable settings to adjust sensitivity, filter noise, and align with your personal trading style. Built-in alerts ensure you never miss a trading opportunity, even when you’re away from your screen.
Ideal for both beginners and experienced traders, this indicator simplifies decision-making by visually representing market signals in real time. No coding or complex setup required—just plug it into your TradingView chart and start trading smarter.
Whether you're day trading or swing trading, the Auto Buy/Sell Indicator helps you stay ahead of the market and improve consistency. Combine it with sound risk management for a complete trading edge.

Market Structure: BoS & CHoCH (Math by Thomas)📌 Description:
Market Structure: BoS & CHoCH (Math by Thomas) is a clean and reliable market structure tool designed to visually mark Swing Highs, Swing Lows, and classify each one as HH (Higher High), LH (Lower High), LL (Lower Low), or HL (Higher Low) based on price action. It also detects and labels Break of Structure (BoS) and Change of Character (CHoCH) to help identify potential continuation or reversal in trend.
🛠️ How to Use:
Add the indicator to your chart (works on any timeframe and asset).
Adjust the "Swing Sensitivity" input to fine-tune how many bars the script uses to detect a swing high/low. A higher number smooths out noise.
The script will automatically:
Mark every confirmed swing high or low with a solid line.
Label the swing as HH, LH, HL, or LL depending on its relative position.
Show BoS (trend continuation) or CHoCH (trend reversal) labels with the current trend direction.
Toggle labels or lines on or off with the corresponding checkboxes in settings.
🔍 Tip:
Use this indicator alongside other tools like volume or RSI for more confident entries. A CHoCH followed by two BoS in the same direction often signals a strong trend reversal.

Seekho roj kamaoVery accurate buy and sell entries.This custom trading indicator delivers powerful market insights by combining price action, volume trends, and momentum shifts. Designed for precision, it identifies high-probability entry and exit points, minimizing noise and maximizing clarity. Whether you're day trading or swing trading, it enhances decision-making and adapts seamlessly to various market conditions

X HL RangeOverview:
The X Range indicator is a multi-timeframe visualization tool designed to display the high and low price ranges of previous candles from higher timeframes (HTFs) directly on a lower timeframe chart. It helps traders identify significant price zones and potential support/resistance levels by visually representing the price range of up to three previous candles for each selected timeframe.
Key Features:
Multi-Timeframe Support: The indicator supports three configurable higher timeframes (default: 60 min, 15 min, 5 min) which can be independently toggled on or off.
Custom Candle Range Display: For each enabled timeframe, users can choose to display the range of the most recent 1, 2, or 3 completed candles.
Dynamic Box Drawing: Price ranges are highlighted using rectangular boxes that extend across the chart to show where the highs and lows of each selected HTF candle occurred.
Custom Styling: Each timeframe's boxes can be individually styled with user-defined background and border colors to suit visual preferences or chart themes.
Efficient Redrawing: Boxes update in real-time as new higher timeframe candles complete, and previous boxes are removed to prevent chart clutter.
Use Case:
This indicator is particularly useful for intraday traders who want to align entries and exits with higher timeframe levels. By visualizing previous HTF ranges on a lower timeframe chart, traders gain contextual awareness of where price is likely to react or consolidate, aiding in decision-making for breakouts, reversals, or trend continuation setups.

FVG [TakingProphets]🧠 Purpose
This indicator is built for traders applying Inner Circle Trader (ICT) methodology. It detects and manages Fair Value Gaps (FVGs) — price imbalances that often act as future reaction zones. It also highlights New Day Opening Gaps (NDOGs) and New Week Opening Gaps (NWOGs) that frequently play a role in early-session price behavior.
📚 What is a Fair Value Gap?
A Fair Value Gap forms when price moves rapidly, skipping over a portion of the chart between three candles — typically between the high of the first candle and the low of the third. These zones are considered inefficient, meaning institutions may return to them later to:
-Rebalance unfilled orders
-Enter or scale into positions
-Engineer liquidity with minimal slippage
In ICT methodology, FVGs are seen as both entry zones and targets, depending on market structure and context.
⚙️ How It Works
-This script automatically identifies and manages valid FVGs using the following logic:
-Bullish FVGs: When the low of the current candle is above the high from two candles ago
-Bearish FVGs: When the high of the current candle is below the body of two candles ago
-Minimum Gap Filter: Gaps must be larger than 0.05% of price
-Combine Consecutive Gaps (optional): Merges adjacent gaps of the same type
-Consequent Encroachment Line (optional): Plots the midpoint of each gap
-NDOG/NWOG Tracking: Labels gaps created during the 5–6 PM session transition
-Automatic Invalidation: Gaps are removed once price closes beyond their boundary
🎯 Practical Use
-Use unmitigated FVGs as potential entry points or targets
-Monitor NDOG and NWOG for context around daily or weekly opens
-Apply the midpoint (encroachment) line for precise execution decisions
-Let the script handle cleanup — only active, relevant zones remain visible
🎨 Customization
-Control colors for bullish, bearish, and opening gaps
-Toggle FVG borders and midpoint lines
-Enable or disable combining of consecutive gaps
-Fully automated zone management, no manual intervention required
✅ Summary
This tool offers a clear, rules-based approach to identifying price inefficiencies rooted in ICT methodology. Whether used for intraday or swing trading, it helps traders stay focused on valid, active Fair Value Gaps while filtering out noise and maintaining chart clarity.

Heikin Ashi Colored Regular OHLC CandlesHeikin Ashi Colored Regular OHLC Candles
In the world of trading, Heikin Ashi candles are a popular tool for smoothing out price action and identifying trends more clearly. However, Heikin Ashi candles do not reflect the actual open, high, low, and close prices of a market. They are calculated values that change the chart’s structure. This can make it harder to see precise price levels or use standard price-based tools effectively.
To get the best of both worlds, we can apply the color logic of Heikin Ashi candles to regular OHLC candles. This means we keep the true market data, but show the trend visually in the same smooth way Heikin Ashi candles do.
Why use this approach
Heikin Ashi color logic filters out noise and helps provide a clearer view of the current trend direction. Since we are still plotting real OHLC candles, we do not lose important price information such as actual highs, lows, or closing prices. This method offers a hybrid view that combines the accuracy of real price levels with the visual benefits of Heikin Ashi trend coloring. It also helps maintain visual consistency for traders who are used to Heikin Ashi signals but want to see real price action.
Advantages for scalping
Scalping requires fast decisions. Even small price noise can lead to hesitation or bad entries. Coloring regular candles based on Heikin Ashi direction helps reduce that noise and makes short-term trends easier to read. It allows for faster confirmation of momentum without switching away from real prices. Since the candles are not modified, scalpers can still place tight stop-losses and targets based on actual price structure. This approach also avoids clutter, keeping the chart clean and focused.
How it works
We calculate the Heikin Ashi values in the background. If the Heikin Ashi close is higher than the Heikin Ashi open, the trend is considered bullish and the candle is colored green. If the close is lower than the open, it is bearish and the candle is red. If they are equal, the candle is gray or neutral. We then use these colors to paint the real OHLC candles, which are unchanged in shape or position.