AltCoin Index Correlation🧠 AltCoin Index Correlation — Strategy Overview
AltCoin Index Correlation is a dynamic EMA-based trading strategy designed primarily for altcoins, but also adaptable to stocks and indices, thanks to its flexible reference index system.
🧭 Strategy Philosophy
The core idea behind this strategy is simple yet powerful:
Price action becomes more meaningful when it aligns with broader market context.
This script analyzes the correlation between the asset’s trend and a reference index trend, using dual EMA (Exponential Moving Average) crossovers for both.
When both the altcoin and the reference index (e.g. Altcoin Dominance, BTC Dominance, Total Market Cap, or even indices like the NASDAQ 100 or S&P 500) are aligned in trend direction, the script considers it a high-confidence setup.
It also includes:
Optional inverse correlation logic (for contrarian setups)
Custom leverage settings (e.g., 1x, 1.8x, etc.)
A dynamic scale-out mechanism during weakening trends
Date filtering for controlled backtests
A live performance dashboard with equity, PnL, win rate, drawdown, APR, and more
⚙️ Default Settings & Backtest Results
Timeframe tested: 1H
Test date: May 20, 2025
Sample: 100 high-cap altcoins
Reference index: CRYPTOCAP:OTHERS.D (Altcoin Dominance)
Leverage: 1.8x (180% of capital used)
📊 With default settings:
Win rate: ~80%
Higher profits, due to increased exposure
Best suited for confident trend followers with higher risk tolerance
📉 With fixed capital or 1x leverage:
Win rate improves to ~90%
Lower returns, but greater capital preservation
Ideal for conservative or risk-managed trading styles
🔄 Versatility
While tailored for altcoins, this strategy supports traditional markets as well:
Easily switch the reference index to OANDA:NAS100USD or S&P 500 for stock correlation trading
Adjust EMA lengths and leverage to match the asset class and volatility profile
🧩 Suggested Use
Best used on trending markets (not sideways)
Ideal for 1H timeframes, but adjustable
Suitable for traders who want a rules-based, macro-aware entry/exit system
Try it out, customize it to your style, try different settings and share your results with the community!
Feedback is welcome — and improvements are always in progress.
🚀 ### Check my profile for other juicy hints and original strategies. ### 🚀
Indicators and strategies

V2_Livermore-Seykota Breakout)V2_ Livermore-Seykota Breakout Strategy
Objective: Execute breakout trades inspired by Jesse Livermore, filtered by trend confirmation (Ed Seykota) and risk-managed with ATR (Paul Tudor Jones style).
Entry Conditions:
Long Entry:
Close price breaks above recent pivot high.
Price is above main EMA (EMA50).
EMA20 > EMA200 (uptrend confirmation).
Current volume > 20-period SMA (volume confirmation).
Short Entry:
Close price breaks below recent pivot low.
Price is below main EMA (EMA50).
EMA20 < EMA200 (downtrend confirmation).
Current volume > 20-period SMA.
Exit Conditions:
Stop-loss: ATR × 3 from entry price.
Trailing stop: activated with offset of ATR × 2.
Strengths:
Trend-aligned entries with volume breakout confirmation.
Dynamic ATR-based risk management.
Inspired by principles of three legendary traders.

Livermore-Seykota Breakout StrategyStrategy Name: Livermore-Seykota Breakout Strategy
Objective: Execute breakout trades inspired by Jesse Livermore, filtered by trend confirmation (Ed Seykota) and risk-managed with ATR (Paul Tudor Jones style).
Entry Conditions:
Long Entry:
Close price breaks above recent pivot high.
Price is above main EMA (EMA50).
EMA20 > EMA200 (uptrend confirmation).
Current volume > 20-period SMA (volume confirmation).
Short Entry:
Close price breaks below recent pivot low.
Price is below main EMA (EMA50).
EMA20 < EMA200 (downtrend confirmation).
Current volume > 20-period SMA.
Exit Conditions:
Stop-loss: ATR × 3 from entry price.
Trailing stop: activated with offset of ATR × 2.
Strengths:
Trend-aligned entries with volume breakout confirmation.
Dynamic ATR-based risk management.
Inspired by principles of three legendary traders.

Smart Trading System v3This strategy is a precision-based trend-following system that leverages multi-timeframe alignment and momentum signals. Entry decisions are made using a blend of moving average pullbacks and oscillator crossovers, triggered only during active trading hours. Exits are governed by trailing volatility thresholds or key indicator reversals, adapting intelligently to the instrument’s behavior while managing risk through position sizing and drawdown constraints.

BankNifty 9:15 Breakout - Fixed Qty 30. 🎯 Strategy Objective
To trade the Bank Nifty Futures based on the breakout of the 9:15 AM candle (15-min) using a fixed quantity of 30 lots, with intraday reversal and exit logic.

Liquidity Grab Strategy (Volume Trap)🧠 Strategy Logic:
Liquidity Grab Detection:
The script looks for a sharp drop in price (bearish engulfing or breakdown candle).
However, volume remains flat (within 5% of the 20-period moving average), suggesting the move is manipulated, not genuine.
Fair Value Gap Confirmation (FVG):
It confirms that a Fair Value Gap exists — a gap between recent candle bodies that price is likely to retrace into.
This gap represents a high-probability entry zone.
Trade Setup:
A limit BUY order is placed at the base of the FVG.
Stop Loss (SL) is placed below the gap.
Take Profit (TP) is placed at the most recent swing high.
📈 How to Use It:
Add the strategy to your TradingView chart (1–5 min or 15 min works well for intraday setups).
Look for green BUY labels and plotted lines:
💚 Green = Entry price
🔴 Red = Stop loss
🔵 Blue = Take profit
The script will automatically simulate entries when conditions are met and exit either at TP or SL.
Use TradingView’s Strategy Tester to review:
Win rate
Net profit
Risk-adjusted performance

Dual Timeframe DMI + StochRSI StrategyThis strategy works on the principle that there's a higher probability of accuracy if the LTF follows the HTF trend.
The HTF DMI plus Stochastic RSI cross will trigger a reaction on the LTF.
There's a quick 2:1 scalp on the 2m timeframe.

Scalping EMA + RSI Strategy (Long & Short)Scalping EMA with RSI Strategy.
Entry Criteria: Indicators, price action, or patterns triggering entries.
Stop Loss (SL): Fixed pips, ATR-based, or swing low/high.
Take Profit (TP): Fixed reward, trailing stop, or dynamic levels.
RRR Target: e.g., 1:1.5 or 1:2.

SMA + Range Breakout StrategySimple Moving Average with Range Breakout with RSI confirmation having Trailing Stop Loss
Trailing Stop-Loss
RSI Confirmation Filter
Breakout Alerts

Gold Breakout Strategy - RR 4Strategy Name: Gold Breakout Strategy - RR 4
🧠 Main Objective
This strategy aims to capitalize on breakouts from the Donchian Channel on Gold (XAU/USD) by filtering trades with:
Volume confirmation,
A custom momentum indicator (LWTI - Linear Weighted Trend Index),
And a specific trading session (8 PM to 8 AM Quebec time — GMT-5).
It takes only one trade per day, either a buy or a sell, using a fixed stop-loss at the wick of the breakout candle and a 4:1 reward-to-risk (RR) ratio.
📊 Indicators Used
Donchian Channel
Length: 96
Detects breakouts of recent highs or lows.
Volume
Simple Moving Average (SMA) over 30 bars.
A breakout is only valid if the current volume is above the SMA.
LWTI (Linear Weighted Trend Index)
Measures momentum using price differences over 25 bars, smoothed over 5.
Used to confirm trend direction:
Buy when LWTI > its smoothed version (uptrend).
Sell when LWTI < its smoothed version (downtrend).
⏰ Time Filter
The strategy only allows entries between 8 PM and 8 AM (GMT-5 / Quebec time).
A timestamp-based filter ensures the system recognizes the correct trading session even across midnight.
📌 Entry Conditions
🟢 Buy (Long)
Price breaks above the previous Donchian Channel high.
The current channel high is higher than the previous one.
Volume is above its moving average.
LWTI confirms an uptrend.
The time is within the trading session (20:00 to 08:00).
No trade has been taken yet today.
🔴 Sell (Short)
Price breaks below the previous Donchian Channel low.
The current channel low is lower than the previous one.
Volume is above its moving average.
LWTI confirms a downtrend.
The time is within the trading session.
No trade has been taken yet today.
💸 Trade Management
Stop-Loss (SL):
For long entries: placed below the wick low of the breakout candle.
For short entries: placed above the wick high of the breakout candle.
Take-Profit (TP):
Set at a fixed 4:1 reward-to-risk ratio.
Calculated as 4x the distance between the entry price and stop-loss.
No trailing stop, no break-even, no scaling in/out.
🎨 Visuals
Green triangle appears below the candle on a buy signal.
Red triangle appears above the candle on a sell signal.
Donchian Channel lines are plotted on the chart.
The strategy is designed for the 5-minute timeframe.
🔄 One Trade Per Day Rule
Once a trade is taken (buy or sell), no more trades will be executed for the rest of the day. This prevents overtrading and limits exposure.

RSI + MACD Cross StrategyRSI + MACD Cross Strategy (No Trailing SL)
When your trade goes into profit, the best thing to do is to move your Stop Loss to a logical point behind the most recent swing low or swing high, depending on whether you're in a Buy or Sell position. This way, if the market reverses, you’ll at least secure the profit you had up to that point.

SuperBollingerTrend MACD ADXWrote this, but it didn't work so well
I used MACD ADX and SuperBollingerTrend


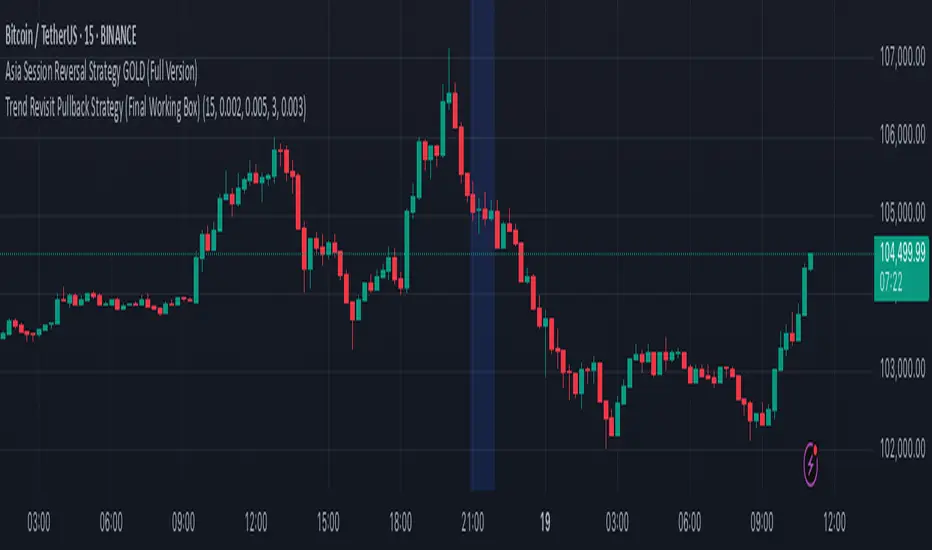
Trend Revisit Pullback Strategy (Final Working Box)📈 Trend Revisit Pullback Strategy
This TradingView Pine Script strategy identifies strong trend breakouts and accounts for natural pullbacks by:
Entering long or short on strong 1-bar breakouts
Allowing for pullback averaging if price retraces after entry
Expecting a revisit to the original entry price within 15 bars
Automatically exiting at break-even or using a custom TP/SL
Drawing a visual trade zone (entry → SL → revisit window) for easy reference
Optional labels and color-coded boxes to track each trade’s lifecycle
Ideal for trend traders who anticipate a pullback and prefer to manage risk with break-even exits or reward-to-risk parameters.
Crypto Scalping Strategy [Dubic] - LONG Only📈 Crypto Scalping Strategy – LONG Only
This strategy is designed for scalping crypto assets on lower timeframes (e.g., 5m, 15m, 1H), focused strictly on LONG entries with smart trend confirmation and ATR-based risk management.
✅ Core Features
EMA Trend Confirmation: Entry triggers when fast EMA crosses above slow EMA and RSI confirms bullish strength.
Re-Entry Logic: Detects pullbacks using Heikin Ashi candles and enters again when bullish momentum resumes.
ATR-Based Stop Loss & Take Profit: Dynamic SL and TP levels adapt to market volatility.
Trailing Take Profit: After initial TP is hit, a trailing TP protects profits as the trend continues.
Visual SL/TP Levels: Plots ATR stop loss, take profit, and trailing TP levels directly on the chart.
Alert-Ready: Includes webhook-compatible alerts for Initial Buy, Re-entry Buy, and Manual Exit signals.
⚙️ Inputs You Can Customize
EMA Fast/Slow Periods
RSI Length
ATR Length and multipliers for SL/TP
Trailing TP Deviation %
🔔 Alerts
Ready-to-use alerts for:
Initial Buy
Re-Entry Buy
Manual Exit when price closes below the fast EMA
Webhook messages are formatted in JSON for easy integration with bots or automation tools.
🚨 Disclaimer: This is a long-only strategy built for educational and testing purposes. Always backtest thoroughly and use proper risk management before trading live.

CANX MA Crossover© CanxStixTrader
Moving average crossover systems measure drift in the market. They are great strategies for time-limited traders. KEEP IT SIMPLE
This strategy works both for buys and sells using the reaction line to guide your position against the reactions.
HOW TO USE THE INDICATOR
1) Choose your market and timeframe.
2) Choose the length.
3) Choose the multiplier.
4) Choose if the strategy is long-only or bidirectional (longs & shorts).
TIPS
The strategy works best in bullish markets as that is the primary direction that market such as stocks, indexes and metals like to move.
- Increase the multiplier to reduce whipsaws
- Increase the length to take fewer trades
- Decrease the length to take more trades
- Try a Long-Only strategy to see if that performs better.
The base set up when you load the indicator is for the 1 minute chart on gold. We found that it also works well on the US Indexes. For other markets you may need to change the length and multiplier to suit the market and back test its results.

Phoenix AI StrategyUsing Phoenix AI Strategy allows you to fine tune the setting for the Phoenix AI indicator. You can change the settings to see what the outcome would be over a trading range.
You can gage:
Total P&L
Max Equity Drawdown
Total Number of Trades
Profitable Trades
Profit Factor
The Phoenix AI Strategy is a complex trading algorithm that combines multiple technical indicators and adaptive elements to generate buy and sell signals. At its core, the strategy uses a combination of volatility, trend, and momentum indicators to identify potential trading opportunities.
The strategy starts by calculating the current volatility of the market using the Average True Range (ATR) indicator. This value is then compared to the historical volatility to determine the volatility ratio. The volatility ratio is used to adjust the dynamic RSI parameters, which are used to identify overbought and oversold conditions in the market.
The strategy also uses a moving average channel to identify the trend direction and potential support and resistance levels. The channel is calculated using the Exponential Moving Average (EMA) of the high and low prices over a specified period.
In addition to the moving average channel, the strategy uses the Ichimoku cloud to gauge the trend strength and potential reversals. The Ichimoku cloud is a comprehensive trend trading system that uses multiple indicators to identify the trend direction and potential support and resistance levels.
The strategy also incorporates a neural network algorithm to generate buy and sell signals. The neural network uses a combination of momentum, trend, and volatility indicators to generate a signal. The signal is then compared to a dynamic threshold to determine whether a trade should be taken.
The dynamic threshold is calculated based on the volatility of the market and the adaptive strength of the indicator. The adaptive strength is a parameter that determines how responsive the indicator is to changes in the market. A higher adaptive strength means that the indicator will be more responsive to changes in the market, while a lower adaptive strength means that the indicator will be less responsive.
The strategy also includes a number of other features, such as a market condition filter and a trading logic system. The market condition filter is used to determine whether the market is stable or volatile, and the trading logic system is used to generate buy and sell signals based on the indicator's calculations.
Overall, the Phoenix AI Strategy is a sophisticated trading algorithm that combines multiple technical indicators and adaptive elements to generate buy and sell signals. Its combination of volatility, trend, and momentum indicators makes it a versatile and effective tool for traders of all levels.
Each part of the strategy ties into other parts to create a comprehensive trading system. The volatility ratio is used to adjust the dynamic RSI parameters, which are then used to identify overbought and oversold conditions in the market. The moving average channel is used to identify the trend direction and potential support and resistance levels, while the Ichimoku cloud is used to gauge the trend strength and potential reversals.
The neural network algorithm uses a combination of momentum, trend, and volatility indicators to generate a signal, which is then compared to a dynamic threshold to determine whether a trade should be taken. The dynamic threshold is calculated based on the volatility of the market and the adaptive strength of the indicator, making it a key component of the strategy's risk management system.
The logic behind the strategy is to use a combination of technical indicators and adaptive algorithms to generate buy and sell signals. The strategy is designed to be flexible and adaptable to different market conditions, and can be customized using a number of input parameters. The strategy's calculations are based on a combination of technical indicators and market data, and are designed to provide a comprehensive view of the market.
Each indicator used in the strategy is doing a specific job. The ATR indicator is used to calculate the volatility of the market, while the RSI indicator is used to identify overbought and oversold conditions. The moving average channel is used to identify the trend direction and potential support and resistance levels, while the Ichimoku cloud is used to gauge the trend strength and potential reversals. The neural network algorithm is used to generate buy and sell signals based on a combination of momentum, trend, and volatility indicators.
Overall, the Phoenix AI Strategy is a powerful and flexible trading tool that can be used to generate buy and sell signals in a variety of markets. Its combination of technical indicators and adaptive algorithms makes it a versatile and effective tool for traders of all levels.

Cyber Strategy V1Сyber Strategy V1 – Indicator Testing & Strategy Execution Framework
✅ Overview
Cyber Strategy V1 is a closed-source strategy framework engineered to turn any of yours external indicator into a systematic, rule-based trading system. Designed for rigorous testing and live deployment, it combines multi-signal inputs, confirmations and automated execution paths to help traders and developers validate signal quality and manage risk with precision.
✅ Core Functionality
Multi-Source Independent Signal Inputs
Reversal Logic
Take Profit: up to 5 staggered TP levels, specified as percentage
Stop Loss: configurable via fixed percentage or dynamic SL that trails a reverse signals.
✅ Statistical Drawdown Analysis
For all profitable trades, tracks the maximum intratrade drawdown.
Computes percentile levels of profitable trades that hits minimum drawdowns to inform:
Entry buffer zones (e.g. avoid entering during transient noise)
Partial entry scaling prices.
✅ Signal Confirmation
Optional confirmation delays: hold entry until other signal section send a confirmation from another indicator.
✅ Automated Execution Integrations
Cornix Text Alerts: Generates pre-formatted alerts compatible with Cornix for semi-automated or bot trading.
Webhook Support: Emits JSON payloads on order-fill events to any endpoint, enabling full automation through third-party services or custom order-routing systems.
Important Notes
⚠️ THIS STRATEGY DOES NOT INCLUDE INDICATORS. Examples shown on screenshots use third-party tools. NO PROPRIETARY INDICATORS INCLUDED: Cyber Strategy V1 relies entirely on external signal inputs.
⚠️ All backtesting parameters are customizable; thorough backtesting under realistic slippage, fees and spread assumptions is essential before live deployment.

rsi indicatorRSIBB Strategy Based on Oversold, Overrbuy Bolinger Band Band. In US 30. Time Indicators is set and the timing is in 5 minutes
An example of Long. When the green marker appears, our entry point is High High If the price fails to reject our High High, our entry will change to the next candlestick. This process will continue until we enter the position.
A marker appears in purple when the green marker appears to us, in which information appears:
The first digit related to the strategist code
The second digit is that we have a few pips to be sure of the candlestick of our entry point
The third digit is our SL that is a coefficient of overall size of yogurt (HIGH - LOW)
Charmin is the digit of our tp that is a coefficient of overall size of yogurt (HIGH - LOW)
In 6 sets

ICT 2022 Mentorship Model StrategyICT 2022 Mentorship Model Strategy
Introduction
This publication introduces the "ICT 2022 Mentorship Model Strategy," a systematic trading approach based on the Inner Circle Trader concepts. Designed for traders looking to identify institutional footprints in the market, this strategy captures high-probability setups by recognizing specific price action sequences.
Overview
The strategy implements the core principles from the ICT 2022 Mentorship model, focusing on a three-step sequence: Liquidity Sweep (LS), Market Structure Shift (MSS) with Displacement, and Entry via Fair Value Gaps (FVG). It's optimized for cryptocurrency markets on the 5-minute timeframe, with optional higher timeframe bias filtering.
Indicators & Libraries:
OrderBlockRefiner : Leverages TFlab's OrderBlockRefiner library for precise setup identification
OrderBlockDrawing : Utilizes TFlab's visualization system for clear market analysis
FVGDetectorLibrary : Employs TFlab's FVG detection algorithm to identify Fair Value Gaps
Strategy Core Components:
Liquidity Sweeps (LS) : Detects when price moves above a swing high or below a swing low, triggering stop orders before reversing
Market Structure Shifts (MSS) : Identifies clear breaks of near-term swing points in the opposite direction to the liquidity sweep
Fair Value Gaps (FVG) : Recognizes three-candle patterns indicating price imbalances, often left behind by strong directional moves
Strategy Settings:
Swing Period : Default at 50, determines the lookback for swing high/low points
FVG Length : Default at 120, sets how long Fair Value Gaps remain active for trading
MSS Length : Default at 80, determines the window for detecting market structure shifts
FVG Filtering : Optional width filter with selectable aggressiveness (Very Aggressive to Very Defensive)
Entry Level : Configurable to Proximal, 50% OB, or Distal positions within the FVG
Entry Methods:
The strategy offers multiple entry approaches to accommodate different trading styles:
Proximal Touch Market : Enters immediately when price touches the FVG boundary
FVG Level Limit Order : Places a limit order at the specified FVG level
Candle Close Inside FVG : Enters only when a candle closes inside the FVG area
Exit Conditions:
Stop Loss Placement : Multiple methods including MSS Swing Point, FVG Distal, Liquidity Sweep Extreme, and more
Take Profit : Risk-to-reward based targets with a default 1.5R setting
Buffer Settings : Configurable stop-loss buffer as a percentage of the risk distance
Risk Management Features:
Time Filtering : Optional trading during specific "Kill Zones" (Asian, London, New York sessions)
HTF Bias Filtering : Option to align trades with higher timeframe trends
Volume Filtering : Ensures FVG creation occurs on significant volume
Consecutive Loss Protection : Automatically pauses trading after 3 consecutive losses for 4 hours
Statistics Dashboard : Real-time performance metrics including win rate, profit factor, and drawdown
The strategy is optimized for BYBIT:BTCUSDT.P and other major cryptocurrency pairs, particularly effective on 5-minute charts for intraday trading. But ofcourse this is also applicable for any markets like stocks, forex, commodities and indicies.
Visual Features:
This implementation includes comprehensive visualization of FVGs, market structure shifts, and liquidity levels. Active trade management displays show entry points, stop-loss levels, and take-profit targets, with color-coded bars during active trades.
I've spent significant time creating this complete implementation of the ICT 2022 Mentorship concepts. The strategy includes robust risk management, flexible entry methods, and advanced filtering options. Feel free to adjust the settings to suit your trading style - detailed tooltips are provided for each parameter.
Acknowledgements:
Special thanks to TFlab for the excellent libraries and the basis of the indicator that power this strategy's core functionality:
- OrderBlockRefiner_TradingFinder
- OrderBlockDrawing_TradingFinder
- FVGDetectorLibrary
Special Thanks to the PH community that is helping me learn, practice, and apply these into my daily trading for free - THE ASCENT!
PS.
Note you can always turn the visuals on or off from the style tab/section of the indicator
For a clean chart, I recommend turning the Background Color of HTF Bias, as well as bar colors to OFF, but for refrence you can always turn it back on.
Also, feel free to customize the colors, lines, background, to your preference.
Disclaimer
This strategy is shared for educational purposes only and must be thoroughly tested under diverse market conditions. Past performance does not guarantee future results. Trading cryptocurrencies involves substantial risk of loss and is not suitable for every investor. The effectiveness of this strategy can change with market conditions - what works in one period may not work in another. Always use proper risk management.

Ichimoku Cloud Breakout Only LongThis is a very simple trading strategy based exclusively on the Ichimoku Cloud. There are no additional indicators or complex rules involved. The key condition is that we only open long positions when the price is clearly above the cloud — indicating a bullish trend.
For optimal results, the recommended timeframes are 1D (daily) or 1W (weekly) charts. These higher timeframes help filter out market noise and provide more reliable trend signals.
We do not short the market under any circumstances. The focus is purely on riding upward momentum when the price breaks out or stays above the cloud.
This strategy works best when applied to growth stocks with strong upward trends and good fundamentals — such as Google (GOOGL), Tesla (TSLA), Apple (AAPL), or NVIDIA (NVDA).

ATF DonMiguel V3ATF Don Miguel V3
This strategy combines trend-following with price structure and momentum analysis:
Trend shifts are detected using adaptive bands based on EMAs and volatility.
A trade is only triggered when the following additional conditions are met:
a Fair Value Gap (FVG) is present in the price structure,
the RSI is in overbought (for Short) or oversold (for Long) territory,
and volume is significantly above average.
Positions are managed using a dynamic ATR-based trailing stop.
Goal: Only trade high-quality signals when trend, structure, momentum, and volume all align.

Algo BOT 3.0 IndicatorAlgo BOT 3.0 is a multi-layered reversal detection tool designed for 30-minute and higher timeframes, ideal for intraday or swing trading.
Key Features:
1. Pivot Level Interactions:
- Detects candles that touch daily pivot levels (R1-R4, S1-S4, Pivot).
- Confirms valid signals using high/low conditions.
2. Fibonacci-Based Candle Zones:
- Auto-detects large green/red candles.
- Calculates intra-candle Fibonacci retracement levels (0.382, 0.618).
- Marks potential retracement/reaction zones.
3. CPR Zone Detection:
- Shows Top CPR & Bottom CPR from daily high/low/pivot.
- Detects price interaction with CPR for reaction signals.
4. VWAP + MVWAP Filtering:
- Uses VWAP and a custom-length MVWAP (default 50).
- Helps confirm institutional support/resistance zones.
5. Trend Indicators:
- Includes RSI, SMA, EMA for manual trend/direction analysis.
6. Visual Alerts:
- Triangles appear when valid support/resistance touch candles form.
- Pivot and CPR levels are plotted with clear color coding.
Note:
This is a closed-source script due to its original logic combining multiple professional-grade concepts. It offers a structured and unique way to detect pivot-based reversals and breakout zones.
Best used on 30-minute or higher timeframes.
