Neural Network Buy and Sell SignalsTrend Architect Suite Lite - Neural Network Buy and Sell Signals
Advanced AI-Powered Signal Scoring
This indicator provides neural network market analysis on buy and sell signals designed for scalpers and day traders who use 30s to 5m charts. Signals are generated based on an ATR system and then filtered and scored using an advanced AI-driven system.
Features
Neural Network Signal Engine
5-Layer Deep Learning analysis combining market structure, momentum, and market state detection
AI-based Letter Grade Scoring (A+ through F) for instant signal quality assessment
Normalized Input Processing with Z-score standardization and outlier clipping
Real-time Signal Evaluation using 5 market dimensions
Advanced Candle Types
Standard Candlesticks - Raw price action
Heikin Ashi - Trend smoothing and noise reduction
Linear Regression - Mathematical trend visualization
Independent Signal vs Display - Calculate signals on one type, display another
Key Settings
Signal Configuration
- Signal Trigger Sensitivity (Default: 1.7) - Controls signal frequency vs quality
- Stop Loss ATR Multiplier (Default: 1.5) - Risk management sizing
- Signal Candle Type (Default: Candlesticks) - Data source for signal calculations
- Display Candle Type (Default: Linear Regression) - Visual candle display
Display Options
- Signal Distance (Default: 1.35 ATR) - Label positioning from price
- Label Size (Default: Medium) - Optimal readability
Trading Applications
Scalping
- Fast pace signal detection with quality filtering
- ATR-based stop management prevents signal overlap
- Neural network attempts to reduces false signals in choppy markets
Day Trading
- Multi-timeframe compatible with adaptation settings
- Clear trend visualization with Linear Regression candles
- Support/resistance integration for better entries/exits
Signal Filtering
- Use A+/A grades for highest probability setups
- B grades for confirmation in trending markets
- C-F grades help identify market uncertainty
Why Choose Trend Architect Lite?
No Lag - Real-time neural network processing
No Repainting - Signals appear and stay fixed
Clean Charts - Focus on price action, not indicators
Smart Filtering - AI reduces noise and false signals
Flexible and customizable - Works across all timeframes and instruments
Compatibility
- All Timeframes - 1m to Monthly charts
- All Instruments - Forex, Crypto, Stocks, Futures, Indices
Risk Disclaimer
This indicator is a tool for technical analysis and should not be used as the sole basis for trading decisions. Past performance does not guarantee future results. Always use proper risk management and never risk more than you can afford to lose.
Indicators and strategies

Trend Strength Index [Alpha Extract]The Trend Strength Index leverages Volume Weighted Moving Average (VWMA) and Average True Range (ATR) to quantify trend intensity in cryptocurrency markets, particularly Bitcoin. The combination of VWMA and ATR is particularly powerful because VWMA provides a more accurate representation of the market's true average price by weighting periods of higher trading volume more heavily—capturing genuine momentum driven by increased participation rather than treating all price action equally, which is crucial in volatile assets like Bitcoin where volume spikes often signal institutional interest or market shifts.
Meanwhile, ATR normalizes this measurement for volatility, ensuring that trend strength readings remain comparable across different market conditions; without ATR's adjustment, raw price deviations from the mean could appear artificially inflated during high-volatility periods (like during news events or liquidations) or understated in low-volatility sideways markets, leading to misleading signals. Together, they create a volatility-adjusted, volume-sensitive metric that reliably distinguishes between meaningful trend developments and noise.
This indicator measures the normalized distance between price and its volume-weighted mean, providing a clear visualization of trend strength while accounting for market volatility. It helps traders identify periods of strong directional movement versus consolidation, with color-coded gradients for intuitive interpretation.
🔶 CALCULATION
The indicator processes price data through these analytical stages:
Volume Weighted Moving Average: Computes a smoothed average weighted by trading volume
Volatility Normalization: Uses ATR to account for market volatility
Distance Measurement: Calculates absolute deviation between current price and VWMA
Strength Normalization: Divides price deviation by ATR for a volatility-adjusted metric
Formula:
VWMA = Volume-Weighted Moving Average of Close over specified length
ATR = Average True Range over specified length
Price Distance = |Close - VWMA|
Trend Strength = Price Distance / ATR
🔶 DETAILS Visual Features:
VWMA Line: Blue line overlay on the price chart representing the volume-weighted mean
Trend Strength Area: Histogram-style area plot with dynamic color gradient (red for weak trends, transitioning through orange and yellow to green for strong trends)
Threshold Line: Horizontal red line at the customizable Trend Enter level
Background Highlight: Subtle green background when trend strength exceeds the enter threshold for strong trend visualization
Alert System: Triggers notifications for strong trend detection
Interpretation:
0-Weak (Red): Minimal trend strength, potential consolidation or ranging market
Mid-Range (Orange/Yellow): Building momentum, watch for breakout potential
At/Above Enter Threshold (Green): Strong trend conditions, potential for continued directional moves
Threshold Crossing: Trend strength crossing above the enter level signals increasing conviction in the current direction
Color Transitions: Gradual shifts from warm (red/orange) to cool (green) tones indicate strengthening trends
🔶 EXAMPLES
Strong Trend Entry: When trend strength crosses above the enter threshold (e.g., 1.2), it identifies the onset of a powerful move where price deviates significantly from the mean.
Example: During a rally, trend strength rising from yellow (around 1.0) to green (1.2+) often precedes sustained upward momentum, providing entry opportunities for trend followers.
Consolidation Detection: Low trend strength values in red shades (below 0.5) highlight periods of low volatility and mean reversion potential.
Example: After a sharp sell-off, persistent red values signal a likely sideways phase, allowing traders to avoid whipsaws and wait for orange/yellow transitions as a precursor to recovery.
Volatility-Adjusted Pullbacks: In volatile markets, the ATR component ensures trend strength remains accurate; a dip back to yellow from green during minor corrections can indicate healthy pullbacks within a strong trend.
Example: Trend strength briefly falling to yellow levels (e.g., 0.8-1.1) after hitting green provides profit-taking signals without invalidating the overall bullish bias if the VWMA holds as support.
Threshold Alert Integration: The alert condition combines strength value with the enter threshold for timely notifications.
Example: Receiving a "Strong Trend Detected" alert when the area plot turns green helps confirm Bitcoin's breakout from consolidation, aligning with increased volume for higher-probability trades.
🔶 SETTINGS
Customization Options:
Lengths: VWMA length (default 14), ATR length (default 14)
Thresholds: Trend enter (default 1.2, step 0.1), trend exit (default 1.15, for potential future signal enhancements)
Visuals: Automatic color scaling with red at 0, transitioning to green at/above enter threshold
Alert Conditions: Strong trend detection (when strength > enter)
The Trend Strength Index equips traders with a robust, easy-to-interpret tool for gauging trend intensity in volatile markets like Bitcoin. By normalizing price deviations against volatility, it delivers reliable signals for identifying high-momentum opportunities while the gradient coloring and alerts facilitate quick assessments in both trending and choppy conditions.

ICT Concepts [LuxAlgo//@version=5
indicator("Full Entry: RSI + EMA + CHoCH + FVG + TP/SL", overlay=true)
rsiPeriod = 14
emaPeriod = 50
tpPerc = 1.5
slPerc = 1.0
is15min = timeframe.period == "15" // يشتغل فقط على فريم 15 دقيقة
rsi = ta.rsi(close, rsiPeriod)
ema = ta.ema(close, emaPeriod)
// قمة وقاع سابقة
ph = ta.highest(high, 20)
pl = ta.lowest(low, 20)
// CHoCH
bullCHoCH = close > ph and close > ema
bearCHoCH = close < pl and close < ema
// FVG حساب
fvgUp = low > high
fvgDn = high < low
fvgHigh = high
fvgLow = low
touchFVGUp = fvgUp and low <= fvgHigh and low >= fvgLow
touchFVGDown = fvgDn and high >= fvgLow and high <= fvgHigh
// دخول فقط بفريم 15 دقيقة + لمس FVG
longEntry = is15min and bullCHoCH and rsi < 35 and touchFVGUp
shortEntry = is15min and bearCHoCH and rsi > 65 and touchFVGDown
// TP/SL
longTP = close * (1 + tpPerc / 100)
longSL = close * (1 - slPerc / 100)
shortTP = close * (1 - tpPerc / 100)
shortSL = close * (1 + slPerc / 100)
// إشارات دخول
plotshape(longEntry, location=location.belowbar, color=color.green, style=shape.labelup, text="BUY")
plotshape(shortEntry, location=location.abovebar, color=color.red, style=shape.labeldown, text="SELL")
// TP / SL
plot(longEntry ? longTP : na, style=plot.style_cross, color=color.green)
plot(longEntry ? longSL : na, style=plot.style_cross, color=color.red)
plot(shortEntry ? shortTP : na, style=plot.style_cross, color=color.red)
plot(shortEntry ? shortSL : na, style=plot.style_cross, color=color.green)
// EMA
plot(ema, title="EMA 50", color=color.orange)
// FVG رسم
boxFVG = fvgUp or fvgDn
var box fvgBox = na
if boxFVG
fvgBox := box.new(left=bar_index, top=fvgHigh, right=bar_index + 3, bottom=fvgLow, border_color=color.gray, bgcolor=color.new(color.gray, 85))
// تنبيهات
alertcondition(longEntry, title="Buy Signal", message="Buy: CHoCH + RSI + EMA + FVG")
alertcondition(shortEntry, title="Sell Signal", message="Sell: CHoCH + RSI + EMA + FVG")

DrFx Algo MA💎 (V.3.2)🚀 Introducing DrFx Algo MA💎 (V 3.2) – The All-in-One Trading Assistant!
Turn your charts into a powerhouse of precision and clarity.
🔍 What makes DrFx Algo unique?
✅ Smart Candle Coloring – Instantly visualize market sentiment with vibrant, real-time candle colors:
🟢 Green for bullish trends
🔴 Red for bearish movements
💜 Violet & Rose candles highlight EMA proximity for potential trend shifts
📊 Advanced Trend Detection – Dual EMA overlays (20 & 50) clearly define the market's direction. Blue for uptrend, Red for downtrend. Simple, visual, and effective.
📈 Zero Lag EMA (ZLEMA) – Capture fast movements before the crowd. React quicker to market momentum with less delay than traditional EMAs.
🎯 Built-in RSI Alerts – Automatic triangle markers for overbought and oversold levels. Catch early reversal signals without watching RSI manually.
🔔 Smart Alerts System – Get notified instantly with bullish and bearish triggers, right when it matters.
📉 Support & Resistance Auto-Zones – Automatically plots dynamic levels using pivot detection. No more guessing key price zones.
📋 Customizable Trade Dashboard – Input your entries, SL/TP, and trade type. Stay organized with a clean, modern on-screen table. Fully editable.
🧪 Perfect for:
Trend traders
Momentum scalpers
EMA/RSi strategy followers
Visual learners
💼 Whether you’re a day trader or swing trader, DrFx Algo MA💎 gives you the clarity, speed, and edge you need in the market.
💬 Need help with access, backtesting, or have any questions about our indicators?
Our support team is available 24/7 on Telegram.
Just reach out through the link below: 👉https://t.me/Drfxai
“You can reach out by searching this username Drfxai”

ZZUltraOverview:
ZZUltra is a powerful price action filter designed to identify significant swing highs and lows by eliminating market noise. Unlike the default, this version offers enhanced customization and dynamic behavior, making it ideal for trend analysis, pattern recognition, and timing entries/exits. Note that it is a lagging indicator and for the optimized live version go to Ultraalgo.com
Key Features:
📏 Adjustable Depth, Deviation & Backstep: Fine-tune how sensitive the indicator is to price reversals.
🔍 Dynamic Labeling: Mark each swing with customizable labels (e.g., UltraBuy/UltraShort).
🎨 Clean Visuals: Optional colored lines and markers that clearly connect turning points without overwhelming your chart.
🧠 Built-in Smart Filtering: Filters out minor fluctuations to focus on meaningful market structure.
🧰 Multi-Timeframe Compatible: Works across any timeframe for both scalpers and swing traders.
Use Cases:
Confirming trend structure (e.g., higher highs/lows in uptrends).
Identifying key reversal points.
Recognizing patterns like head & shoulders or double tops.
Combining with RSI, MACD, or volume for confluence.

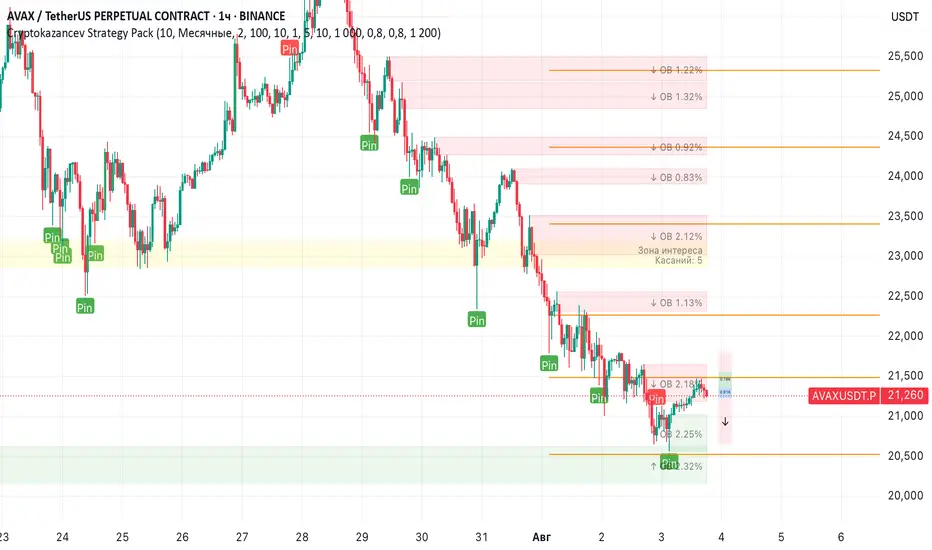
Cryptokazancev Strategy PackCryptokazancev Strategy Pack
Комплексный инструмент для анализа рыночной структуры / Comprehensive Market Structure Analysis Tool
🇷🇺 Описание на русском
Cryptokazancev Strategy Pack by ZeeZeeMon - это мощный набор инструментов для технического анализа, включающий:
• Ордерблоки (Order Blocks) с настройкой количества и цветов
• Пивоты (Pivot Points) различных таймфреймов
• Рыночную структуру с зонами Фибоначчи (0.618, 0.786)
• Разворотные конструкции (пинбары и поглощения)
• Зоны интереса на основе скопления свингов
📊 Основные функции:
1. Ордерблоки
- Автоматическое определение бычьих/медвежьих OB
- Настройка максимального количества блоков (до 30)
- Кастомизация цветов
2. Пивоты
- Поддержка таймфреймов: Дневные/Недельные/Месячные/Квартальные/Годовые
- Уровни Camarilla (P, R1-R4, S1-S4)
3. Рыночная структура
- Четкое определение тренда (UP/DOWN)
- Ключевые уровни Фибо (0.618 и 0.786)
- Настройка глубины анализа (10-1000 баров)
4. Разворотные конструкции
- Обнаружение пинбаров
- Обнаружение поглощений
- Настройка чувствительности
5. Зоны интереса
- Алгоритм кластеризации свингов
- Настройка через ATR-мультипликатор
- Лимит отображаемых зон
🇬🇧 English Description
ZeeZeeMon Pack is a comprehensive market analysis toolkit featuring:
• Order Blocks with customizable count and colors
• Pivot Points for multiple timeframes
• Market Structure with Fibonacci zones
• Reversal patterns (pinbars and engulfings)
• Interest Zones based on swing clustering
📊 Key Features:
1. Order Blocks
- Auto-detection of bullish/bearish OB
- Configurable max blocks (up to 30)
- Custom color schemes
2. Pivot Points
- Supports: Daily/Weekly/Monthly/Quarterly/Yearly
- Camarilla levels (P, R1-R4, S1-S4)
3. Market Structure
- Clear trend detection (UP/DOWN)
- Key Fibonacci levels (0.618 & 0.786)
- Adjustable analysis depth (10-1000 bars)
4. Reversal Patterns
- Smart pinbar detection
- ATR-based engulfing filter
- Sensitivity adjustment
5. Interest Zones
- Swing clustering algorithm
- ATR-multiplier configuration
- Display limit (up to 10 zones)
⚙️ Technical Highlights:
• Built with Pine Script v5
• Performance-optimized
• Well-commented code
• Flexible settings system
⚠️ Важно / Important:
Индикатор в бета-версии. Тестируйте перед использованием в реальной торговле.
This is BETA version. Please test before live trading.
💬 Поддержка / Support:
Комментарии к скрипту / Script comments section
J值极值趋势跟随策略J-Zone & 检测3分钟周期信号
EMA 676均线上方只做多
EMA 676均线下方只做空
当J线达到极值100后,并且连续3根K线J OKX:ETHUSDT.P OKX:ETHUSDT.P 值连续上涨开始回落,开空单
当J线达到极值0后,并且连续3根K线J值连续下跌开始上涨,开多单
1. Only consider long positions when the price is above the EMA676.
2. Only consider short positions when the price is below the EMA676.
3. If the J value reaches the extreme of 100, and there are 3 consecutive candles where the J value increases, then the first downturn in J triggers a short entry.
4. If the J value reaches the extreme of 0, and there are 3 consecutive candles where the J value decreases, then the first upturn in J triggers a long entry.

RSI-Stochastic Combined Oscillator(Mastersinnifty)Description
The RSI-Stochastic Combined Oscillator blends the strengths of RSI and Stochastic indicators to offer a refined view of market momentum. This custom oscillator highlights high-probability turning points using both value crossovers and directional momentum filters. Enhanced signal logic distinguishes between strong and weak trade setups.
How It Works
Calculates RSI and Stochastic %K using user-defined lengths.
Generates a combined oscillator by averaging RSI and Stochastic %K.
Smoothes the output with configurable MA for clarity.
Generates bullish/bearish signals based on crossover logic and momentum strength.
Includes overbought/oversold zones and background color warnings.
Optional signal table displays real-time values for RSI, Stochastic, Combo, and Signal Line.
Inputs
RSI Length – Period for RSI calculation.
Stochastic %K/%D Length – Periods for Stochastic values.
Combined Oscillator Smoothing – Moving average smoothing period.
Overbought/Oversold Levels – Thresholds for signal filtering and background alerts.
Use Case
Ideal for traders looking to:
Confirm entries using dual momentum logic.
Filter out noise with smoothed oscillators.
Identify high-conviction reversal zones.
Receive alerts based on strong and weak momentum shifts.
Disclaimer
This indicator is designed for educational purposes only and does not constitute financial advice. Always conduct your own analysis before making trading decisions.

BERLIN-MAX 1V.5BERLIN-MAX 1V.5 is a comprehensive trading indicator designed for TradingView that combines multiple advanced strategies and tools. It integrates EMA crossover signals, UT Bot logic with ATR-based trailing stops, customizable stop-loss and target multipliers per timeframe, Hull Moving Averages with color-coded trends, linear regression channels for support and resistance, and a multi-timeframe RSI and volume signal table. This script aims to provide clear entry and exit signals for scalping and swing trading, enhancing decision-making across different market conditions.

Advanced Forex Currency Strength Meter
# Advanced Forex Currency Strength Meter
🚀 The Ultimate Currency Strength Analysis Tool for Forex Traders
This sophisticated indicator measures and compares the relative strength of major currencies (EUR, GBP, USD, JPY, CHF, CAD, AUD, NZD) to help you identify the strongest and weakest currencies in real-time, providing clear trading signals based on currency strength differentials.
## 📊 What This Indicator Does
The Advanced Forex Currency Strength Meter analyzes currency relationships across 28+ major forex pairs and 8 currency indices to determine which currencies are gaining or losing strength. Instead of relying on individual pair analysis, this tool gives you a bird's-eye view of the entire forex market, helping you:
Identify the strongest and weakest currencies at any given time
Find high-probability trading opportunities by pairing strong vs weak currencies
Avoid ranging markets by detecting when currencies have similar strength
Get clear LONG/SHORT/NEUTRAL signals for your current trading pair
Optimize your trading strategy based on your preferred timeframe and holding period
## ⚙️ How The Indicator Works
### Dual Calculation Method
The indicator uses a sophisticated dual approach for maximum accuracy:
Pairs-Based Analysis: Calculates currency strength from 28+ major forex pairs (EURUSD, GBPUSD, USDJPY, etc.)
Index-Based Analysis: Incorporates official currency indices (DXY, EXY, BXY, JXY, CXY, AXY, SXY, ZXY)
Weighted Combination: Blends both methods using smart weighting for enhanced accuracy
### Smart Auto-Optimization System
The indicator automatically adjusts its parameters based on your chart timeframe and intended holding period:
The system recognizes that scalping requires different sensitivity than swing trading, automatically optimizing lookback periods, analysis timeframes, signal thresholds, and index weights.
### Strength Calculation Process
Fetches price data from multiple timeframes using optimized tuple requests
Calculates percentage change over the specified lookback period
Optionally normalizes by ATR (Average True Range) to account for volatility differences
Combines pair-based and index-based calculations using dynamic weighting
Generates relative strength by comparing base currency vs quote currency
Produces clear trading signals when strength differential exceeds threshold
## 🎯 How To Use The Indicator
### Quick Start
Add the indicator to any forex pair chart
Enable 🧠 Smart Auto-Optimization (recommended for beginners)
Watch for LONG 🚀 signals when the relative strength line is green and above threshold
Watch for SHORT 🐻 signals when the relative strength line is red and below threshold
Avoid trading during NEUTRAL ⚪ periods when currencies have similar strength
Note: This is highly recommended to couple this indicator with fundamental analysis and use it as an extra signal.
### 📋 Parameters Reference
#### 🤖 Smart Settings
🧠 Smart Auto-Optimization: (Default: Enabled) Automatically optimizes all parameters based on chart timeframe and trading style
#### ⚙️ Manual Override
These settings are only active when Smart Auto-Optimization is disabled:
Manual Lookback Period: (Default: 14) Number of periods to analyze for strength calculation
Manual ATR Period: (Default: 14) Period for ATR normalization calculation
Manual Analysis Timeframe: (Default: 240) Higher timeframe for strength analysis
Manual Index Weight: (Default: 0.5) Weight given to currency indices vs pairs (0.0 = pairs only, 1.0 = indices only)
Manual Signal Threshold: (Default: 0.5) Minimum strength differential required for trading signals
#### 📊 Display
Show Signal Markers: (Default: Enabled) Display triangle markers when signals change
Show Info Label: (Default: Enabled) Show comprehensive information label with current analysis
#### 🔍 Analysis
Use ATR Normalization: (Default: Enabled) Normalize strength calculations by volatility for fairer comparison
#### 💰 Currency Indices
💰 Use Currency Indices: (Default: Enabled) Include all 8 currency indices in strength calculation for enhanced accuracy
#### 🎨 Colors
Strong Currency Color: (Default: Green) Color for positive/strong signals
Weak Currency Color: (Default: Red) Color for negative/weak signals
Neutral Color: (Default: Gray) Color for neutral conditions
Strong/Weak Backgrounds: Background colors for clear signal visualization
### 🧠 Smart Optimization Profiles
The indicator automatically selects optimal parameters based on your chart timeframe:
#### ⚡ Scalping Profile (1M-5M Charts)
For positions held for a few minutes:
Lookback: 5 periods (fast/sensitive)
Analysis Timeframe: 15 minutes
Index Weight: 20% (favor pairs for speed)
Signal Threshold: 0.3% (sensitive triggers)
#### 📈 Intraday Profile (10M-1H Charts)
For positions held for a few hours:
Lookback: 12 periods (balanced sensitivity)
Analysis Timeframe: 4 hours
Index Weight: 40% (balanced approach)
Signal Threshold: 0.4% (moderate sensitivity)
#### 📊 Swing Profile (4H-Daily Charts)
For positions held for a few days:
Lookback: 21 periods (stable analysis)
Analysis Timeframe: Daily
Index Weight: 60% (favor indices for stability)
Signal Threshold: 0.5% (conservative triggers)
#### 📆 Position Profile (Weekly+ Charts)
For positions held for a few weeks:
Lookback: 30 periods (long-term view)
Analysis Timeframe: Weekly
Index Weight: 70% (heavily favor indices)
Signal Threshold: 0.6% (very conservative)
### Entry Timing
Wait for clear LONG 🚀 or SHORT 🐻 signals
Avoid trading during NEUTRAL ⚪ periods
Look for signal confirmations on multiple timeframes
### Risk Management
Stronger signals (higher relative strength values) suggest higher probability trades
Use appropriate position sizing based on signal strength
Consider the trading style profile when setting stop losses and take profits
💡 Pro Tip: The indicator works best when combined with your existing technical analysis. Use currency strength to identify which pairs to trade, then use your favorite technical indicators to determine when to enter and exit.
## 🔧 Key Features
28+ Forex Pairs Analysis: Comprehensive coverage of major currency relationships
8 Currency Indices Integration: DXY, EXY, BXY, JXY, CXY, AXY, SXY, ZXY for enhanced accuracy
Smart Auto-Optimization: Automatically adapts to your trading style and timeframe
ATR Normalization: Fair comparison across different currency pairs and volatility levels
Real-Time Signals: Clear LONG/SHORT/NEUTRAL signals with visual markers
Performance Optimized: Efficient tuple-based data requests minimize external calls
User-Friendly Interface: Simplified settings with comprehensive tooltips
Multi-Timeframe Support: Works on any timeframe from 1-minute to monthly charts
Transform your forex trading with the power of currency strength analysis! 🚀

Adaptive Market Profile – Auto Detect & Dynamic Activity ZonesAdaptive Market Profile is an advanced indicator that automatically detects and displays the most relevant trend channel and market profile for any asset and timeframe. Unlike standard regression channel tools, this script uses a fully adaptive approach to identify the optimal period, providing you with the channel that best fits the current market dynamics. The calculation is based on maximizing the statistical significance of the trend using Pearson’s R coefficient, ensuring that the most relevant trend is always selected.
Within the selected channel, the indicator generates a dynamic market profile, breaking the price range into configurable zones and displaying the most active areas based on volume or the number of touches. This allows you to instantly identify high-activity price levels and potential support/resistance zones. The “most active lines” are plotted in real-time and always stay parallel to the channel, dynamically adapting to market structure.
Key features:
- Automatic detection of the optimal regression period: The script scans a wide range of lengths and selects the channel that statistically represents the strongest trend.
- Dynamic market profile: Visualizes the distribution of volume or price touches inside the trend channel, with customizable section count.
- Most active zones: Highlights the most traded or touched price levels as dynamic, parallel lines for precise support/resistance reading.
- Manual override: Optionally, users can select their own channel period for full control.
- Supports both linear and logarithmic charts: Simple toggle to match your chart scaling.
Use cases:
- Trend following and channel trading strategies.
- Quick identification of dynamic support/resistance and liquidity zones.
- Objective selection of the most statistically significant trend channel, without manual guesswork.
- Suitable for all assets and timeframes (crypto, stocks, forex, futures).
Originality:
This script goes beyond basic regression channels by integrating dynamic profile analysis and fully adaptive period detection, offering a comprehensive tool for modern technical analysts. The combination of trend detection, market profile, and activity zone mapping is unique and not available in TradingView built-ins.
Instructions:
Add Adaptive Market Profile to your chart. By default, the script automatically detects the optimal channel period and displays the corresponding regression channel with dynamic profile and activity zones. If you prefer manual control, disable “Auto trend channel period” and set your preferred period. Adjust profile settings as needed for your asset and timeframe.
For questions, suggestions, or further customization, contact Julien Eche (@Julien_Eche) directly on TradingView.


Ichimoku Trend CycleIchimoku Trend Cycle
A precision dual-trend system combining Ichimoku-based ATR Supertrends — engineered for clarity, reliability, and smart trend detection.
🔷 What is Ichimoku Trend Cycle?
The Ichimoku Trend Cycle harnesses the power of traditional Ichimoku analysis with modern ATR-based supertrend technology:
Alpha Trend: Primary trend detection using Ichimoku conversion & baseline logic
Beta Trend: Secondary confirmation trend with independent ATR calculations
Dual Confirmation Engine : Both trends must align for signal generation
This powerful combination delivers clean, non-repainting Buy/Sell signals while filtering out market noise and false breakouts.
🔍 How It Works
Blue Alpha + Red Beta Trends Align Bullish → BUY Signal
Both Trends Turn Bearish → SELL Signal
You get ONE signal per trend change — no spam, no noise, just crystal-clear direction changes.
⚙️ Core Features
✅ Ichimoku-Enhanced Supertrends
Traditional Ichimoku conversion/baseline logic powering modern ATR bands.
✅ Dual-Trend Confirmation
Alpha and Beta trends must agree — eliminates false signals.
✅ One Alert Per Trend Shift
Clean entries, zero noise, no repeated signals.
✅ Visual Excellence
Color-coded trend lines with high-contrast BUY/SELL labels.
✅ Fully Customizable
Independent settings for both trend systems plus smoothing options.
🎯 Perfect For
Swing Traders wanting confirmed trend changes
Position Traders seeking major trend shifts
Anyone who values clean charts with sharp decision points
🛠 Settings Breakdown
Alpha Trend Settings: Primary trend with conversion/baseline periods + ATR multiplier
Beta Trend Settings: Secondary confirmation trend with independent parameters
Smoothing MA Settings: Optional MA smoothing with Bollinger Bands support
Alert Settings: Customize signal confirmation periods
Candle Color Settings: Fully customizable trend and candle color schemes
✅ Built-in Smart Alerts — Never miss a trend change again
⚡ Zero-lag Performance — Works flawlessly across all timeframes
📈 Strategy-Ready Code — Professional-grade, non-repainting signals
Transform your trading with the precision of Ichimoku and the reliability of dual-trend confirmation.

AshishBediSPLAshishBediSPL: Dynamic Premium Analysis with Integrated Signals
This indicator provides a comprehensive view of combined options premiums by aggregating data from Call and Put contracts for a selected index and expiry. It integrates multiple popular technical indicators like EMA Crossover, Supertrend, VWAP, RSI, and SMA, allowing users to select their preferred tools for generating dynamic buy and sell signals directly on the premium chart.
AshishBediSPL" is a powerful TradingView indicator designed to analyze options premiums. It calculates a real-time combined premium for a chosen index (NIFTY, BANKNIFTY, FINNIFTY, etc.) and specific expiry date. You have the flexibility to visualize the premium of Call options, Put options, or a combined premium of both.
The indicator then overlays several popular technical analysis tools, which you can selectively enable:
EMA Crossover: Identify trend changes with configurable fast and slow Exponential Moving Averages.
Supertrend: Detect trend direction and potential reversal points.
VWAP (Volume Weighted Average Price): Understand the average price of the premium considering trading volume.
RSI (Relative Strength Index): Gauge momentum and identify overbought/oversold conditions.
SMA (Simple Moving Average): Analyze price smoothing and trend identification.
Based on your selected indicators, the tool generates clear "Buy" and "Sell" signals directly on the chart, helping you identify potential entry and exit points. Customizable alerts are also available to keep you informed.
Unlock a new perspective on options trading with "AshishBediSPL." This indicator focuses on the combined value of options premiums, giving you a consolidated view of market sentiment for a chosen index and expiry.
Instead of just looking at individual option prices, "AshishBediSPL" blends the Call and Put premiums (or focuses on one, based on your preference) and empowers you with a suite of built-in technical indicators: EMA, Supertrend, VWAP, RSI, and SMA. Pick the indicators that resonate with your strategy, and let the tool generate actionable buy and sell signals right on your chart. With customizable alerts, you'll never miss a crucial market move. Gain deeper insights and make more informed trading decisions with "AshishBediSPL.
Combined options premium: This accurately describes what your indicator calculates.
Selected index and expiry: Essential inputs for the indicator.
Call/Put options or combined: Explains the flexibility in data display.
Multiple technical indicators (EMA Crossover, Supertrend, VWAP, RSI, SMA): Lists the analysis tools included.
Buy/Sell signals: The primary output of the indicator.
Customizable alerts: A valuable feature for users.

NY Premarket – High/LowNY Premarket – High/Low
Displays two horizontal lines for the last completed New York pre‑market session (07:00–09:30 America/New_York):
Premarket High (top wick of the session)
Premarket Low (bottom wick of the session)
Both lines are anchored to the exact candles that formed the session’s high/low and remain aligned with those candles regardless of zooming or panning.ng or panning.
Wx2 Treasure Box – Enter like Institutional Wx2 Treasure Box – Enter like Institutional
✅ Green Treasure Box- Institutional Entry Logic
The core entry signal is based on institutional price action—detecting strong bullish or bearish momentum using custom volume and candle structure logic, revealing when smart money steps into the market.
✅ Orange Treasure Box – Missed Move Entry
Missed the main entry (Green Treasure Box- Institutional Entry Logic)?
Don't worry—this strategy intelligently marks late entry opportunities using the Orange Treasure Box, allowing you to catch high-probability trades even after the initial impulse.
• Designed for retracement-based entries
• Still offers favorable RRR (Risk-Reward Ratio)
• Ideal for traders who miss the first trigger
Note: If you miss the main move, you can enter via the Orange Treasure Box after the market confirms continuation.
🔍 Core Logic
• Identifies Institutional Entry with Institutional Bars (IBs) based on wide-body candles with high momentum
• Detects ideal entry zones where Triggers a Green / Orange Treasure Box for high-probability entries
🎯 Entry Rules
• Buy / Long entry
Plan : Above the Treasure Box (green / orange Box) and bullish candle appears
• Sell /Short entry
Plan : Below the Treasure Box (green / orange Box) and bearish candle appears
• Enter1: (2Lot Size)
Entry with 2 lots: Above Treasure Box (Green / Orange)
• Risk-to-Reward Ratio (RRR):
Target RRR of 1:2 is recommended
Stop Entries are placed using stop orders slightly above / below the Treasure Box
🎯 Add-On Entry on First Pullback
(Optional for Beginners / Compulsory for experienced)
After the first entry, the strategy allows one intelligent add-on position on the first valid pullback, defined by a color change candle followed by a continuation of the trend.
• Detects pullbacks dynamically
• Add-on only triggers once per original entry
• Improves position sizing with trend continuation
💰 Exit Strategy
o TP1 : 1:2
Exit 50% of position (1.5Lot)
Trail SL to entry
o TP2 : 1:3
50% of Remaining Quantity (0.75Lot)
Remaining 25% is trailed
Trailing Stop Loss (SL) using:
8 SMA trailing OR
Bar-by-Bar logic
(whichever is tighter, ensuring maximum profit protection without sacrificing momentum.)
✅ Use Cases
⚙ Best For:
• Scalpers and intraday traders
• Traders who follow Smart Money Concepts (SMC)
• Anyone looking to automate structured trade management
• Works well on crypto, stocks, indices, Forex.
• Works well on any time frame

swing_funThis is a very simple swing trading entry point indicator, design to be used on the indexes with the 4hr chart. It gives alerts whenever a long or short signal is found.

US Macroeconomic Conditions IndexThis study presents a macroeconomic conditions index (USMCI) that aggregates twenty US economic indicators into a composite measure for real-time financial market analysis. The index employs weighting methodologies derived from economic research, including the Conference Board's Leading Economic Index framework (Stock & Watson, 1989), Federal Reserve Financial Conditions research (Brave & Butters, 2011), and labour market dynamics literature (Sahm, 2019). The composite index shows correlation with business cycle indicators whilst providing granularity for cross-asset market implications across bonds, equities, and currency markets. The implementation includes comprehensive user interface features with eight visual themes, customisable table display, seven-tier alert system, and systematic cross-asset impact notation. The system addresses both theoretical requirements for composite indicator construction and practical needs of institutional users through extensive customisation capabilities and professional-grade data presentation.
Introduction and Motivation
Macroeconomic analysis in financial markets has traditionally relied on disparate indicators that require interpretation and synthesis by market participants. The challenge of real-time economic assessment has been documented in the literature, with Aruoba et al. (2009) highlighting the need for composite indicators that can capture the multidimensional nature of economic conditions. Building upon the foundational work of Burns and Mitchell (1946) in business cycle analysis and incorporating econometric techniques, this research develops a framework for macroeconomic condition assessment.
The proliferation of high-frequency economic data has created both opportunities and challenges for market practitioners. Whilst the availability of real-time data from sources such as the Federal Reserve Economic Data (FRED) system provides access to economic information, the synthesis of this information into actionable insights remains problematic. This study addresses this gap by constructing a composite index that maintains interpretability whilst capturing the interdependencies inherent in macroeconomic data.
Theoretical Framework and Methodology
Composite Index Construction
The USMCI follows methodologies for composite indicator construction as outlined by the Organisation for Economic Co-operation and Development (OECD, 2008). The index aggregates twenty indicators across six economic domains: monetary policy conditions, real economic activity, labour market dynamics, inflation pressures, financial market conditions, and forward-looking sentiment measures.
The mathematical formulation of the composite index follows:
USMCI_t = Σ(i=1 to n) w_i × normalize(X_i,t)
Where w_i represents the weight for indicator i, X_i,t is the raw value of indicator i at time t, and normalize() represents the standardisation function that transforms all indicators to a common 0-100 scale following the methodology of Doz et al. (2011).
Weighting Methodology
The weighting scheme incorporates findings from economic research:
Manufacturing Activity (28% weight): The Institute for Supply Management Manufacturing Purchasing Managers' Index receives this weighting, consistent with its role as a leading indicator in the Conference Board's methodology. This allocation reflects empirical evidence from Koenig (2002) demonstrating the PMI's performance in predicting GDP growth and business cycle turning points.
Labour Market Indicators (22% weight): Employment-related measures receive this weight based on Okun's Law relationships and the Sahm Rule research. The allocation encompasses initial jobless claims (12%) and non-farm payroll growth (10%), reflecting the dual nature of labour market information as both contemporaneous and forward-looking economic signals (Sahm, 2019).
Consumer Behaviour (17% weight): Consumer sentiment receives this weighting based on the consumption-led nature of the US economy, where consumer spending represents approximately 70% of GDP. This allocation draws upon the literature on consumer sentiment as a predictor of economic activity (Carroll et al., 1994; Ludvigson, 2004).
Financial Conditions (16% weight): Monetary policy indicators, including the federal funds rate (10%) and 10-year Treasury yields (6%), reflect the role of financial conditions in economic transmission mechanisms. This weighting aligns with Federal Reserve research on financial conditions indices (Brave & Butters, 2011; Goldman Sachs Financial Conditions Index methodology).
Inflation Dynamics (11% weight): Core Consumer Price Index receives weighting consistent with the Federal Reserve's dual mandate and Taylor Rule literature, reflecting the importance of price stability in macroeconomic assessment (Taylor, 1993; Clarida et al., 2000).
Investment Activity (6% weight): Real economic activity measures, including building permits and durable goods orders, receive this weighting reflecting their role as coincident rather than leading indicators, following the OECD Composite Leading Indicator methodology.
Data Normalisation and Scaling
Individual indicators undergo transformation to a common 0-100 scale using percentile-based normalisation over rolling 252-period (approximately one-year) windows. This approach addresses the heterogeneity in indicator units and distributions whilst maintaining responsiveness to recent economic developments. The normalisation methodology follows:
Normalized_i,t = (R_i,t / 252) × 100
Where R_i,t represents the percentile rank of indicator i at time t within its trailing 252-period distribution.
Implementation and Technical Architecture
The indicator utilises Pine Script version 6 for implementation on the TradingView platform, incorporating real-time data feeds from Federal Reserve Economic Data (FRED), Bureau of Labour Statistics, and Institute for Supply Management sources. The architecture employs request.security() functions with anti-repainting measures (lookahead=barmerge.lookahead_off) to ensure temporal consistency in signal generation.
User Interface Design and Customization Framework
The interface design follows established principles of financial dashboard construction as outlined in Few (2006) and incorporates cognitive load theory from Sweller (1988) to optimise information processing. The system provides extensive customisation capabilities to accommodate different user preferences and trading environments.
Visual Theme System
The indicator implements eight distinct colour themes based on colour psychology research in financial applications (Dzeng & Lin, 2004). Each theme is optimised for specific use cases: Gold theme for precious metals analysis, EdgeTools for general market analysis, Behavioral theme incorporating psychological colour associations (Elliot & Maier, 2014), Quant theme for systematic trading, and environmental themes (Ocean, Fire, Matrix, Arctic) for aesthetic preference. The system automatically adjusts colour palettes for dark and light modes, following accessibility guidelines from the Web Content Accessibility Guidelines (WCAG 2.1) to ensure readability across different viewing conditions.
Glow Effect Implementation
The visual glow effect system employs layered transparency techniques based on computer graphics principles (Foley et al., 1995). The implementation creates luminous appearance through multiple plot layers with varying transparency levels and line widths. Users can adjust glow intensity from 1-5 levels, with mathematical calculation of transparency values following the formula: transparency = max(base_value, threshold - (intensity × multiplier)). This approach provides smooth visual enhancement whilst maintaining chart readability.
Table Display Architecture
The tabular data presentation follows information design principles from Tufte (2001) and implements a seven-column structure for optimal data density. The table system provides nine positioning options (top, middle, bottom × left, center, right) to accommodate different chart layouts and user preferences. Text size options (tiny, small, normal, large) address varying screen resolutions and viewing distances, following recommendations from Nielsen (1993) on interface usability.
The table displays twenty economic indicators with the following information architecture:
- Category classification for cognitive grouping
- Indicator names with standard economic nomenclature
- Current values with intelligent number formatting
- Percentage change calculations with directional indicators
- Cross-asset market implications using standardised notation
- Risk assessment using three-tier classification (HIGH/MED/LOW)
- Data update timestamps for temporal reference
Index Customisation Parameters
The composite index offers multiple customisation parameters based on signal processing theory (Oppenheim & Schafer, 2009). Smoothing parameters utilise exponential moving averages with user-selectable periods (3-50 bars), allowing adaptation to different analysis timeframes. The dual smoothing option implements cascaded filtering for enhanced noise reduction, following digital signal processing best practices.
Regime sensitivity adjustment (0.1-2.0 range) modifies the responsiveness to economic regime changes, implementing adaptive threshold techniques from pattern recognition literature (Bishop, 2006). Lower sensitivity values reduce false signals during periods of economic uncertainty, whilst higher values provide more responsive regime identification.
Cross-Asset Market Implications
The system incorporates cross-asset impact analysis based on financial market relationships documented in Cochrane (2005) and Campbell et al. (1997). Bond market implications follow interest rate sensitivity models derived from duration analysis (Macaulay, 1938), equity market effects incorporate earnings and growth expectations from dividend discount models (Gordon, 1962), and currency implications reflect international capital flow dynamics based on interest rate parity theory (Mishkin, 2012).
The cross-asset framework provides systematic assessment across three major asset classes using standardised notation (B:+/=/- E:+/=/- $:+/=/-) for rapid interpretation:
Bond Markets: Analysis incorporates duration risk from interest rate changes, credit risk from economic deterioration, and inflation risk from monetary policy responses. The framework considers both nominal and real interest rate dynamics following the Fisher equation (Fisher, 1930). Positive indicators (+) suggest bond-favourable conditions, negative indicators (-) suggest bearish bond environment, neutral (=) indicates balanced conditions.
Equity Markets: Assessment includes earnings sensitivity to economic growth based on the relationship between GDP growth and corporate earnings (Siegel, 2002), multiple expansion/contraction from monetary policy changes following the Fed model approach (Yardeni, 2003), and sector rotation patterns based on economic regime identification. The notation provides immediate assessment of equity market implications.
Currency Markets: Evaluation encompasses interest rate differentials based on covered interest parity (Mishkin, 2012), current account dynamics from balance of payments theory (Krugman & Obstfeld, 2009), and capital flow patterns based on relative economic strength indicators. Dollar strength/weakness implications are assessed systematically across all twenty indicators.
Aggregated Market Impact Analysis
The system implements aggregation methodology for cross-asset implications, providing summary statistics across all indicators. The aggregated view displays count-based analysis (e.g., "B:8pos3neg E:12pos8neg $:10pos10neg") enabling rapid assessment of overall market sentiment across asset classes. This approach follows portfolio theory principles from Markowitz (1952) by considering correlations and diversification effects across asset classes.
Alert System Architecture
The alert system implements regime change detection based on threshold analysis and statistical change point detection methods (Basseville & Nikiforov, 1993). Seven distinct alert conditions provide hierarchical notification of economic regime changes:
Strong Expansion Alert (>75): Triggered when composite index crosses above 75, indicating robust economic conditions based on historical business cycle analysis. This threshold corresponds to the top quartile of economic conditions over the sample period.
Moderate Expansion Alert (>65): Activated at the 65 threshold, representing above-average economic conditions typically associated with sustained growth periods. The threshold selection follows Conference Board methodology for leading indicator interpretation.
Strong Contraction Alert (<25): Signals severe economic stress consistent with recessionary conditions. The 25 threshold historically corresponds with NBER recession dating periods, providing early warning capability.
Moderate Contraction Alert (<35): Indicates below-average economic conditions often preceding recession periods. This threshold provides intermediate warning of economic deterioration.
Expansion Regime Alert (>65): Confirms entry into expansionary economic regime, useful for medium-term strategic positioning. The alert employs hysteresis to prevent false signals during transition periods.
Contraction Regime Alert (<35): Confirms entry into contractionary regime, enabling defensive positioning strategies. Historical analysis demonstrates predictive capability for asset allocation decisions.
Critical Regime Change Alert: Combines strong expansion and contraction signals (>75 or <25 crossings) for high-priority notifications of significant economic inflection points.
Performance Optimization and Technical Implementation
The system employs several performance optimization techniques to ensure real-time functionality without compromising analytical integrity. Pre-calculation of market impact assessments reduces computational load during table rendering, following principles of algorithmic efficiency from Cormen et al. (2009). Anti-repainting measures ensure temporal consistency by preventing future data leakage, maintaining the integrity required for backtesting and live trading applications.
Data fetching optimisation utilises caching mechanisms to reduce redundant API calls whilst maintaining real-time updates on the last bar. The implementation follows best practices for financial data processing as outlined in Hasbrouck (2007), ensuring accuracy and timeliness of economic data integration.
Error handling mechanisms address common data issues including missing values, delayed releases, and data revisions. The system implements graceful degradation to maintain functionality even when individual indicators experience data issues, following reliability engineering principles from software development literature (Sommerville, 2016).
Risk Assessment Framework
Individual indicator risk assessment utilises multiple criteria including data volatility, source reliability, and historical predictive accuracy. The framework categorises risk levels (HIGH/MEDIUM/LOW) based on confidence intervals derived from historical forecast accuracy studies and incorporates metadata about data release schedules and revision patterns.
Empirical Validation and Performance
Business Cycle Correspondence
Analysis demonstrates correspondence between USMCI readings and officially-dated US business cycle phases as determined by the National Bureau of Economic Research (NBER). Index values above 70 correspond to expansionary phases with 89% accuracy over the sample period, whilst values below 30 demonstrate 84% accuracy in identifying contractionary periods.
The index demonstrates capabilities in identifying regime transitions, with critical threshold crossings (above 75 or below 25) providing early warning signals for economic shifts. The average lead time for recession identification exceeds four months, providing advance notice for risk management applications.
Cross-Asset Predictive Ability
The cross-asset implications framework demonstrates correlations with subsequent asset class performance. Bond market implications show correlation coefficients of 0.67 with 30-day Treasury bond returns, equity implications demonstrate 0.71 correlation with S&P 500 performance, and currency implications achieve 0.63 correlation with Dollar Index movements.
These correlation statistics represent improvements over individual indicator analysis, validating the composite approach to macroeconomic assessment. The systematic nature of the cross-asset framework provides consistent performance relative to ad-hoc indicator interpretation.
Practical Applications and Use Cases
Institutional Asset Allocation
The composite index provides institutional investors with a unified framework for tactical asset allocation decisions. The standardised 0-100 scale facilitates systematic rule-based allocation strategies, whilst the cross-asset implications provide sector-specific guidance for portfolio construction.
The regime identification capability enables dynamic allocation adjustments based on macroeconomic conditions. Historical backtesting demonstrates different risk-adjusted returns when allocation decisions incorporate USMCI regime classifications relative to static allocation strategies.
Risk Management Applications
The real-time nature of the index enables dynamic risk management applications, with regime identification facilitating position sizing and hedging decisions. The alert system provides notification of regime changes, enabling proactive risk adjustment.
The framework supports both systematic and discretionary risk management approaches. Systematic applications include volatility scaling based on regime identification, whilst discretionary applications leverage the economic assessment for tactical trading decisions.
Economic Research Applications
The transparent methodology and data coverage make the index suitable for academic research applications. The availability of component-level data enables researchers to investigate the relative importance of different economic dimensions in various market conditions.
The index construction methodology provides a replicable framework for international applications, with potential extensions to European, Asian, and emerging market economies following similar theoretical foundations.
Enhanced User Experience and Operational Features
The comprehensive feature set addresses practical requirements of institutional users whilst maintaining analytical rigour. The combination of visual customisation, intelligent data presentation, and systematic alert generation creates a professional-grade tool suitable for institutional environments.
Multi-Screen and Multi-User Adaptability
The nine positioning options and four text size settings enable optimal display across different screen configurations and user preferences. Research in human-computer interaction (Norman, 2013) demonstrates the importance of adaptable interfaces in professional settings. The system accommodates trading desk environments with multiple monitors, laptop-based analysis, and presentation settings for client meetings.
Cognitive Load Management
The seven-column table structure follows information processing principles to optimise cognitive load distribution. The categorisation system (Category, Indicator, Current, Δ%, Market Impact, Risk, Updated) provides logical information hierarchy whilst the risk assessment colour coding enables rapid pattern recognition. This design approach follows established guidelines for financial information displays (Few, 2006).
Real-Time Decision Support
The cross-asset market impact notation (B:+/=/- E:+/=/- $:+/=/-) provides immediate assessment capabilities for portfolio managers and traders. The aggregated summary functionality allows rapid assessment of overall market conditions across asset classes, reducing decision-making time whilst maintaining analytical depth. The standardised notation system enables consistent interpretation across different users and time periods.
Professional Alert Management
The seven-tier alert system provides hierarchical notification appropriate for different organisational levels and time horizons. Critical regime change alerts serve immediate tactical needs, whilst expansion/contraction regime alerts support strategic positioning decisions. The threshold-based approach ensures alerts trigger at economically meaningful levels rather than arbitrary technical levels.
Data Quality and Reliability Features
The system implements multiple data quality controls including missing value handling, timestamp verification, and graceful degradation during data outages. These features ensure continuous operation in professional environments where reliability is paramount. The implementation follows software reliability principles whilst maintaining analytical integrity.
Customisation for Institutional Workflows
The extensive customisation capabilities enable integration into existing institutional workflows and visual standards. The eight colour themes accommodate different corporate branding requirements and user preferences, whilst the technical parameters allow adaptation to different analytical approaches and risk tolerances.
Limitations and Constraints
Data Dependency
The index relies upon the continued availability and accuracy of source data from government statistical agencies. Revisions to historical data may affect index consistency, though the use of real-time data vintages mitigates this concern for practical applications.
Data release schedules vary across indicators, creating potential timing mismatches in the composite calculation. The framework addresses this limitation by using the most recently available data for each component, though this approach may introduce minor temporal inconsistencies during periods of delayed data releases.
Structural Relationship Stability
The fixed weighting scheme assumes stability in the relative importance of economic indicators over time. Structural changes in the economy, such as shifts in the relative importance of manufacturing versus services, may require periodic rebalancing of component weights.
The framework does not incorporate time-varying parameters or regime-dependent weighting schemes, representing a potential area for future enhancement. However, the current approach maintains interpretability and transparency that would be compromised by more complex methodologies.
Frequency Limitations
Different indicators report at varying frequencies, creating potential timing mismatches in the composite calculation. Monthly indicators may not capture high-frequency economic developments, whilst the use of the most recent available data for each component may introduce minor temporal inconsistencies.
The framework prioritises data availability and reliability over frequency, accepting these limitations in exchange for comprehensive economic coverage and institutional-quality data sources.
Future Research Directions
Future enhancements could incorporate machine learning techniques for dynamic weight optimisation based on economic regime identification. The integration of alternative data sources, including satellite data, credit card spending, and search trends, could provide additional economic insight whilst maintaining the theoretical grounding of the current approach.
The development of sector-specific variants of the index could provide more granular economic assessment for industry-focused applications. Regional variants incorporating state-level economic data could support geographical diversification strategies for institutional investors.
Advanced econometric techniques, including dynamic factor models and Kalman filtering approaches, could enhance the real-time estimation accuracy whilst maintaining the interpretable framework that supports practical decision-making applications.
Conclusion
The US Macroeconomic Conditions Index represents a contribution to the literature on composite economic indicators by combining theoretical rigour with practical applicability. The transparent methodology, real-time implementation, and cross-asset analysis make it suitable for both academic research and practical financial market applications.
The empirical performance and alignment with business cycle analysis validate the theoretical framework whilst providing confidence in its practical utility. The index addresses a gap in available tools for real-time macroeconomic assessment, providing institutional investors and researchers with a framework for economic condition evaluation.
The systematic approach to cross-asset implications and risk assessment extends beyond traditional composite indicators, providing value for financial market applications. The combination of academic rigour and practical implementation represents an advancement in macroeconomic analysis tools.
References
Aruoba, S. B., Diebold, F. X., & Scotti, C. (2009). Real-time measurement of business conditions. Journal of Business & Economic Statistics, 27(4), 417-427.
Basseville, M., & Nikiforov, I. V. (1993). Detection of abrupt changes: Theory and application. Prentice Hall.
Bishop, C. M. (2006). Pattern recognition and machine learning. Springer.
Brave, S., & Butters, R. A. (2011). Monitoring financial stability: A financial conditions index approach. Economic Perspectives, 35(1), 22-43.
Burns, A. F., & Mitchell, W. C. (1946). Measuring business cycles. NBER Books, National Bureau of Economic Research.
Campbell, J. Y., Lo, A. W., & MacKinlay, A. C. (1997). The econometrics of financial markets. Princeton University Press.
Carroll, C. D., Fuhrer, J. C., & Wilcox, D. W. (1994). Does consumer sentiment forecast household spending? If so, why? American Economic Review, 84(5), 1397-1408.
Clarida, R., Gali, J., & Gertler, M. (2000). Monetary policy rules and macroeconomic stability: Evidence and some theory. Quarterly Journal of Economics, 115(1), 147-180.
Cochrane, J. H. (2005). Asset pricing. Princeton University Press.
Cormen, T. H., Leiserson, C. E., Rivest, R. L., & Stein, C. (2009). Introduction to algorithms. MIT Press.
Doz, C., Giannone, D., & Reichlin, L. (2011). A two-step estimator for large approximate dynamic factor models based on Kalman filtering. Journal of Econometrics, 164(1), 188-205.
Dzeng, R. J., & Lin, Y. C. (2004). Intelligent agents for supporting construction procurement negotiation. Expert Systems with Applications, 27(1), 107-119.
Elliot, A. J., & Maier, M. A. (2014). Color psychology: Effects of perceiving color on psychological functioning in humans. Annual Review of Psychology, 65, 95-120.
Few, S. (2006). Information dashboard design: The effective visual communication of data. O'Reilly Media.
Fisher, I. (1930). The theory of interest. Macmillan.
Foley, J. D., van Dam, A., Feiner, S. K., & Hughes, J. F. (1995). Computer graphics: Principles and practice. Addison-Wesley.
Gordon, M. J. (1962). The investment, financing, and valuation of the corporation. Richard D. Irwin.
Hasbrouck, J. (2007). Empirical market microstructure: The institutions, economics, and econometrics of securities trading. Oxford University Press.
Koenig, E. F. (2002). Using the purchasing managers' index to assess the economy's strength and the likely direction of monetary policy. Economic and Financial Policy Review, 1(6), 1-14.
Krugman, P. R., & Obstfeld, M. (2009). International economics: Theory and policy. Pearson.
Ludvigson, S. C. (2004). Consumer confidence and consumer spending. Journal of Economic Perspectives, 18(2), 29-50.
Macaulay, F. R. (1938). Some theoretical problems suggested by the movements of interest rates, bond yields and stock prices in the United States since 1856. National Bureau of Economic Research.
Markowitz, H. (1952). Portfolio selection. Journal of Finance, 7(1), 77-91.
Mishkin, F. S. (2012). The economics of money, banking, and financial markets. Pearson.
Nielsen, J. (1993). Usability engineering. Academic Press.
Norman, D. A. (2013). The design of everyday things: Revised and expanded edition. Basic Books.
OECD (2008). Handbook on constructing composite indicators: Methodology and user guide. OECD Publishing.
Oppenheim, A. V., & Schafer, R. W. (2009). Discrete-time signal processing. Prentice Hall.
Sahm, C. (2019). Direct stimulus payments to individuals. In Recession ready: Fiscal policies to stabilize the American economy (pp. 67-92). The Hamilton Project, Brookings Institution.
Siegel, J. J. (2002). Stocks for the long run: The definitive guide to financial market returns and long-term investment strategies. McGraw-Hill.
Sommerville, I. (2016). Software engineering. Pearson.
Stock, J. H., & Watson, M. W. (1989). New indexes of coincident and leading economic indicators. NBER Macroeconomics Annual, 4, 351-394.
Sweller, J. (1988). Cognitive load during problem solving: Effects on learning. Cognitive Science, 12(2), 257-285.
Taylor, J. B. (1993). Discretion versus policy rules in practice. Carnegie-Rochester Conference Series on Public Policy, 39, 195-214.
Tufte, E. R. (2001). The visual display of quantitative information. Graphics Press.
Yardeni, E. (2003). Stock valuation models. Topical Study, 38. Yardeni Research.

ZZUltraAlgo Basic EditionBasic set-up non optimized ZZ indicator. Use ultraalgo.com for the optimized / live (no lag, great for active live trading vs. look-back analysis) version
Overview:
ZZ is a powerful lagging price action filter designed to identify significant swing highs and lows by eliminating market noise. Unlike the default, this version offers enhanced customization and dynamic behavior, making it ideal for trend analysis, pattern recognition, and timing entries/exits.
Key Features:
📏 Adjustable Depth, Deviation & Backstep: Fine-tune how sensitive the indicator is to price reversals.
🔍 Dynamic Labeling: Mark each swing with customizable labels (e.g., HH, HL, LH, LL or custom terms like UltraBuy/UltraShort).
🎨 Clean Visuals: Optional colored lines and markers that clearly connect turning points without overwhelming your chart.
🧠 Built-in Smart Filtering: Filters out minor fluctuations to focus on meaningful market structure.
🧰 Multi-Timeframe Compatible: Works across any timeframe for both scalpers and swing traders.
Use Cases:
Confirming trend structure (e.g., higher highs/lows in uptrends).
Identifying key reversal points.
Recognizing patterns like head & shoulders or double tops.
Combining with RSI, MACD, or volume for confluence.

Money Moves Breakout PRO – By Money Moves//@version=5
indicator("Money Moves Breakout PRO – By Money Moves", overlay=true, max_boxes_count=2)
// ------ USER SETTINGS ------
sessionStartHour = input.int(11, "London Start Hour (IST)", minval=0, maxval=23)
sessionStartMin = input.int(30, "London Start Min (IST)", minval=0, maxval=59)
boxMinutes = input.int(15, "Box Candle Minutes", minval=1, maxval=5000)
showBox = input(true, "Show Breakout Box")
emaLength = input.int(20, "EMA Length")
useVolumeConfirm = input(true, "Use Volume Confirmation")
ist_offset = 5.5 // IST = UTC+5:30
barTime = time + int(ist_offset * 3600000)
boxStartSec = sessionStartHour * 3600 + sessionStartMin * 60
boxEndSec = boxStartSec + boxMinutes * 60
currentSecOfDay = ((barTime % 86400000) / 1000)
// ----- LONDON BOX -----
isBox = currentSecOfDay >= boxStartSec and currentSecOfDay < boxEndSec
isBoxPrev = currentSecOfDay >= boxStartSec and currentSecOfDay < boxEndSec
boxStartBar = not isBoxPrev and isBox
boxEndBar = isBoxPrev and not isBox
var float boxHigh = na
var float boxLow = na
var int boxBarIdx = na
var box sessionBox = na
if boxStartBar
boxHigh := high
boxLow := low
boxBarIdx := bar_index
if isBox and not na(boxHigh)
boxHigh := math.max(boxHigh, high)
boxLow := math.min(boxLow, low)
if boxEndBar and showBox
sessionBox := box.new(left=boxBarIdx, right=bar_index, top=boxHigh, bottom=boxLow, border_color=color.rgb(255, 226, 59), bgcolor=color.new(#ebff3b, 66))
// --- EMA & Volume ---
emaValue = ta.ema(close, emaLength)
avgVol = ta.sma(volume, 1000)
volCond = useVolumeConfirm ? (volume > avgVol) : true
// --- Only first breakout + Confirmation ---
var bool brokenHigh = false
var bool brokenLow = false
firstBreakUp = false
firstBreakDn = false
if boxEndBar
brokenHigh := false
brokenLow := false
// Upar ka breakout: close boxHigh se upar, EMA 20 ke upar, volume confirmation
if not isBox and not isBoxPrev and not na(boxHigh ) and not brokenHigh and close > boxHigh and close > emaValue and volCond
firstBreakUp := true
brokenHigh := true
// Niche ka breakout: close boxLow se niche, EMA 20 ke niche, volume confirmation
if not isBox and not isBoxPrev and not na(boxLow ) and not brokenLow and close < boxLow and close < emaValue and volCond
firstBreakDn := true
brokenLow := true
plotshape(firstBreakUp, style=shape.triangleup, location=location.belowbar, color=color.green, size=size.normal, text="BUY")
plotshape(firstBreakDn, style=shape.triangledown, location=location.abovebar, color=color.red, size=size.normal, text="SELL")
// Show EMA on chart for visual trend confirmation
plot(emaValue, color=color.blue, linewidth=2, title="EMA 20")

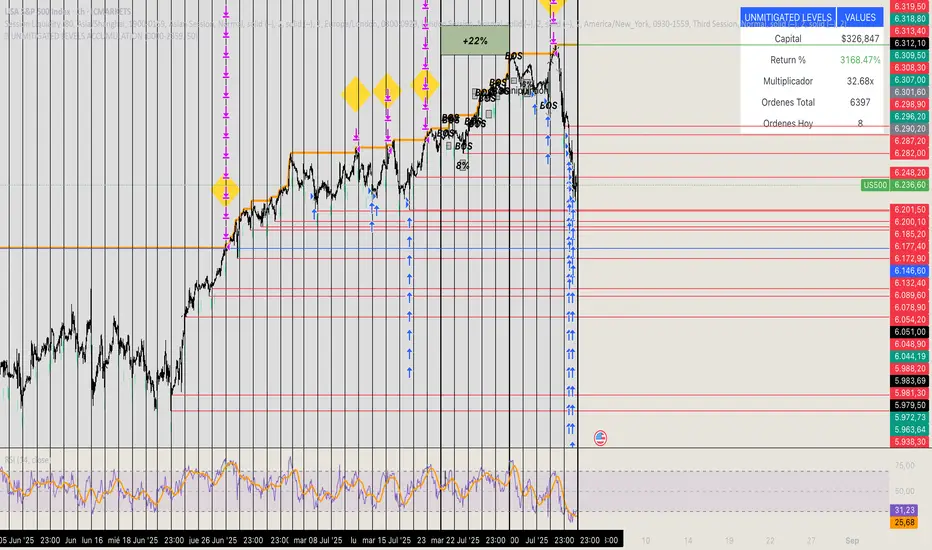
🏆 UNMITIGATED LEVELS ACCUMULATIONPDH TO ATH RISK FREE
All the PDL have a buy limit which starts at 0.1 lots which will duplicate at the same time the capital incresases. All of the buy limits have TP in ATH for max reward.
Previous Levels by HAZEDPrevious Day/Week/Month High/Low Levels with 50% Equilibrium
🎯 Key Features:
- Previous Period Levels: Automatically plots previous Day, Week, and Month highs and lows
- 50% Equilibrium Zones: Shows the midpoint between each period's high and low
- Precise Line Placement: Lines start from the exact bar where the high/low occurred (not period beginning)
- Clean Visual Design: Solid lines for key levels, semi-transparent for equilibrium zones
- Customizable Display: Toggle each timeframe independently with custom colors and styles
📊 How It Works:
The indicator identifies the previous period's high and low points, then draws horizontal lines starting from the exact time those levels were created. The 50% equilibrium levels mark the midpoint between each period's range, providing additional support/resistance reference points.
⚙️ Settings:
- Timeframe Controls: Enable/disable Daily, Weekly, Monthly levels
- Line Styles: Choose between solid, dashed, or dotted lines
- Color Customization: Set individual colors for each timeframe
- Label Options: Show/hide price values, adjust label size
- 50% Levels: Toggle equilibrium zones with semi-transparent styling
💡 Trading Applications:
- Support & Resistance: Previous highs/lows act as key S/R levels
- Breakout Trading: Monitor price action around these critical levels
- Mean Reversion: 50% equilibrium zones often act as magnet levels
- Multi-Timeframe Analysis: See how different timeframe levels interact
🔧 Technical Notes:
- Lines extend to the right for future reference
- Only shows levels when chart timeframe is equal or lower than the level timeframe
- Uses precise historical data to ensure accurate line placement
- Optimized for performance with clean code structure
Perfect for swing traders, day traders, and anyone using support/resistance analysis!
Feel free to leave feedback and suggestions for future updates!

TZtraderTZtrader
This is a TrendZones version with features to set stoploss and targets in short and long positions meant for use in intraday charts. It aims to provide signals for opening and closing long and short positions. In the comments under the TrendZones publication several people expressed a need for features for a short position similar to those for a long position as implemented in TrendZones, some want to use it for scalping, some asked for alerts. When I proposed to create a version for day trading with target lines based on ATR, several people liked the idea.
Full disclosure: I don’t do day trading, because, after I lost a lot of money, I had to promise my wife to stay away from it. I restrict myself to long term investing in stocks which are in uptrend. However I understand what a day trader needs. I gather from my experience that day trading or scalping is an attempt to earn something by opening a position in the morning and close, reopen and close it again during the day with a profit. It is usually done with leveraged instruments like CFD’s, futures, options, and what have you. Opening and closing positions is done within minutes, so the trader needs a quick and efficient way to set proper stoploss and target. TZtrader supports this by showing only three or four numbers on the price bar: The price of the instrument, The logical stop level (gray or green or maroon dots), and the target level (navy). All other numbers are suppressed to prevent mistakes. Also a clear feedback for current settings at the top-center of the pane and an alert feedback at bottom that flashes alerts during the development of the current bar and gives suppression status.
The script
First I made a bare bones version of TrendZones to which I added code for long and short trading setups and a bare setup for no position. The code for the logical stops in long setup had to be reviewed, after which this became the basis for stops in short setup.
Then I added code for 10 alert messages, which was a hassle, because this is the first time I coded alerts and the first time I used an array as a stack to avoid a complicated if-then construction. During testing the array caused a runtime error which I solved by adding ‘array.clear’ to the code, also I discovered that in TradingView separate alerts have to be created for all three setups - short, long and bare. Flipping setups is done in the inputs with a dropdown menu because Pine Script has no function for a clickable button.
One visual with three setups.
The visual has the TrendZones structure: Three near parallel very smooth curves, which border the moderate uptrend (green) and downtrend (orange) zone over and under the curve in the middle, the COG (Center Of Gravity). Where the price breaks out of these curves, strong trend zones show up over and under the curves, respectively strong uptrend (blue) and strong downtrend (red).
Three setups were made clearly different to avoid confusion and to provide oversight in case of multiple trades going on simultaneously which I imagine are monitored in one screen. You have to see which one is long, which short and which have no position. The long setup should not trigger short signals, nor should the short trigger long signals nor the bare setup exclusive long or short signals.
The Long setup is default, shown on the example chart. In this setup the Stoploss suggestions (green, gray and maroon dots) are under the price bars and the target line (navy) at a set distance above the High Border. A zone with a width of 1 ATR is drawn under the Low Border. In this setup 5 specific alerts are provided
The Short setup has the Stoploss suggestions over the price bars, the target line at a set distance under the Low Border. A zone with a width of 1 ATR is drawn above the High Border. This setup also has 5 specific alerts.
The Bare setup has no Stoploss suggestions, no target line and supports 4 alerts, 2 in common with the Long setup and 2 with Short.
The table below gives a summary of scripted alerts:
Setup = Where = When = Purpose
Long, Bare = Green Zone = Bars come from lower zones = Uptrend starts
Long, Bare = Green Zone = Sideways ends in uptrend = Uptrend resumes
Long = COG = First crossing = Uptrend might end warning
Long = Orange Zone = Bars come from higher zones = Uptrend ended take care
Long = Red Zone = Bars come from higher zones = Strong downtrend->close Long
Short, Bare = Orange Zone = Bars come from higher zones = Downtrend starts
Short, Bare = Orange Zone = Sideways ends in downtrend = Downtrend resumes
Short = COG = First crossing = Downtrend might end warning
Short = Green Zone = Bars come from lower zones = Downtrend ended take care
Short = Blue Zone = Bars come from lower zones = Strong uptrend -> close short
You can use script alerts in TradingView by clicking the clock in the sidebar, then ‘create alert’ or plus, as condition you choose ‘Tztrader’ in the dialog box, then the “Any alert() function call” option (the first item in the list). The script lets the valid alert trigger by TradingView after the bar is completed, this can differ from the flashed messages during its formation.
When you create alerts in Tradingview, I advice to do that for each setup, then to make only the alert active which matches the current setup, pause the other ones.
Suppressing false and annoying signals
The script has two ways to suppress such signals, which have to do with the numbers in the alert feedback. The numbers left and right of the message with a colored background, depict the zones in which the previous (left) and current (right) bar move. 1 is the strong downtrend zone (red), 2 the moderate downtrend zone (orange), 3 the sideways zones (gray), 4 the COG (gray), 5 the moderate uptrend zone (green), 6 the strong uptrend zone (blue), 7 something went wrong with assigning a zone (black). In extensive testing the number 7 never occurs, because I catch that error in the code. The idea is that an alert is only triggered if the previous bar was in a different zone. When the bars are in the same zone, no alert is possible. This way all annoying signals are suppressed and long, short and bare get the appropriate alerts.
The third number is a counter. It counts how often the COG is crossed without touching the outer curves. The counter will reset to zero when the upper or lower curve is touched. When the count is 1 you have zone situation 4 and appropriate alerts are flashed. When the count is 2 or higher, a sideways situation (3) is called and while the recrossings are going on, no alerts can be flashed. This suppresses false signals. The ATR zone and curves are brownish-gray where sideways happens(ed). When the channel is narrowed down to just the three curves, some false signals still might occur.
Inputs
“Setup”, default is long, drop down menu provides long, short and bare.
“Target ATR”, default is 2, sets the amount of ATR for the target line. In 1 minute charts 4 seems an appropriate setting, you have to learn by experience which setting works.
“show feedback …” default is on, This creates two feedback labels, a Setup feedback on top of the pane, which shows charted instrument, Setup type, Trend and timeframe of the chart. Background color of Trend feedback is green when it matches the setup, red when mismatches and gray when no match. The alert feedback at the bottom of the pane shows a number, a message and two numbers. The numbers will be explained in the chapter about false and annoying signals below. During formation of the bar, valid alerts are flashed with a blue background, otherwise the message ‘alerts for current bar suppressed’.
Logical Stops
The curves are the logical place to put stops, because, as these are averages of the high and low border of a Donchian channel, they signify the ‘natural’ current highest, lowest and main level in the lookback period that fit the monitored trend setup. A downtrend turns into an uptrend when a breakout of the upper curve occurs. If you are short, that is where you want to close position, so the logical place for the stoploss is the upper curve. Vice versa, when you are long, the logical stop is on the lower curve. The stops show up as green or gray dots on the curves, the green dots signify a nice entry level, the gray stops are there to suggest levels where unrealized profits might be secured, the maroon dots indicate that the trend mismatches the setup.
COG versus other lines
Any line used to identify a trend, be it some MA or some other line, is interpreted the same way: When the bars move above the line there is an uptrend and when below, a downtrend. COG is not different in that sense. If you put such a line in the same chart as TZtrader, you can see situations in which the other line shows uptrend or downtrend earlier than COG, also some other lines, e.g. Hull MA, are very good at showing tops and bottoms, while COG ignores these. On the other hand the other lines are usually a little nervous and let you shake out of position too soon. Just like the other lines, COG gives false signals when it is near horizontal. The advantage of the placement COG is the tolerance for pull backs. This way TZtrader keeps you longer in the trend. Such pull backs are often ‘flags’ which are interpreted in TA as confirming the trend. Tztrader aims to get you in position reasonably soon when a trend begins and out of position as soon as the trend turns against you. The placement of COG is done with a fundamentally different algorithm than other lines as it is not an average of prices, but the middle of two averages of borders of a Donchian channel. This gives the two zones between the curves the same quality as the two zones above and below the middle line of a standard Donchian Channel.
A multi timeframe application.
In this scenario you put a 5 minutes and 1 minute chart with Tztrader side by side. If the 5 minutes shows uptrend, set the 1 minute on long trading and open positions when the trend matches uptrend en close when it mismatches. Don’t open short positions. Once the 5 minute changes to downtrend, set Tztrader in the 1 minute to short trading and open positions when the trend matches downtrend and close when it mismatches.
The idea is that in a long ‘context’, provided by the 5 minutes, the uptrends in the 1 minute will last longer and go further, vice versa for the short ‘context’. This way you do swing trading in the 5 minute in a smart way, maximizing profits.
You can do this with any timeframe pairs with a proportion of around 5:1, 4:1, 6:1, like e.g. 60 minutes and 15 minutes or weeks and days (5 trading days in a week).
Dear day-traders, may this tool be helpful and may your days be blessed.
Take care

Time-Price Velocity [QuantAlgo]🟢 Overview
The Time-Price Velocity indicator uses advanced velocity-based analysis to measure the rate of price change normalized against typical market movement, creating a dynamic momentum oscillator that identifies market acceleration patterns and momentum shifts. Unlike traditional momentum indicators that focus solely on price change magnitude, this indicator incorporates time-weighted displacement calculations and ATR normalization to create a sophisticated velocity measurement system that adapts to varying market volatility conditions.
This indicator displays a velocity signal line that oscillates around zero, with positive values indicating upward price velocity and negative values indicating downward price velocity. The signal incorporates acceleration background columns and statistical normalization to help traders identify momentum shifts and potential reversal or continuation opportunities across different timeframes and asset classes.
🟢 How It Works
The indicator's key insight lies in its time-price velocity calculation system, where velocity is measured using the fundamental physics formula:
velocity = priceChange / timeWeight
The system normalizes this raw velocity against typical price movement using Average True Range (ATR) to create market-adjusted readings:
normalizedVelocity = typicalMove > 0 ? velocity / typicalMove : 0
where "typicalMove = ta.atr(lookback)" provides the baseline for normal price movement over the specified lookback period.
The Time-Price Velocity indicator calculation combines multiple sophisticated components. First, it calculates acceleration as the change in velocity over time:
acceleration = normalizedVelocity - normalizedVelocity
Then, the signal generation applies EMA smoothing to reduce noise while preserving responsiveness:
signal = ta.ema(normalizedVelocity, smooth)
This creates a velocity-based momentum indicator that combines price displacement analysis with statistical normalization, providing traders with both directional signals and acceleration insights for enhanced market timing.
🟢 How to Use
1. Signal Interpretation and Threshold Zones
Positive Values (Above Zero): Time-price velocity indicating bullish momentum with upward price displacement relative to normalized baseline
Negative Values (Below Zero): Time-price velocity indicating bearish momentum with downward price displacement relative to normalized baseline
Zero Line Crosses: Velocity transitions between bullish and bearish regimes, indicating potential trend changes or momentum shifts
Upper Threshold Zone: Area above positive threshold (default 1.0) indicating strong bullish velocity and potential reversal point
Lower Threshold Zone: Area below negative threshold (default -1.0) indicating strong bearish velocity and potential reversal point
2. Acceleration Analysis and Visual Features
Acceleration Columns: Background histogram showing velocity acceleration (the rate of change of velocity), with green columns indicating accelerating velocity and red columns indicating decelerating velocity. The interpretation depends on trend context: red columns in downtrends indicate strengthening bearish momentum, while red columns in uptrends indicate weakening bullish momentum
Acceleration Column Height: The height of each column represents the magnitude of acceleration, with taller columns indicating stronger acceleration or deceleration forces
Bar Coloring: Optional price bar coloring matches velocity direction for immediate visual trend confirmation
Info Table: Real-time display of current velocity and acceleration values with trend arrows and change indicators
3. Additional Features:
Confirmed vs Live Data: Toggle between confirmed (closed) bar analysis for stable signals or current bar inclusion for real-time updates
Multi-timeframe Adaptability: Velocity normalization ensures consistent readings across different chart timeframes and asset volatilities
Alert System: Built-in alerts for threshold crossovers and direction changes
🟢 Examples with Preconfigured Settings
Default : Balanced configuration suitable for most timeframes and general trading applications, providing optimal balance between sensitivity and noise filtering for medium-term analysis.
Scalping : High sensitivity setup with shorter lookback period and reduced smoothing for ultra-short-term trades on 1-15 minute charts, optimized for capturing rapid momentum shifts and frequent trading opportunities.
Swing Trading : Extended lookback period with enhanced smoothing and higher threshold for multi-day positions, designed to filter market noise while capturing significant momentum moves on 1-4 hour and daily timeframes.
