Gann Fan Analysis v 3.0The openness of this community is amazing and I have gained a lot from being a member. Hopefully you think this is useful so I can give something back.
This indicator constructs a reference framework of Support and Resistance levels based on Gann Fan ratios. Two fans are created: Support or Bullish fan, and a Resistance or Bearish fan. The origin of the analysis is the lowest pivot in the analysis window set by the length input. The upper bound of the analysis is the highest pivot in the analysis window. This is the only user input that affects the fan calculation. The remaining user input controls the visualization of the fans. The fan calculations are updated as the high and low within the analysis window change. The resistance fan range is based on an assumed 70% retracement.
Indicator also highlights the active Support and Resistance lines of each fan. An alert is also included, based on the price crossing one of these active levels.
Currently I can't figure out how to get the analysis to extend beyond 278 or so bars (not sure what the limitation is) so it isn't really useful for intraday timeframes, but it is reliable on daily and above. I use it on a Weekly view with the analysis length set to 52, and on a daily timeframe with the length set to 260.
I included fractal visualization using Ricardo Santos' Fractals v9 script as a means of confirming the Gann Fan pivots. The two methods seems to correlate well, in my opinion.
The coding is terrible, I'm sure, so please overlook that as this my first complex effort. I'm a total amateur!
Pivot Points
Daily Pivot (Traditional)Hello all
-
This code is for daily pivot points, support and resistance with pivot labels and value.
simple code with no bugs.
this code use previous day values on online chat and current day values on offline chat.
pivot values are placed on right side, so no overlapping with other values.
.
.
Thank you Trading View for other educational script to make this possible.

JamesCart's Feigenbaum Price BandsThis is a part of my Feigenbaum family of scripts. This one however uses the Feigenbaum Alpha constant (the constant of the width of the tein from the subteins) as a proportion of the ROC. Then it uses that to establish a middle point, and 2 resistance and 2 support lines.With the widest lines being R2 and S2. Dark red is R2 and Dark Green is S2. I encourage you to change the time frame to find what is best, I have it set at the minimum of 1.

Example - Switching LineExample of manipulating a float series to:
• switch from one source to another
• maintain a level by referencing itself
This script publication is intended for:
• Educational Purposes
Who is it for?
Anyone who wants to learn how to change the position or state of an active float series.

FIBS S/R IndicatorHello,
I've decided to publish a new script. The previous version of this script was removed by admins for breaking community rules.
So I present to you the Fibonacci Support / Resistance.
1. How does it work
Ratio plots
I first take the input of pivot look back and search for pivots high and low.
And then it takes a second look back to search highest high and lowest low to establish the top bottom range.
Then using the top and bottom I plot ratios provided as input. Defaults to most relevant 5 ratios I've found (Fibonacci):
Ratio 0 = 0 - can't be changed
Ratio 1 = 0.5
Ratio 2 = 0.618
Ratio 3 = 1
Ratio 4 = 1.618
Ratio 5 = 2.618
Any changes done to these ratios should be in order, otherwise conditions could get messed up. So R1 needs to the lowest and R5 the highest.
Also the same ratios are used in reverse as negative ratios.
There is a option to plot all ratios but gets really confusing for me but maybe for you it works. By default there are certain conditions set so that as we go up new resistance ratio get displayed and as we go down we see new resistance plots.
Trendlines
I've also added some automatic trendline plots with breakout warning labels based on the pivots high and low. Start and end for trendlines can be changed via inputs.
Labels can be deactivated via input. On a older version the trendlines and labels where not removed from the chart but I felt like there was to much information.
Overcooked/Undercooked
I've also added some fills and background colors that indicate if the price action is over R5 or under Negative R5 ratios. This usually indicates some "overcooking" or "undecooking".
I've notices that after "crossunder"/"crossover" top bottom ratios it goes in consolidation or it dumps. So then I plot a bgcolor to signal that.
2. How to use it
Using plot lines we can determine where we have support and resistance. I found that the best way to use the default ratios values is on the 1H chart. Very good for trading on crypto because of current situation in the market where there is a lot of new people entering the space and volatility and sentiment make swings respect the Fibonacci ratios.
3. Examples
For instance lets look at BINANCE:BTCUSDT .
On the left we see that the price action between 20 and 21 February was "overcooked". So after we got the signal that we "crossunder" the R5 the signal was triggered and we got a small red candle followed by a small dip and after that we got a small bounce and a dump.
If we also look at MF-RSI we can also see we got multiple bear divs.
Lets entertain the idea that we went short at ~57.1k as soon as we get signaled and it starts dumping.
Where does it stop ?
We can see it went all the way down to Negative R5 ratio. Normally that should signal "undercooking" but this was not triggered as it did not close under it (signaled in green).
We can also see that previous support now becomes resistance (signaled in red).
If we take a look at BINANCE:ETHUSDT , we do see that the "undercooking" was triggered here.
I will be publishing a more detailed Idea with examples of using this on the BINANCE:BTCUSDT chart in combination with Volume and other technical analysis.
Use with caution, this is not 100% signal indicator as the markets do what they want. But by using this in combination with other indicators like MF-RSI, EMAs and regular patterns we can get some targets for Support/Resistance.
I'm trying to create a strategy based on this indicator but I'm not getting very good results. Best results were on the 15 min chart with gross profits around ~50%.
Please try to play around with the inputs and let me know if you find something interesting, maybe I can incorporate new features in the indicator.
You can find the MF-RSI indicator here

True Emotion OscillatorThe True Emotion Oscillator is a combination of multiple signals such as stochRSI, Macd, Fisher, etc to gauge the emotion of the market based on a -100-+100 scale. I wanted to incorporate a visual style that would appeal to people while keeping it simple. This indicator also has divergence detection built in, but I think it lags behind based on the filter settings. Ideally I would remake this part of the script to be realtime detection.
How to use:
Buy when the signal is below 0 and starts to turn around. Sell when above 0 and turns back down.
Utilize divergence theory to find better entries.
Settings:
Change your chart background color to a solid #171a27 if you want to match my colors.
Signal smoothing - smooths the signal line to reduce noise.
Divergence Filter - How many bars back to start looking for divergences.
Show Hidden Divergence - Shows hidden divergences
Show Pivots - Turns on/off dots

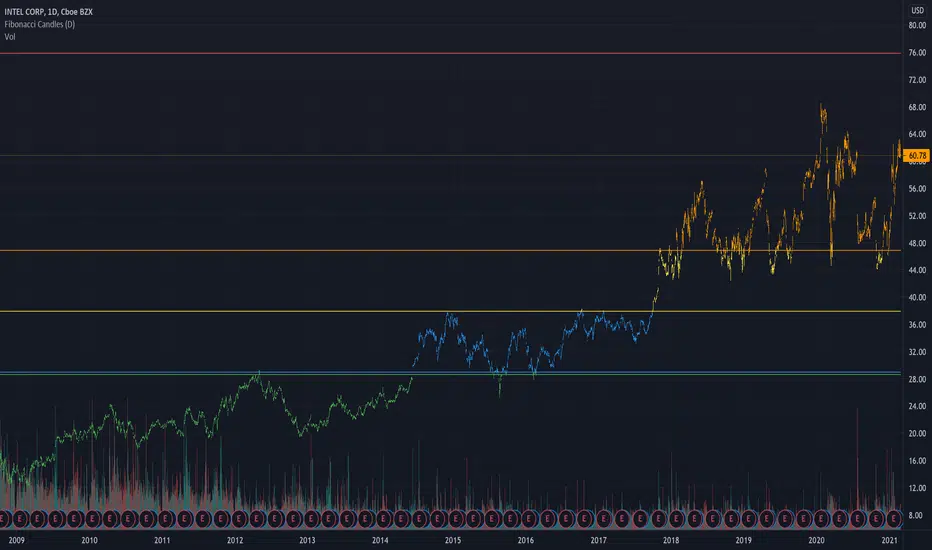
Simple Fibonacci Candles + LevelsThis is a simpler alternative to the auto-fibonacci indicators. Calculates the fibonacci levels based on the all-time high and all-time low prices. Candles are then colored based on the current closing price's relation to the 5 levels.
Donchian Channel - CustomThis is an extension to Donchian Channel - Pivot High Low indicator. Creating new version as the new type added isn't related to pivot high/low.
New type added is based on moving average. Instead of using highest and lowest of n bars, here, we are using lowest and highest of moving average of highs and lows for n bars.
Previous version of Donchian channel pivot points can be found here:

Dow theory Indicator for FreeDow theory Indicator for Free ver.1.0
Shows current trends based on Dow theory.
Draws a horizontal line automatically from the latest 2 highs and 2 lows.

ACD - Layers 1 & 2An implementation of layers 1 & 2 of ACD strategy of Mark Fisher, based on the book "The Logical Trader".
This implementation contains:
- OR lines
- A lines
- C lines
- Daily pivot range
- N days pivot range
- Customizable trading session
Strategy summary (This implementation):
There is 3 main concepts, each of which represented as two price levels.
1) OR (Opening Range) is the range of the first bar of the day. In other words, it's just "high - low" of the first resolution (usually 15min.) bar of the day. So, OR lines (Aqua color) visualize this range for each trading session.
As stated by Mark Fisher in his book, this range is meant to be a statistically significant range such that when price breaks the range in one direction, This is UNUSUAL to infiltrate it again AND break through the other side. So we can consider it as a potential enter signal (long or short).
2) A lines (Blue color) are drawn above and below OR lines with difference of 10% 0f 10 days ATR. The ATR period and the A multiplier (usually 10%) is customizable.
3) C lines (Gray color) are drawn above and below OR lines at 15% of 10 Days ATR difference. These lines help detecting AND confirming that UNUSUAL situation.
These concepts form the layer 1, which you can spot potential opportunities with it.
There is also two ranges to show support and resistance levels based on price action of previous days. Pivot ranges are rolling ranges that calculated and last for each day separately. They only differ in calculation period - the first one is daily (yellow color area) and the other one (red color area) is customizable, but is usually 3 or 5 days.
Each range consists of two price levels, valid for the current trading session. One of theme is HL2 , and the other one is "HLC3 + abs(HLC3 - HL2 )".
These two ranges, "Daily pivot range" and "N days pivot range", form the layer 2, which you can see them as two dynamic support/resistance ranges - one for daily, and the other for N days. They help filtering opportunities spotted from layer 1.
There is 2 more layers in the ACD strategy, which is omitted in this free implementation.

NSDT Daily Key LevelsSimple script to show key levels of current day and previous day. Labels can be turned on and off as needed. Line colors, thickness and style can be changed. Modified the "M/W/D Level" script from paaax. Credit for original code goes to him. Link to script and profile posted in code of this script.

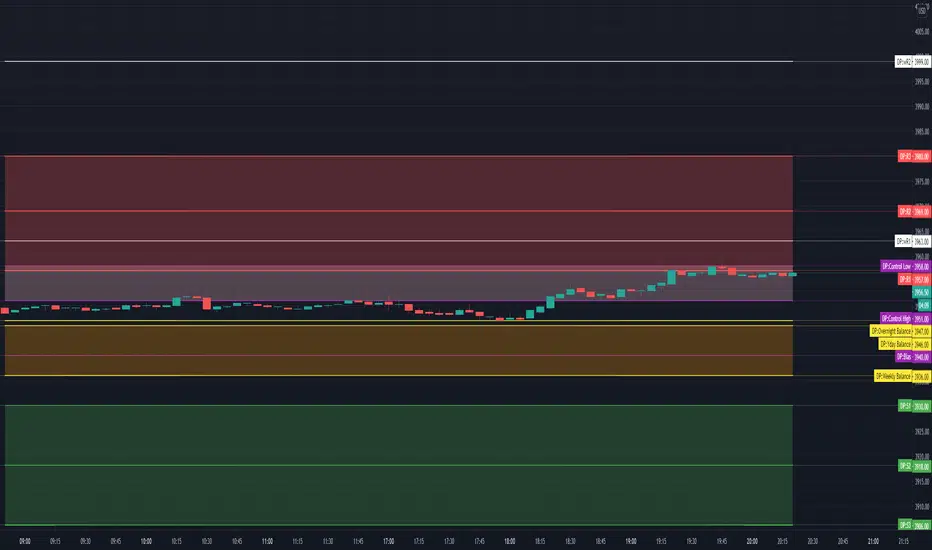
PRIME-QUARTERS W-XsThis script applies both the Quaters theory for easy analysis of market structure, as well as a 50 and 800 SMA to be used in conjunction with the 4 and 21 SMA found in Prime-Pulse, to pin point sniper entries. $auceCamp
TTT_Swing_and_Orderblock_Ver_1.0.2Hello, dear traders from all over the world! This is Tommy from Tommy Trading Team.
Many inquires were delivered to us from traders recently wishing to use one of our cutting-edge technologies that was developed days ago and was only used by us. We have edited and supplemented this indicator both logically and visually. Accordingly, our team is officially launching with a new brought up name, which is “SOB(Version1.0.2), shorten for “Swing & OB(Orderblock).”
This technical indicator is quite straightforward and effective to utilize since it shows traders the essential variables that are considered by many recently developed theories and state-of-the-art methodologies. And they are ‘Dow’ and ‘Orderblock’.
Swing High and Low (Dow Theory) has been applied fundamentally by many other theories and methodologies such as Elliott wave theory and SR Flip techniques. A swing can be interpreted as a wave with a trend composed of a high and a low each. After succeeding on making significant highs/lows, in any existing wave theories, it is essential to monitor and spot when the next waves make HH(Higher high), LH(Lower high), HL(Higher low), or LL(Lower low).
OB(Orderblock) technique is a very advanced methodology that captures the contraction, consolidation, and attraction zone. This so called ‘zone’ is interpreted differently by various stakeholders, such as institutional(whales) average entry/exit price range or peak price range with higher traded volumes. In TA perspective, it’s just a major support/resistance to consider and when this zone fails to support/resist, the price momentum tends to boost up towards the direction it failed. To give you a little tip, look for the spots usually forming horizontal parallel channel, before a big wave with a clear trend (whether up or down) appears. There are numerous ways to identify OB and we have concluded that signaling the double engulfing candles is one of the highly effective one.
As just mentioned, comprehending a trend utilizing ‘Swing HL’ is fundamental and yet definite TA concept and strategy. Furthermore, OB can also be useful to spot major support and resistance area. SOB automatically identify and captures major Highs, Lows, and OBs. In addition, SOB can let traders know when the highs and lows are being replaced by higher/lower highs/lows by changing pivots color. If you are familiar with SR(Support and Resistance) Flip concept, this can be a helpful tool for you since it can signal when highs/lows are being broken above/below and by planning a retest entry trading setup.
If you would like to try SOB_ver1.0.2, please let us know through comments, DM, or Telegram in English/Korean. I assure you that our SOB won’t disappoint you on your trading chart.
Thank you.
안녕하세요. 트레이더 여러분!
토미 트레이딩 팀입니다~
최근에 저희 팀이 개인적으로 사용했던 지표에 관해서 많은 분들이 문의를 주셨습니다. 약간의 보안 및 개선 작업 이후에 SOB(Version1.0.2)이라는 이름으로 정식 출시합니다.
해당 알고리즘은 기존의 여러 이론 및 방법론들에게 원천적으로 기반이 되는 다우이론(스윙 고/저점)과 오더블럭(OB)을 바로바로 잡아주기 때문에 주요 고/저점과 매물대 지지/저항 컨펌하는 용도로 활용하기 매우 유용합니다.
변동하는 가격의 흐름, 즉 추세를 파악하는 방법은 수만가지가 있습니다. 단 하나의 방법, 지표, 혹은 이론만 가지고 추세를 파악하는 건 당연히 바보 같은 짓이겠죠. 여러가지의 요소들을 복합적으로 봐야하는데 그 중에 가장 근본적이면서 중요한 게 바로 다우이론이라고 생각합니다. 이름만 거창하지 정말 별거 없습니다. 한문장으로 “전 고/저점에 비해서 이번에 나오는 고/저점이 높아졌냐 낮아졌냐”입니다. 다우 이론은 엘리엇 파동 이론 및 SR Flip 전략 등 대부분들의 기법들에 적용된 만큼 차트 보시려면 꼭 알아야 되는 개념입니다. 스윙이란 변곡이 나오기 전까지의 가격 흐름, 즉 하나의 파동이라고 생각하시면 되겠습니다. 주요 고/저점은 통상적으로 하나의 파동을 규명하기 위해 참고하는 기준들입니다. 고/저점 혹은 변곡점이 출현하고 나서 후행적으로 우리는 전 상승/하락 파동이었다고 인지를 합니다. 여기서 중요한 건 다음 파동이 전 파동보다 고/저점을 높였냐/낮추었냐입니다. 고/저점을 높여가는 파동이 나오면 상승, 낮추어가는 파동이 나오면 하락 추세에 가중을 더 두고, 고/저점을 높이다가 내리기 시작하면 혹은 내리다가 높이기 시작하면 추세가 어느정도 전환될 수 있는 시그널로 해석할 수 있습니다.
OB(오더블럭) 기법은 요즘 장에 그나마 잘 먹히는 가격매물대를 찾는 방법론 중 하나입니다. 매물대란 다양한 시장참여자들에 따라 시시각각 해석될 수 있습니다. 기관(세력)들의 매집구간, 많은 참여자들의 평균 진입/청산/평단 가격 범위, 혹은 시체 쌓인 구간으로도 해석해볼 수 있습니다. 더 쉽게 설명해드리자면 거래량이 상대적으로 많은 가격 범위대라고 보시면 되겠습니다. 기술적분석 관점에서는 매물대를 주요 지지/저항구간대라고 고려하실 수 있으며 지지/저항을 실패하면, 그 실패한 방향으로 추세가 터질 가능성을 두고 전략 설계에 활용합니다. 매물대를 효과적으로 찾을 수 있는 팁 하나를 드리자면, 어느정도 명확하고 큰 추세가 나오기 전에 형성된 수평 평행 채널들을 먼저 의심해보세요. 만약에 해당 가격범위 내에 OB가 많이 내포되어 있다면 신빙성을 더 부여하실 수 있습니다. 이렇게 OB는 매물대를 식별하고 컨펌하는 용도로 매우 용이하게 활용될 수 있으며, 요즘에 유행하는 기법인 마스터패턴에도 찰떡궁합입니다. OB를 정의하는 여러가지 기법들 중 캔들봉을 활용한 방법이 그나마 가장 효과적이며 저희 개발팀은 장악형(Engulfing) 패턴이 두번 이상 출현하는 캔들봉들의 몸통들을 기준으로 OB를 찾는 로직을 지표화했습니다.
언급 드렸듯, 다우이론은 기술적 분석 기법 중 가장 근본적이면서도 동시에 실용도가 높아 차트 보시려면 무조건 숙지해야하는 개념 및 전략입니다. 또한 상대적으로 최근 시장에 효율적인 매물대 색출 전략 중 하나인 OB기법으로 주요 지지/저항으로 해석될 수 있는 메이저 매물대들의 가격 범위를 더 세분화시킬 수 있습니다. 저희 SOB 지표는 주요 고점, 저점, 그리고 OB들을 자동으로 피봇으로 잡아줄뿐더러 주요 고/저점이 뚫렸을 때, 해당 피봇의 색깔들이 변경됩니다. SR Flip (저항선이 뚫리면 지지선, 지지선이 뚫리면 저항선)개념 및 전략을 자주 활용하시는 트레이더분들은 고/저점 뚫릴 때, 즉 더 높은/낮은 고/저점이 출현하고 나서 전 고/저점을 활용해 리테스트 진입 자리 찾으실 때 유용하게 사용하실 수 있습니다.
저희 SOB_Version1.0.2 지표를 사용하고 싶으신 분들은 댓글, DM, 또는 저희 개인 채널에 문의 주십시오. 차트와 캔들 위에서만큼은 우리 SOB이 여러분들을 실망시키지 않을 것입니다.
감사합니다. 성투하세요.

TV Day Plan Template 1This is a template for daytraders, swing traders, supply and demand traders, and even swing traders. As traders we are always scanning charts for levels and zones. This template makes it easy and convenient to find, change, and chart levels. As a daytrader, I will use this daily. I always have daily and weekly targets in mind. This will ensure I don't lose track of the bigger picture while trading the smaller moves. Levels in this chart are not auto calculated. They are manually input. This script is a quick and convenient way to chart multiple levels without having to go through each drawing, change the settings, and then redraw the level. Currently this will only save levels for one ticker. A workaround is to use multiple instances and then hide the ones not in use. Another way is to use the second part to this script, Day Plan Levels Template 2. If only using one instance, you can save the levels as default. This will save them. However, if saving levels as default while using multiple instances of this indicator, the other levels will erase. The way that I use this that I have daily levels for #ES in one instance and then daily levels for #NQ in another instance.
This script is very customizable
Options include
On/Off Toggles
Light/Heavy Versions - Light versions does not plot. Heavy version will plot and show levels in info bar and price axis
Balance Levels
Control Levels
3 Support and 3 Resistance levels for daily and weekly
2 Support and 2 Resistance Clouds
Balance and Control Clouds
"0" value disables and hides levels
ZenTrdr TRENDLong trend starts with a close higher than the previous local high. Short trend, of course, is the contrary. This indicator shows the trend on the Daily, H4 and H1.
Levels are the validation levels of the current trend on the specific time frame.
Bars are colored according to the H4/H1 trend showing the same direction.
WiseAnalyze EMA + fractalsCombination of exponential moving averages allow to spot the trend reversal and expansion, Bill Williams fractals and support resistance zones allow to trade without drawing anything. Just follow the trend.
Study your chart. Note which EMA act as support and bounce most of tests. Most often I use 21/34 EMA for new entries.
Most powerful trend indicator is MAWV. Don't try to trade against it. If price above go long. If below - short.
Stops should be placed behind fractals. Breakout entries on price crossing fractals.
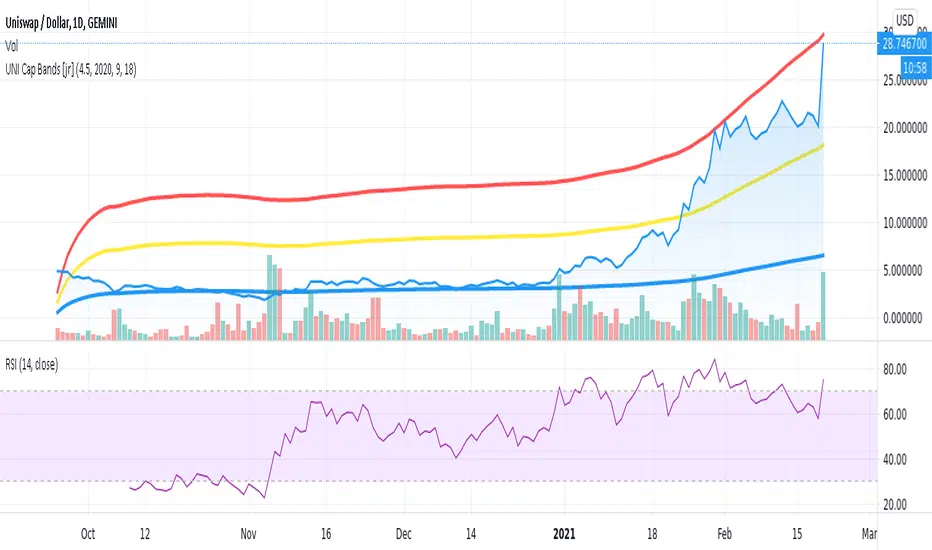
UNI Top Cap [jcray]Top cap indicator for UNI, the Uniswap Protocol token. Modified from BTC Top Cap by aamonkey

Fishing with SignalsFishing with Signals
HOW DOES IT WORK?
Fishing with Signals comprises of 3 indicators
1) Buy / Sell Signals
2) Band for Trend Recognition
3) ADX-DI Trend Identifier
Indicator 1 == Buy / Sell Signals
The signals are based on moving average exponential rectified by the previous high and low break at any real-time, it recognises the previous specified moving average deviation. If the predefined high and lows are broken along with current candle is closed below the specific moving average then sell is given and vice-versa for buy. The settings are not editable.
Indicator 2 == Band for Trend Recognition
The band comprises of 200 moving average with exponentially smoothening feature, there are three lines one can identify the trend if candles are below or above the band
Indicator 3 == ADX-DI Trend Identifier
The indicator gives a multiplication of ADX and the DI+ and DI-values, colour coded for bullish or bearish momentum and shows general market direction and divergence in a simpler visual way than the normal ADX-DI lines, a threshold value cannot be edited. The indicator is plotted relative to the 200 ema and can be seen as a "buffer" against price reversal. The ADX is used to indicate market direction, the existence or nonexistence of a trend and market momentum. Market direction is determined by the levels of the +DI and -DI. The ADX indicator, which varies in value from zero to 100, is the primary momentum indicator, default value is kept at +40 and -40. If the ADX is lowering or rising the DI line plotted will be moving as directed with change in colour and background filling. The Line hovering below and above the "buffer" is changing the colour with rising as navy and falling as maroon with intermittent colour of red and lime which also shows reversal.
HOW TO use the indicator?
For SHORT ==If the candles are below the Band for Trend Recognition and ADX-DI Trend Identifier is lowering and if the SELL SIGNAL comes one can go short with stop-loss be the close above top band and with momentum be positive.
For LONG == If the candles are above the Band for Trend Recognition and ADX-DI Trend Identifier is growing and if the BUY SIGNAL comes one can go Long with stop-loss be the close below lower band and with momentum be negative.
CAUTION!! : There will be false buy / sell signals also, where user have to verify with the other two indicators, for confirmation.
TARGET in any call = If the trend is up and buy signal comes then target may be trailed till next signal or close below band and vice versa for sell side.
USER OPTIONS : Choice of turning on / off the three indicators.
VISUAL CHECKS - The user could manually validate the back test results on various assets they would like to use this strategy on before putting it live.
USAGE MARKETS : Index Trading / Equities and also well with Commodities and Currencies.
TIME FRAME : Timeframe maybe any and as the user likes, still it works well with 5 min for less signals.
SETTING THE ALERTS : - Buy and Sell Signal alerts are advisable.
HOW TO GET ACCESS
Please click on the link / email available in the signature or send me a private message to get access.
FEEDBACK
Please click on the link/email in the signature or send me a private message for suggestions/feedbacks.
DISCLAIMER.
I AM NOT A FINANCIAL ADVISOR. THESE IDEAS ARE NOT ADVICE AND ARE FOR EDUCATION PURPOSES ONLY. ALWAYS DO YOUR OWN RESEARCH!
Utmost Care is taken to implement the suggestions of users and also tried to keep the chart neat and clean.
Greetings!!
Drop a mail to edgineer@yahoo.com or Drop a personal message for access.
Questions, Help, Discussion -> Telegram: Telegram: @miteysh

CPR by stockarrowsCPR along with Pivot lines provide the much needed important level right when the day begins. Please consider the lines as Support/Resistance and you can apply your strategy on top. It can be used for entry as well as exit.
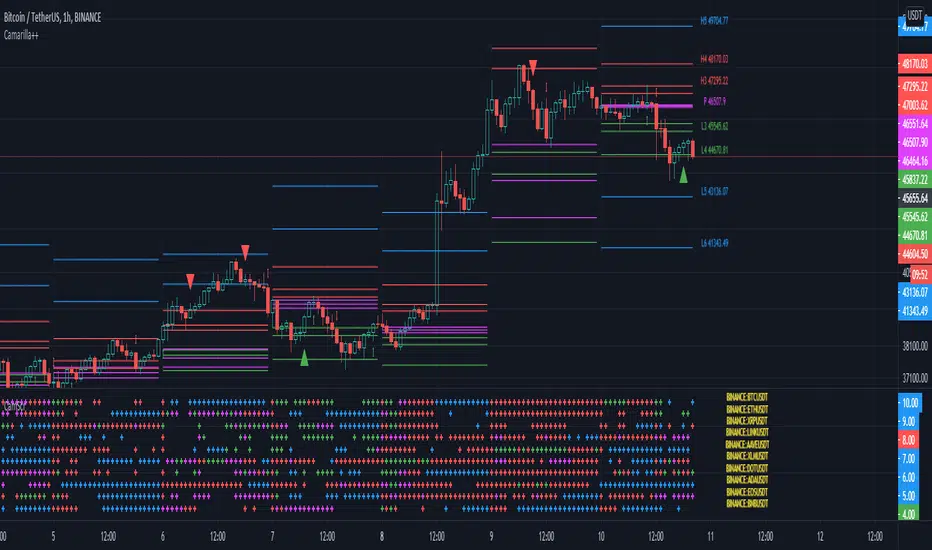
Camarilla screenerBasic script to screen up to 10 tickers with regards to their central pivot range and camarilla pivots.
Same color layout as the Danarilla script ().
The colors in the screener mean the following:
Blue : bar close price is > H4 or < L4
Red : bar close price is < H3 and > CPR top
Fuchsia : bar close price is < CPR top and > CPR bottom
Green : bar close price is < CPR bottom and > L3
No color means it is between H4/H3 or L3/L4
Resolution can be changed for the calculation of the pivots.
Script contains snippets from other screeners and the Danarilla script so many thanks to all who publish their scripts.