Cross3xCross3x – Early Rejection & Crossover Detection System
Cross3x is a powerful yet intuitive trading tool designed for traders who want early signals with structured risk management.
Built around a dual EMA crossover (18 & 33), it generates entry signals on every crossover and crossunder — no trend filter interference. The long-term SMA 99 provides context but doesn’t block valid setups.
Key Features:
Unfiltered Entries: Triangles appear on every EMA 18/33 crossover, ideal for catching reversals early.
Smart SL/TP/BE:
SL based on recent extremes (configurable lookback).
TP using adjustable Risk/Reward ratio (default 2:1).
BE level set at a % between entry and TP (e.g., 10% = just above cost).
Early Rejection Signals: Diamonds highlight potential reversals when price tests a moving average with a long wick during a countertrend candle:
🟩 Green diamond below bar → Potential Long Setup
🟥 Red diamond above bar → Potential Short Setup
Confirmation Points: Circles appear when price retraces properly after a crossover, marking optimal entry zones.
Real-Time Dashboard: Dynamic table shows current signal, SL, and TP levels.
Customizable Alerts: Enable alerts per signal type for timely execution.
Why Traders Love Cross3x:
It combines simplicity with intelligence. Whether you're scalping, swing trading, or building an algo strategy, Cross3x gives you clarity, timing, and discipline in one compact package.
Use the diamonds to anticipate moves, the triangles to confirm momentum, and the confirmation circles to refine entries — all backed by precise risk controls.
Perfect For:
Breakout traders
Pullback hunters
Price action + MA confluence strategies
Deploy Cross3x to turn basic crossovers into a complete edge.
Pivot Points

Micro fast trendline [sma] Overview
Micro Fast Trendline is an automated trendline drawing tool that connects pivot points in real-time. It dynamically creates trendlines between consecutive pivot highs and pivot lows, extending them forward to visualize potential support and resistance trajectories.
How It Works
Pivot Detection System
The indicator uses a symmetric pivot detection algorithm:
1. Scans for pivot highs: local peaks with lower highs on both left and right sides
2. Scans for pivot lows: local troughs with higher lows on both left and right sides
3. Confirms pivots only after the specified number of right bars have formed
4. Default settings: 5 bars left + 5 bars right (customizable)
Trendline Construction
When a new pivot is detected:
- **For Pivot Highs**: Draws a descending trendline from the previous pivot high to the current one (bearish)
- **For Pivot Lows**: Draws an ascending trendline from the previous pivot low to the current one (bullish)
- Calculates the slope between the two pivots
- Extends the line forward based on that slope for the specified number of bars (default 30)
Line Management System
The indicator includes intelligent line management:
- **Maximum Lines Control**: Limits the number of displayed trendlines (default 4, max 10)
- **Automatic Cleanup**: Removes oldest lines when the maximum is exceeded
- **Extension Expiry**: Deletes lines after they've extended beyond their lifespan
- Uses arrays to track pivot history and associated trendline objects
Key Features
- **Automatic Drawing**: No manual trendline drawing required
- **Real-time Updates**: Creates new trendlines as pivots form
- **Slope-based Extension**: Projects trendlines forward using calculated slope
- **Memory Management**: Automatically cleans up old lines to prevent clutter
- **Dual Tracking**: Separate systems for bullish and bearish trendlines
- **Optional Pivot Markers**: Can display pivot points for validation
Parameters
Pivot Configuration
- **Left Bars** (default 5): Number of bars to the left of the pivot for confirmation
- **Right Bars** (default 5): Number of bars to the right of the pivot for confirmation
- Higher values = fewer but more significant pivots
Visual Configuration
- Show Pivot Points (default off): Display triangles at confirmed pivots
- Bullish Line Color (default dark green): Color for upward trendlines
- Bearish Line Color (default dark red): Color for downward trendlines
- Line Width (default 1): Thickness of trendlines
- Maximum Lines (default 4, range 1-10): Maximum concurrent trendlines
- Line Extension (default 30 bars, range 10-200): Forward projection length
Interpretation
Bullish Trendlines (Green)
- Connect consecutive pivot lows
- Act as dynamic support levels
- Upward slope indicates strengthening uptrend
- Price breaking below suggests weakening support
Bearish Trendlines (Red)
- Connect consecutive pivot highs
- Act as dynamic resistance levels
- Downward slope indicates strengthening downtrend
- Price breaking above suggests weakening resistance
Trading Applications
- **Breakout Trading**: Watch for price breaking extended trendlines
- **Support/Resistance**: Use as dynamic S/R levels
- **Trend Confirmation**: Slope direction confirms trend strength
- **Reversal Signals**: Multiple trendline breaks may indicate reversals
Technical Implementation
This indicator uses:
- Custom type definition (PivotData) to store pivot price, time, and line object
- Array-based data structure for efficient pivot history management
- Dynamic line objects with calculated slope extension
- Automatic memory cleanup to prevent performance degradation
- Separate processing loops for highs and lows to avoid conflicts
Originality Statement
This indicator features a unique approach to automated trendline creation:
- Implements a custom data structure combining pivot data with line objects
- Uses slope-based mathematical projection for realistic line extensions
- Employs an intelligent cleanup system that removes expired lines automatically
- Maintains separate arrays for bullish/bearish trendlines with independent management
- Projects trendlines forward using calculated slope rather than simple horizontal extension
The combination of pivot detection, slope calculation, and automated line lifecycle management creates a hands-free trendline system.
Best Practices
- Lower pivot bar settings (3-5) for faster, more responsive trendlines
- Higher pivot bar settings (7-15) for major swings and longer-term trends
- Adjust line extension based on your trading timeframe
- Reduce maximum lines on lower timeframes to avoid clutter
- Increase maximum lines on higher timeframes for historical context
Works on all timeframes and asset classes. For educational purposes only. Not financial advice.

BOS PullbackBOS Pullback
Trend-following indicator that detects pullbacks for entries in a continuation phase.
A green diamond above a bearish candle signals a buy opportunity in an uptrend.
A red diamond below a bullish candle signals a sell opportunity in a downtrend.
Based on a configurable moving average (EMA, SMA, WMA). Ideal for Break of Structure (BOS) or pullback trading strategies.

ZZ RangeHappy Trading!
This is a real-time range detection indicator. Based on previous supply and demand levels, it classifies each new bar as Up, Down, or Range.
New supply and demand levels are typically detected within two bars. The indicator can be used as a filter and supports indicator-on-indicator functionality.
Intro
Concept
Usage and Settings Menu
Declaration for TradingView House Rules on Script Publishing
Disclaimer
1. Concept
Based on a variation of the Bilson-Gann Algorithm, this indicator calculates local supply and demand levels and determines whether the current price is:
Between those levels → Ranging
Above → Uptrending
Below → Downtrending
Less significant supply and demand levels are filtered out using a user-adjustable intensity setting.
2. Usage and Settings Menu
There are four settings available:
Indicator Timeframe – Display results from higher timeframes on the lower timeframe chart.
Range Detection Rule – Choose whether a bar must be fully inside supply and demand zones to be considered ranging, or if touching the zone is sufficient.
Bar Structure Basis – Select whether wicks or bodies of bars are used to calculate supply and demand levels.
Rule to set S&D – Choose among three rules defining how often new supply and demand levels are calculated. Each rule adjusts the sensitivity and responsiveness of detection.
Alert Signals Available:
Trend Signal 1 = Uptrend, 0 = Ranging, -1 = Downtrend
last supply Level
last demand Level
3. Declaration for TradingView House Rules on Script Publishing
The unique feature of ZZ Range is its real-time range detection capability.
This script is closed-source and invite-only, to support and compensate for months of development work.
4. Disclaimer
Trading involves risk, and losses can and do occur. This script is intended for informational and educational purposes only. All examples are hypothetical and not financial advice.
Decisions to buy, sell, hold, or trade securities, commodities, or other assets should be based on the advice of qualified financial professionals. Past performance does not guarantee future results.
Use this script at your own risk. It may contain bugs, and I cannot be held responsible for any financial losses resulting from its use.
Cheers!

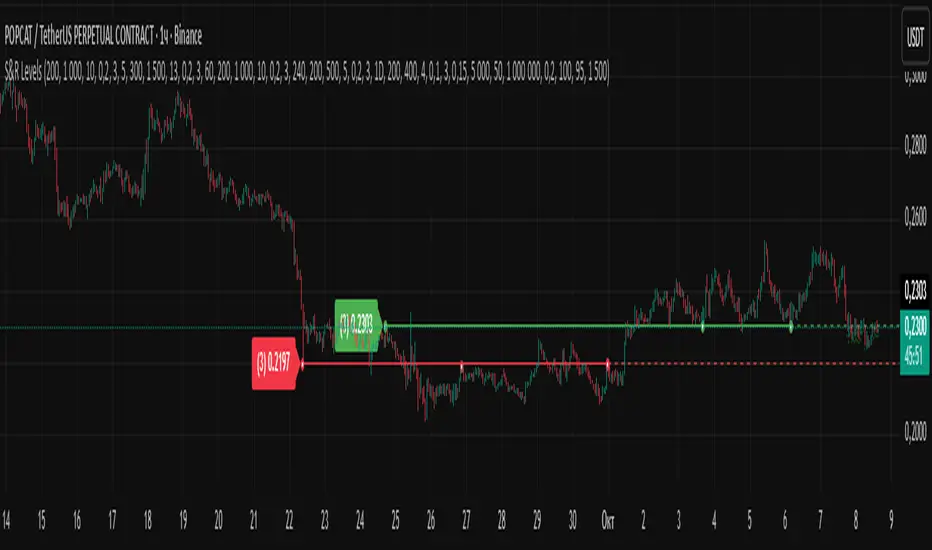
Support and Resistance LevelsSupport and Resistance Levels Indicator
Introducing an indicator that helps automatically identify key support and resistance levels. It analyzes historical data to detect price pivot points and draws horizontal lines based on them. This simplifies chart analysis and allows you to focus on important zones.
How the Indicator Works
The indicator searches for groups of pivot points (minimum three by default) that lie at the same price level within a specified tolerance (in ATR). If the price has bounced off this level three or more times—up or down—the indicator draws a line. The line displays all the points that formed it (small markers "•").
The line color depends on the type of the last point: green for support (lower pivots) and red for resistance (upper pivots). But remember, this is conditional—any level can act as support or resistance depending on the context. The key is that these are zones of interest where price often reacts.
Features
The indicator excels at finding strong levels, but on lower timeframes or during prolonged consolidation (sideways movement) due to market noise, it may draw many lines. To avoid accidentally removing useful levels, I didn't add automatic filtering. In such cases, just evaluate the levels manually—look at the context and the strength of the touches.
Main Feature: Alerts for Premium Subscription
If you have TradingView Premium, the indicator turns into a powerful scanner. Set up an alert for a list of hundreds of instruments: when the price on any of them approaches a level closely (by default within 0.15 ATR), you'll get a push notification. Add filters for trading volume (over 5 minutes or 24 hours) and volatility—and false signals are minimized.
For example, you have a list of 100 instruments. Set up the alert—and you'll immediately receive notifications for all where the price is already close to a level: "BTCUSD on 1h: price near resistance level 60,000", "ETHUSD on 4h: price near support 3,000", and so on. And if later the price on any other instrument from the list approaches a level—you'll get a new message with details. All that's left is to open the relevant chart, assess the situation, and decide: enter the trade or skip it. This saves hours of monitoring!
Индикатор уровней поддержки и сопротивления
Представляю индикатор, который помогает автоматически находить ключевые уровни поддержки и сопротивления. Он анализирует исторические данные, выявляя точки разворота цены, и строит на их основе горизонтальные линии. Это упрощает анализ графика и позволяет фокусироваться на важных зонах.
Как работает индикатор
Индикатор ищет группы точек разворота (по умолчанию минимум три), которые лежат на одной ценовой отметке в пределах заданной погрешности (в ATR). Если цена трижды (или больше) отскакивала от этого уровня — вверх или вниз, — индикатор рисует линию. На линии отображаются все точки, которые её сформировали (маленькие метки "•").
Цвет линии зависит от типа последней точки: зелёный для поддержки (нижние развороты) и красный для сопротивления (верхние). Но помните, это условно — любой уровень может работать как поддержка или сопротивление в зависимости от контекста. Суть в том, что это зоны интереса, где цена часто реагирует.
Особенности
Индикатор хорошо справляется с поиском сильных уровней, но на низких таймфреймах или в длительной консолидации (боковике) из-за рыночного шума может появиться много линий. Чтобы не рисковать удалением полезных уровней, я не добавил автоматическую фильтрацию. В таких случаях просто оценивайте уровни вручную — смотрите на контекст и силу касаний.
Главная фишка: Алерты для Premium-подписки
Если у вас TradingView Premium, индикатор превращается в мощный сканер. Создайте алерт на список из сотен инструментов: когда цена на любом из них подойдёт близко к уровню (по умолчанию в пределах 0.15 ATR), вы получите push-уведомление. Добавьте фильтры по объёму торгов (за 5 минут или 24 часа) и волатильности — и ложные сигналы минимизированы.
Например, у вас список из 100 инструментов. Настройте алерт — и сразу придут уведомления по всем, где цена уже близко к уровню: "BTCUSD на 1ч: цена у уровня сопротивления 60 000", "ETHUSD на 4ч: цена у поддержки 3000" и так далее. А если позже на любом другом инструменте из списка цена приблизится к уровню — придет новое сообщение с деталями. Остаётся только открыть нужный график, оценить ситуацию и решить: входить в сделку или пропустить. Это экономит часы мониторинга!
Key-Levels - D/W/M High-Low + Fib + MA🧭 Key-Levels – D/W/M High-Low + Fibonacci + Moving Averages
A complete multi-timeframe analysis toolkit that combines Daily, Weekly, and Monthly high/low levels, Fibonacci retracements, and customizable moving averages — all in one clean, efficient display.
Ideal for traders who want to identify key reaction zones, retracement levels, and trend alignment across multiple timeframes.
🔹 Features
1. Prior High/Low Levels
Plots Daily (PDH/PDL), Weekly (PWH/PWL), and Monthly (PMH/PML) key levels
Adjustable colors, styles (Solid / Dashed / Dotted), and line widths
Optional midline display for each timeframe
Displays live labels with price values and % difference from current close
Extend lines rightward to project future price interactions
2. Fibonacci Retracement
Auto-detects swing highs/lows using configurable pivot lengths
Smart pivot logic prioritizes major swings based on % span
Auto-orients retracements depending on trend direction
Customizable visibility and color for each Fibonacci level
Supports 0.236 → 1.618 levels, with optional auto-extension in uptrend scenarios
Displays ratio + price for each level label
3. Pivot Labels
Optionally show pivot high/low labels with customizable text and background colors
Independent control of left/right length and label style
4. Moving Averages
Up to three customizable MAs (default: 8 EMA, 21 EMA, 50 SMA)
Choose between EMA or SMA for each
Toggle individual or all moving averages
Adjustable lengths, colors, and line widths
5. Alerts
Built-in alert condition for price crossing a user-defined level
Clean alert message format with ticker symbol and live price
⚙️ Customization
Flexible style controls for lines, labels, and colors
Adjustable right-extension length for projecting levels
Font size and visibility toggles for all elements
Smart grouping for intuitive settings management
📈 Ideal For
Identifying key reversal or breakout zones
Spotting Fibonacci confluence between retracements and prior highs/lows
Tracking trend structure via multi-timeframe MAs
Swing traders, intraday traders, and technical analysts
💡 Summary
Key-Levels – D/W/M High-Low + Fib + MA is a professional-grade indicator designed to simplify complex multi-timeframe analysis.
It helps you see the bigger picture, find actionable zones, and trade with confidence.
🧩 Compatible with any market and timeframe.

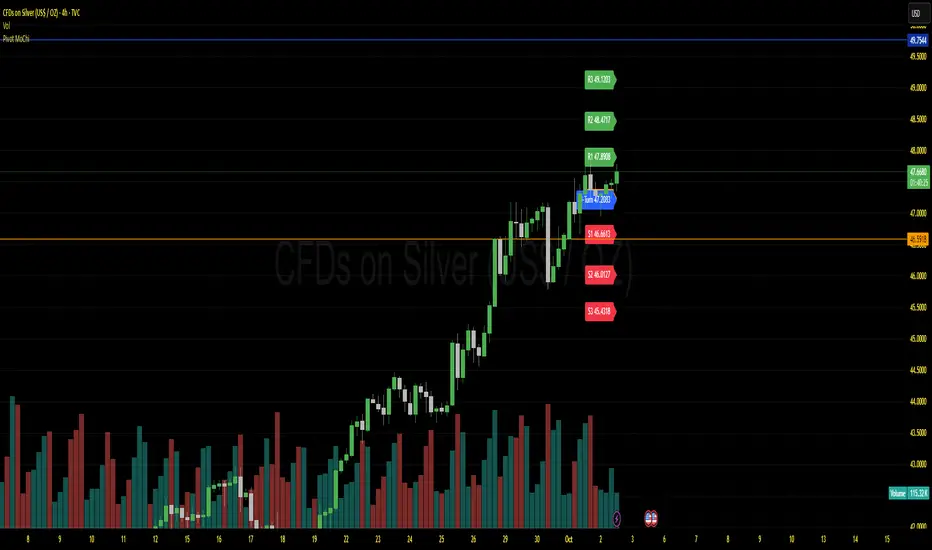
Pivot MoChiThis uses Current Day opening in place of previous day close
More Dynamic than Traditional Pivots
Candle Opens by HAZED🎯 Candle Opens by HAZED - Multi-Timeframe Open Levels Indicator
📊 Overview
This powerful indicator displays multiple timeframe opening prices on your chart, providing crucial reference levels that institutional traders and algorithms frequently monitor. Track up to 7 different timeframe opens simultaneously, from 1-hour to yearly, with advanced visualization features including dynamic coloring, heatmap analysis, and real-time status tracking.
✨ Key Features
📈 Multi-Timeframe Support:
- 1H, 4H, Daily, Weekly, Monthly, Quarterly, and Yearly opens
- Each timeframe can be individually enabled/disabled
- Automatic visibility adjustment based on chart timeframe
🎨 Dynamic Visual System:
- Smart Color Coding: Lines automatically change color based on price position (green above, red below)
- Customizable Styling: Adjust line thickness, transparency, and colors
- Intelligent Line Positioning: Choose between equal-length or staggered lines for better visibility
- Enhanced Labels: Display timeframe only or include price with colored background
🌈 Advanced Heatmap:
- Background coloring shows overall market sentiment across all timeframes
- Gradient or solid color modes
- Instantly see when multiple timeframes align bullish or bearish
📊 Status Table Dashboard:
- Real-time overview of all active opens
- Shows current price position relative to each open
- Simplified view when all timeframes align
- Customizable position and font style
⚙️ Professional Tools:
- Alert system for new open levels
- Extended hours session support
- Price discovery mode for EOD/intraday discrepancies
- Left/right line extensions for enhanced visibility
💡 Trading Applications
Support & Resistance:
Opening prices act as natural support/resistance levels. Price often reacts at these levels, providing entry/exit opportunities.
Trend Confirmation:
When price is above multiple opens (especially higher timeframes), it confirms bullish momentum. The opposite indicates bearish pressure.
Mean Reversion:
Price tends to revert to significant opens, particularly daily and weekly levels. Use these as targets for counter-trend trades.
Breakout Trading:
Monitor when price breaks above/below clustered opens for potential continuation moves.
Risk Management:
Use opens as logical stop-loss levels or position sizing references based on distance from key opens.
🔧 Indicator Settings
Timeframes Section:
- Toggle each timeframe on/off
- Customize individual colors
Visual Style Section:
- Dynamic Colors: Auto-color based on price position
- Line Thickness: 1-4 pixels
- Transparency: 0-80%
- Extension Length: How far lines extend right
- Label Style: Plain or enhanced with price
Heatmap Section:
- Enable/disable background coloring
- Adjust transparency
- Choose gradient or solid zones
Status Table Section:
- Position on chart
- Font selection
Advanced Section:
- Enable alerts for new opens
- Price discovery mode
- Extended hours inclusion
]📈 Best Practices
1. Timeframe Selection:
- For intraday: Focus on 1H, 4H, and Daily
- For swing trading: Daily, Weekly, Monthly
- For position trading: Monthly, Quarterly, Yearly
2. Color Coding:
- Enable dynamic colors for instant sentiment reading
- Use heatmap for overall market bias
3. Confluence Zones:
- Pay special attention when multiple opens cluster
- These zones often produce stronger reactions
4. Alignment Signals:
- When all timeframes show same color = strong trend
- Mixed colors = potential consolidation or reversal zone
🎯 Pro Tips
- Volume Confirmation: Combine with volume indicators to confirm reactions at open levels
- Multiple Instruments: Compare opens across correlated assets for divergences
- News Events: Opens often act as magnets after major news releases
- Options Trading: Weekly and monthly opens align with options expiry levels
- Algorithmic Levels: Many algorithms use these opens for entries/exits
🔄 Updates in Version 8.3
- Added 1H and 4H timeframe support
- Enhanced dynamic color system
- Implemented heatmap visualization
- Added real-time status table
- Optimized performance for smoother operation
- Improved label styling options
- Better yearly timeframe detection
⚡ Performance Optimizations
This indicator uses advanced Pine Script v6 features for optimal performance:
- Efficient object reuse instead of recreation
- Smart calculation loops
- Minimal repainting
- Optimized for real-time updates
📝 Notes
- Works on all markets (stocks, forex, crypto, futures)
- Best on timeframes lower than the opens you're tracking
- Lines automatically hide when their timeframe is lower than chart timeframe
- Past opens are not displayed (indicator shows current opens only)
🙏 Credits & Support
Created by HAZED | Version 8.3
Optimized for TradingView Pine Script v6
For questions, suggestions, or bug reports, please comment below.
If you find this indicator useful, please consider leaving a like and a follow!
Remember: No indicator is perfect. Always use proper risk management and combine multiple confirmation signals in your trading decisions.

Supply Zone & Demand M15Supply Zone & Demand M15
This indicator automatically detects and plots supply and demand zones based on 15-minute pivots and impulse strength.
🔎 Features
Multi-timeframe visibility: Zones are detected on M15 pivots but can be viewed on any lower timeframe (M1, M5, etc.).
Zone validation: Zones appear only after a strong impulsive move, measured against ATR.
Retest counting: Each time price retests a zone, a counter is displayed.
Retests can be merged by time window (No merge, 30 minutes, or 1 hour).
Zone merging: Nearby overlapping zones are automatically combined with a tolerance setting.
Configurable display: Choose between immediate display of zones or only after N retests.
Customizable style: Full control over colors, extension to the left, and max number of zones kept.
⚙️ Settings
Pivot strength: Minimum bars for swing highs/lows.
Impulse filter: Require ATR-based momentum before validating a zone.
Zone width: Defined as a multiple of ATR.
Retest merge: Select None, 30 minutes, or 1 hour.
Invalidation: Option to remove zones once broken.
Display mode: Show zones immediately or only after the required number of retests.
✅ Use Cases
Identify high-probability reversal areas.
Track how many times a zone has been retested.
Spot confluence when historical zones align with current price action.
⚠️ Disclaimer: This indicator is a technical tool, not financial advice. Always combine with proper risk management.

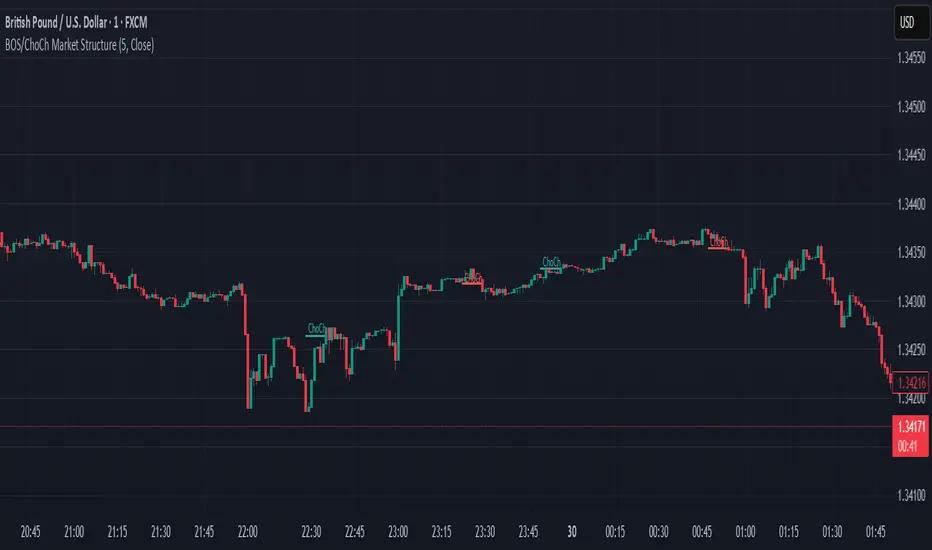
BOS & ChoCh Market StructureBOS/ChoCh Market Structure Indicator
This indicator identifies key market structure shifts using Break of Structure (BOS) and Change of Character (ChoCh) signals based on pivot point analysis.
Concept
Break of Structure (BOS) occurs when price breaks through a significant pivot level in the direction of the current trend, signaling trend continuation. A bullish BOS happens when price breaks above a pivot high while in an uptrend, while a bearish BOS occurs when price breaks below a pivot low during a downtrend.
Change of Character (ChoCh) signals a potential trend reversal. It occurs when price breaks against the prevailing trend - breaking above a pivot high while in a downtrend, or breaking below a pivot low while in an uptrend. This indicates the market structure is shifting.
How It Works
The indicator automatically detects swing highs and lows using configurable pivot strength. When price breaks these levels, it plots:
Color-coded labels (cyan for bullish breaks, red for bearish breaks)
Small horizontal lines marking the exact breakout level
Extended lines from pivot points showing key support/resistance levels
Settings
Pivot Strength - Number of candles on each side required to confirm a swing high/low (default: 5). Higher values identify more significant pivots but produce fewer signals.
Breakout Confirmation - Choose whether breakouts require a candle close beyond the level ("Close") or just a wick touch ("Wick").
Show BOS / Show ChoCh - Toggle visibility of Break of Structure and Change of Character signals independently.
Colors - Customize the colors for bullish (cyan) and bearish (red) signals.
Perfect for swing traders and market structure analysis.
Swing High/Low MarkerThis indicator allows you to find the swing highs and lows of the chart and offsets it by the ATR and a custom factor to give you concrete breakout and stop loss prices.

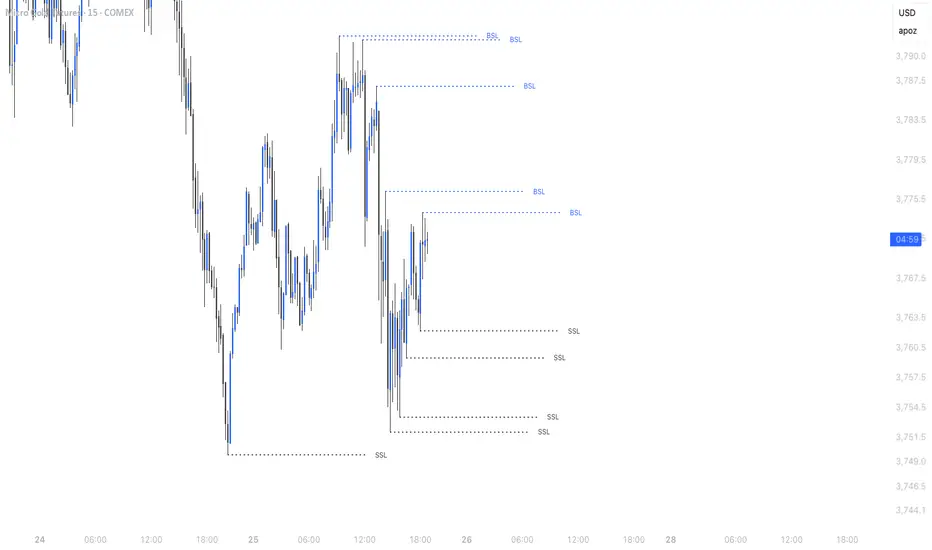
Simple Liquidity Sweep [rare_gold_steak]- Shows when the liquidity was swept.
- Shows BSL and SSL.
- Simple options to change styling.
I use it personally and some people liked it so I thought i'll share it with the public.
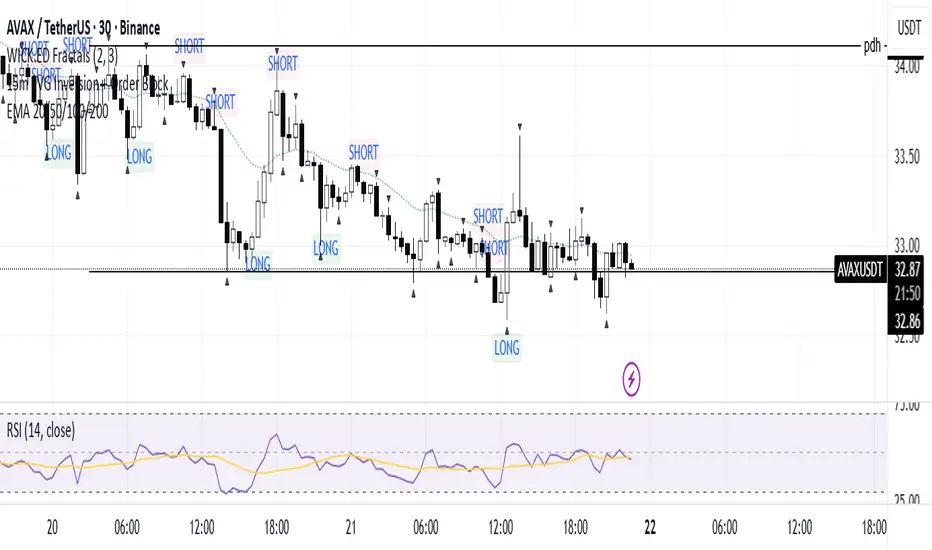
15m FVG Inversion + Order BlockThe indicator finds the inversion of the FVG 15 minutes and the order block, after which it gives an entry signal.
StockAlgo | Alpha v1.1Stock Algo Alpha provides Buy Sell indicators along with automated trading ability.

Tomorrow's Pivot Points [SMH]這個TradingView指標不同於內置的Pivot Point指標,因為它能夠提前顯示明天的Pivot Point。透過預測下一交易日的支撐與阻力位置,交易員可以更早部署策略,為隔日的市場波動做好準備。
This TradingView indicator is different from the built-in Pivot Point tool because it can display tomorrow’s Pivot Points in advance. By forecasting support and resistance levels for the next trading day, traders can position their strategies earlier and be well-prepared for upcoming market movements.

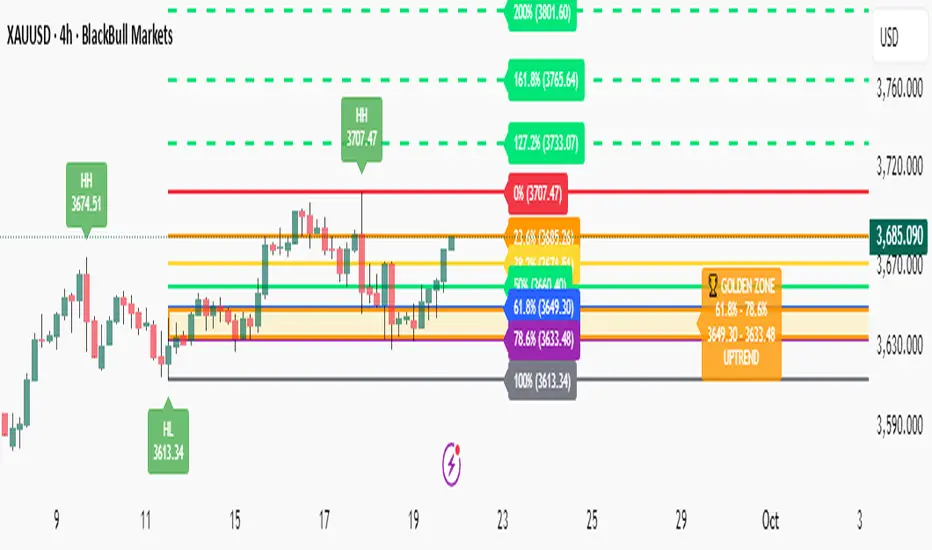
Fibonacci with Golden Zone - Trend Aware🎯 What This Indicator Does:
This advanced Fibonacci tool automatically detects trend direction and adapts Golden Zone calculations accordingly, providing dynamic support/resistance levels with market structure analysis.
✨ Key Features:
🔄 Trend-Aware Golden Zone: Automatically adjusts 61.8%-78.6% zone based on market direction
📈 Market Structure Labels: Shows HH, HL, LH, LL patterns with price levels
🎯 Smart Fibonacci Levels: Retracements (0%, 23.6%, 38.2%, 50%, 61.8%, 78.6%, 100%)
🚀 Extension Targets: 127.2%, 161.8%, 200%, 261.8% projections
📊 Pivot Points: Optional daily/weekly pivot levels
🔔 Smart Alerts: Golden Zone entry and extension target alerts
🧠 How It Works:
Uptrend: Golden Zone acts as support (retracement from swing high)
Downtrend: Golden Zone acts as resistance (retracement from swing low)
Auto-Detection: Uses trend MA to determine market direction
Structure Analysis: Identifies swing patterns for better entries
⚙️ Settings:
Lookback Period: Swing detection sensitivity (5-50)
Trend Period: Moving average for trend detection (20-200)
Golden Zone: Toggle 61.8%-78.6% zone display
Market Structure: Show HH/HL/LH/LL labels
Pivot Points: Optional daily pivot levels
📋 Best Use Cases:
🥇 Gold/Forex Trading: Perfect for XAUUSD analysis
📈 Swing Trading: Identify key reversal zones
🎯 Target Setting: Extension levels for profit taking
📊 Trend Following: Align trades with market direction
🎨 Visual Features:
🟡 Golden Zone Box: Highlighted support/resistance area
🏷️ Price Labels: Exact levels on all Fibonacci lines
🎨 Color Coding: Green for uptrend, Red for downtrend
📱 Clean Interface: Professional, non-cluttered design
🔔 Alert System:
🏆 Price entering Golden Zone
🎯 Approaching extension targets (127.2%, 161.8%)
📊 Includes trend direction in alerts

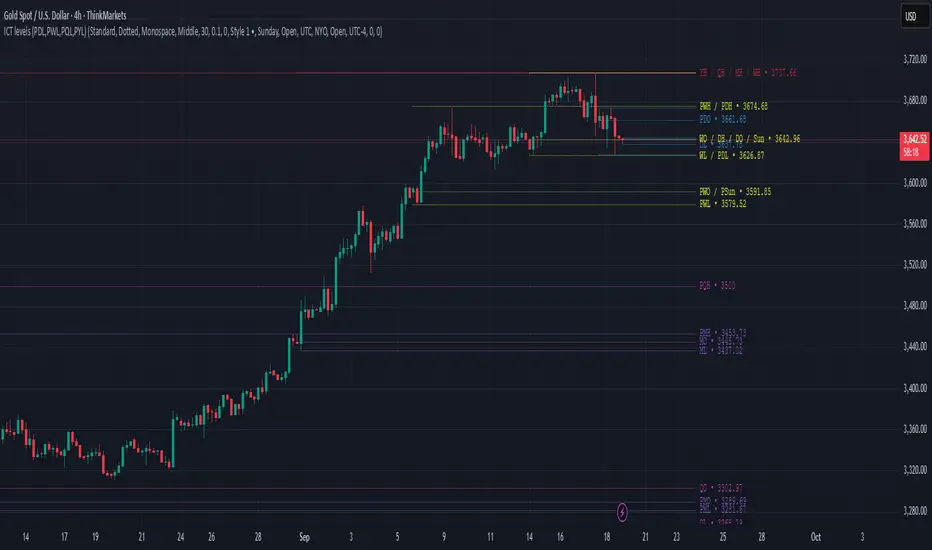
ICT levels (PDL,PWL,PQL,PYL) PDHThis indicator plots ICT reference levels for multiple timeframes, including:
Daily (DO, DH, DL, PDO, PDH, PDL)
Weekly (WO, WH, WL, PWO, PWH, PWL)
Monthly (MO, MH, ML, PMO, PMH, PML)
Quarterly (QO, QH, QL, PQO, PQH, PQL)
Yearly (YO, YH, YL, PYO, PYH, PYL)
🔹 Custom Target (NYO or user-defined):
The script also lets you display a special target level (e.g. New York Open) at a user-defined hour:minute with selectable timezone.
🔹 Day of Week levels (DoW):
You can choose a specific weekday (e.g. Tuesday Open/High/Low/Close) with adjustable timezone, allowing flexible session-based analysis.
🔹 Display & Style Options:
Extend lines (None, Right, Left, Both)
Line style (Solid, Dashed, Dotted)
Font type (Default, Monospace)
Label position (Top or Middle, with spacing adjustment)
Offset bars for labels
Merge labels if levels are too close (threshold % configurable)
🔹 Priority Handling:
Includes High Timeframe Priority (TFP) option so higher-TF levels overwrite lower ones when overlapping.
🔹 Customization:
Global text and line colors
Individual colors for Day, Week, Month, Quarter, Year, DoW, and Target
Option to show/hide prices next to labels in different styles
Trendline Breakout Strategy [KedArc Quant] Description
A single, rule-based system that builds two trendlines from confirmed swing pivots and trades their breakouts, with optional retest, trend-regime gates (EMA / HTF EMA), and ATR-based risk. All parts serve one decision flow: structure → breakout → gated entry → managed risk.
What it does (for traders)
Draws Up line (teal) through the last two Higher Lows and Down line (red) through the last two Lower Highs, then extends them forward.
Long when price breaks above red; Short when price breaks below teal.
Optional Retest entry: after a break, wait for a pullback toward the broken line within an ATR-scaled buffer.
Uses ATR stop and R-multiple target so risk is consistent across symbols/timeframes.
Labels HL1/HL2/LH1/LH2 so non-coders can verify which pivots built each line.
Why these components are combined
Pure breakout systems on trendlines suffer from three practical issues:
False breaks in chop → solved by trend-regime gates (EMA / HTF EMA) that only allow trades aligned with the prevailing trend.
Uneven volatility across markets/timeframes → solved by ATR-based stop/target, normalizing distance so R-multiples are comparable.
First break whipsaws near wedge apices → mitigated by the optional retest rule that demands a pullback/hold before entry.
These modules are not separate indicators with their own signals. They are support roles inside one method.
The pivot engine defines structure, the breakout detector defines signal, the regime gates decide if we’re allowed to take that signal, and the ATR module sizes risk.
Together they make the trendline breakout usable, testable, and explainable.
How it works (mechanism; each component explained)
1) Pivot engine (structure, non-repainting)
Swings are confirmed with ta.pivotlow/high(L, R). A pivot only exists after R bars (no look-ahead), so once plotted, the line built from those pivots will not repaint.
2) Trendline builder (geometry)
Teal line updates when two consecutive pivot lows satisfy HL2.price > HL1.price (and HL2 occurs after HL1).
Red line updates when two consecutive pivot highs satisfy LH2.price < LH1.price.
Lines are extended right and their current value is read every bar via line.get_price().
3) Breakout detector (signal)
On every bar, compute:
crossover(close, redLine) ⇒ Long breakout
crossunder(close, tealLine) ⇒ Short breakdown
4) Regime gates (trend filters, not separate signals)
EMA gate: allow longs only if close > EMA(len), shorts only if close < EMA(len).
HTF EMA gate (optional): same rule on a higher timeframe to avoid fighting the larger trend.
These do not create entries; they simply permit or block the breakout signal.
5) Retest module (optional confirmation)
After a breakout, record the line price. A valid retest occurs if price pulls back within an ATR-scaled buffer toward that broken line and then closes back in the breakout direction.
This reduces first-tick fakeouts.
6) Risk module (position exit)
Initial stop = ATR(len) × atrMult from entry.
Target = tpR × (ATR × atrMult) (e.g., 2R).
This keeps results consistent across instruments/timeframes.
Entries & exits
Long entry
Base: close breaks above red and passes EMA/HTF gates.
Retest (if enabled): after the break, price pulls back near the broken red line (within the ATR buffer) and holds; then enter.
Short entry
Mirror logic with teal (break below & gates), optionally with a retest.
Exit
strategy.exit places ATR stop & R-multiple target automatically.
Optional “flip”: close if the opposite base signal triggers.
How to use it (step-by-step)
Timeframe: 1–15m for intraday, 1–4h for swing.
Start defaults: Pivot L/R = 5, EMA len = 200, ATR len = 14, ATR mult = 2, TP = 2R, Retest = ON.
Tune sensitivity:
Faster lines (more trades): set L/R = 3–4.
Fewer counter-trend trades: enable HTF EMA (e.g., 60-min or Daily).
Visual audit: labels HL1/HL2 & LH1/LH2 show which pivots built each line—verify by eye.
Alerts: use Long breakout, Short breakdown, and Retest alerts to automate.
Originality (why it merits publication)
Trades the visualization: many “auto-trendline” tools only draw lines; this one turns them into testable, alertable rules.
Integrated design: each component has a defined role in the same pipeline—no unrelated indicators bolted together.
Transparent & non-repainting: pivot confirmation removes look-ahead; labels let non-coders understand the setup that produced each signal.
Notes & limitations
Lines update only after pivot confirmation; that lag is intentional to avoid repainting.
Breakouts near an apex can whipsaw; prefer Retest and/or HTF gate in choppy regimes.
Backtests are idealized; forward-test and size risk appropriately.
⚠️ Disclaimer
This script is provided for educational purposes only.
Past performance does not guarantee future results.
Trading involves risk, and users should exercise caution and use proper risk management when applying this strategy.

Previous OHLC D/W/M (Anchored - fixed)Open, close, high and low of previous month, week and day with right extension.

EMA Support & ResistanceEducational Purpose only
This indicator combines VWAP, multiple Exponential Moving Averages (EMA 20,/VWAP ), Support and Resistance
VWAP (Volume Weighted Average Price) helps identify fair value and intraday bias.
EMA 20 act as dynamic support and resistance levels for short, medium, and long-term trends.
CPR (Central Pivot Range) is calculated from the previous day’s High, Low, and Close. It provides intraday reference zones S1/S2/S3 & R1/R2/R3 that traders use to gauge market direction and trend strength.
This tool is built for educational purposes only — to help visualize common support & resistance zones and learn how VWAP + EMAs + S/R interact in live markets. It is not financial advice and should not be used as a standalone trading system.

Weekly/Monthly Golden ATR LevelsWeekly/Monthly Golden ATR Levels
This indicator is designed to give traders a clear, rule-based framework for identifying support and resistance zones anchored to prior period ranges and the market’s own volatility. It uses the Average True Range (ATR) as a measure of how far price can realistically stretch, then projects fixed levels from the midpoint of the prior week and prior month.
Rather than “moving targets” that repaint, these levels are frozen at the start of each new week and month and stay fixed until the next period begins. This makes them reliable rails for both intraday and swing trading.
What It Plots
Weekly Midpoint (last week’s High + Low ÷ 2)
From this mid, the script projects:
Weekly +1 / −1 ATR
Weekly +2 / −2 ATR
Monthly Midpoint (last month’s High + Low ÷ 2)
From this mid, the script projects:
Monthly +1 / −1 ATR
Monthly +2 / −2 ATR
Customization
Set ATR length & timeframe (default: 14 ATR on Daily bars).
Adjust multipliers for Level 1 (±1 ATR) and Level 2 (±2 ATR).
Choose line color, style, and width separately for weekly and monthly bands.
Toggle labels on/off.
How to Use
Context at the Open
If price opens above last week’s midpoint, bias favors upside toward +1 / +2.
If price opens below the midpoint, bias favors downside toward −1 / −2.
Weekly Bands = Short-Term Rails
+1 / −1 ATR: Rotation pivots. Expect intraday reaction.
+2 / −2 ATR: Extreme stretch zones. Reversals or breakouts often occur here.
Monthly Bands = Big Picture Rails
Use these for swing positioning, or as “outer guardrails” on intraday charts.
When weekly and monthly bands cluster → high-confluence zone.
Trade Playbook
Trend Day: Hold above +1 → target +2. Break below −1 → target −2.
Range Day: Fade first test of ±2, scalp toward ±1 or midpoint.
Catalyst/News Day: Use with caution—levels provide context, not barriers.
Risk Management
Place stops just outside the band you’re trading against.
Scale profits at the next inner level (e.g., short from +2, cover partial at +1).
Runners can trail to the midpoint or opposite side.
Why It Works
ATR measures volatility—how far price tends to travel in a given period.
Anchoring to prior highs and lows captures where real supply/demand last clashed.
Combining the two gives levels that are statistically relevant, widely observed, and psychologically sticky.
Trading books from Mark Douglas (Trading in the Zone), Jared Tendler (The Mental Game of Trading), and Oliver Kell (Victory in Stock Trading) all stress the importance of having objective, repeatable reference points. These levels deliver that discipline—removing guesswork and reducing emotional trading

Interval Highlighter with High/Low AlertsInterval Highlighter with High/Low Alerts
Overview:
This Pine Script indicator enhances chart analysis by highlighting specific time intervals and marking the highest and lowest prices within those periods. It supports three customizable modes:
Date Range: Highlight a user-defined period with background shading and plot the highest and lowest prices.
Days of the Week: Highlight specific weekdays with background colors and plot the highest and lowest prices for each day.
Intraday Interval: Highlight a specific intraday time range (e.g., 12:30 PM to 4:30 PM) with background shading and plot the highest and lowest prices within that interval.
Alerts are triggered when the price touches any of the highlighted high or low levels, providing real-time notifications for potential trading opportunities.
High and low lines extend to the right and remain visible after the interval ends. This ensures they act as actionable reference points for alerts between intervals, allowing users to monitor critical levels until a new interval of the same category forms.
Features:
Customizable Time Intervals: Define specific date ranges, weekdays, or intraday intervals to highlight on the chart.
High/Low Tracking: Automatically plots the highest and lowest prices within the defined intervals.
Real-Time Alerts: Set up alerts to notify when the price touches any of the highlighted high or low levels.
Actionable Lines: High/low lines remain visible after interval completion to serve as reference points for alerts.
Visual Enhancements: Customize background colors and line styles for each interval type.
Usage:
Apply the indicator to your chart.
Configure the desired modes (Date Range, Days of the Week, Intraday Interval) in the settings.
Customize the appearance settings to match your preferences.
Set up alerts based on the highlighted high/low levels.
Disclaimer:
This indicator is designed to assist in identifying potential areas of interest based on historical high and low levels within specified intervals. It is not intended as a standalone trading signal. Users should employ additional technical analysis tools and conduct thorough research before making trading decisions.
