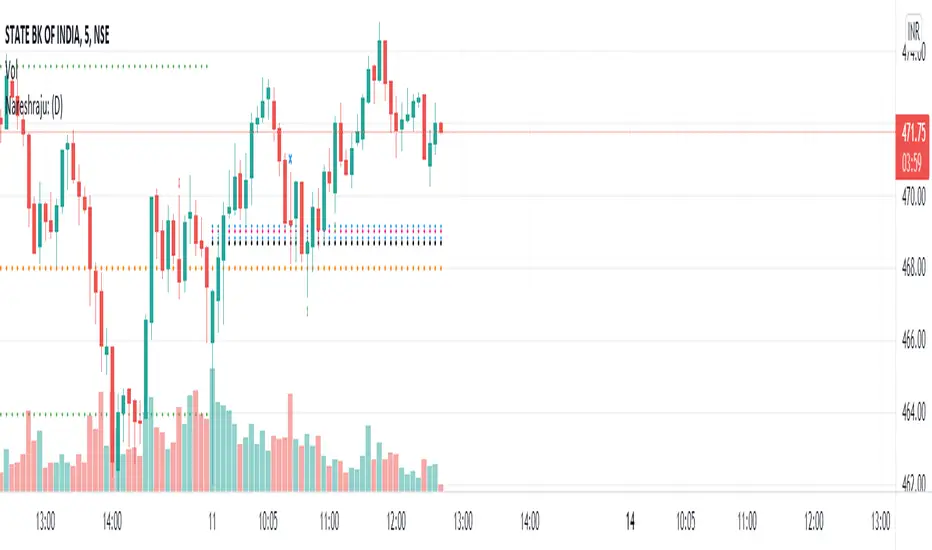
Nareshraju CPRHi friends this is Cpr indicator which means central pivot range. it contains supports and resistances to take perfect entry.
Pivot Points
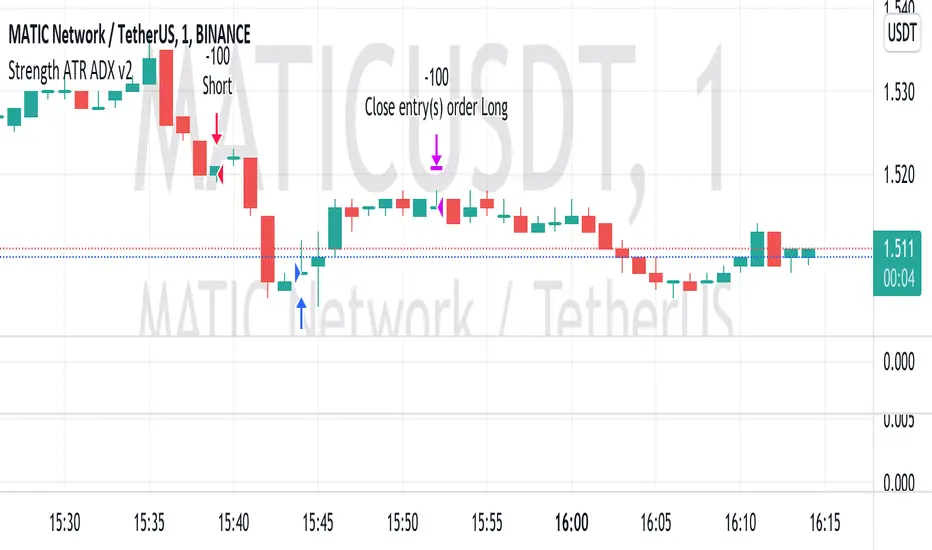
Strength ATR ADX v2This strategy looks for strong price movements with a high chance of a reversal on the difference in the rates of 6 currency pairs. A combination of ADX DI- and ATR is used for confirmation.
Added the ability to close trades by TP and SL to the strategy. (off by default)
Built-in martingale and reverse martingale (off by default)
The lot size is set in the strategy settings themselves!!!
The best results were obtained on XAUUSD 5M and on 1M cryptocurrency pairs.
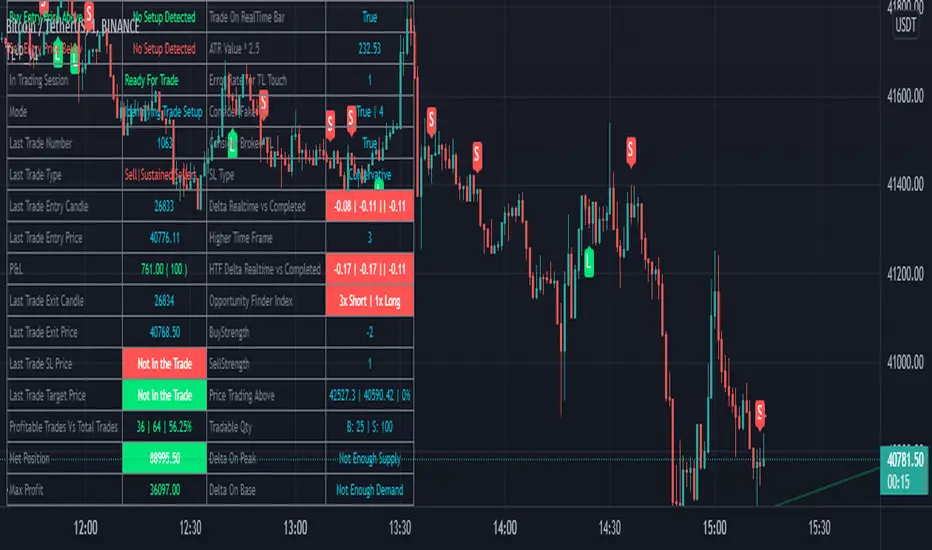
BreathEasy TrendLine Scalping - Pro Dear Traders,
Trendlines are the one particular word ever trader would definitely know what it is. But the way it gets applied on to the chart is the one thing which needs to debated on. Traders definitely love to trade Trendline breaks like the way I do.
When it comes to Trendlines , we generally categorize them based on the Major Trendline and Minor Trendline, however concept of Breakout or Breakdown of trendline wouldn’t change whether it’s a Major or Minor Trendline. Trendline is by nature powerful and prices do respect the same. In order to add more power, I have combined the Trendlines with Fibonacci to time the entries correctly.
What you can expect from this Indicator?
This indicator is mainly designed to work on the lower time frames (Intraday Indicator), between 1 minute TF to 5-minute TF or max 10 minute.
It is necessary that you use this indicator on a highly liquid instruments such that calculations are smooth. since, price gaps may affect the accuracy of the results.
Script detects & plots Trendlines, based on the Pivot Points found on the chart and helps you take trading decisions wisely.
What is the scope or idea behind developing this indicator?
1. Its majorly build to identify the Trendline breaks (Break Out and Break Down)
2. Identify, Trend line False Break.
3. Identify the possible consolidation zone and intimate about the Consolidation Break
4. Peak Buying | Selling Possibility when Prices does cross levels based on the fib ratios.
Couple of Additional info | Points to Understand | Point of Comfort zone
1. Provides Alerts when the event happens such as (Important Trendline has Broken, Consolidation zone is broken etc.) and places a dummy entry indication that Indicator took a trade with the SL and Target if any.
Note: All the entries plotted by this indicator are just DUMMY for your educational purpose only. you may seek support from your financial advisor before placing similar trades in real market.
2. Indicator Can constantly notify you on ever time SL is updated, if necessary to keep you aware of. I have adopted volatility-based SL such that, if prices move too quick and too far SL also will move quick and gives enough room for the price to play its role. If the prices tend to go flat SL acts flat. It can also help you lock in some profits when your PNL reaches certain level either by price or by percentage. (All options are customizable)
3. It also takes HTF information wherever necessary if the indicator needs some additional confirmations like Trendline zone in higher timeframe or fib level in HTF zone. You can certainly advice indicator to direct which HTF to use.
4. If the Script need Volume confirmation there are possible options provided for you to direct the indicator to refer the volume source. Like if you are trading BNF you may direct the volume source to its related futures
5. Options are provided to customize to Qty and Lot and based on the suggested option it plots dummy entries with suggested Qty to trade with.
6. You may set the Max loss level for each of the trade which you would like to risk so that Indicator detects the setups which are in close proximity to that level. It so happens it detects setup with max loss level of 7K and due to price fluctuations dummy entry may lose bit more than what was capped.
There are many additional options | information’s | suitable Notifications via Alerts provided. To give you enough information for your trading decisions along with Dummy Trades info.
IMPORTANT POINT TO CONSIDER:
REPAINTING : I use the word “real time data” in my indicator tooltip in conjunction and help you understand what indicator does. By this you can understand the impacts of the same.
I strongly recommend you read the tooltips in order to understand the indicator better.
Enjoy!
DISCLAIMER : No sharing, copying, reselling, modifying, or any other forms of use are authorized for our documents, script / strategy, and the information published with them. This informational planning script / strategy is strictly for individual use and educational purposes only. This is not financial or investment advice. Investments are always made at your own risk and are based on your personal judgement. I am not responsible for any losses you may incur. Please invest wisely.
Happy to receive suggestions and feedback in order to improve the performance of the indicator better.
PAL indicator - Price Action LinesThis is the PALindicator - this is where the price action happens, PAL stands for Price Action Lines
----------
What is this indicator showing?
- there are 4 lines to work with
- red and yellow lines represents bearish levels
- blue and green lines represents bullish levels
- you can understand this indicator as dynamic support & resistance lines
- it will show you easy to read support & resistance breakouts
- it's something between pivot points and Fibonacci Retracement lines
----------
How does this indicator work?
- as mentioned before, there are 4 lines, on my opinion the blue and the green lines show you a continuation of a bullish trend
- the yellow and the red lines show you a continuation of a bearish trend
- if your crypto pair, forex pair, stock or any other instrument close above the blue line, its an buy opportunity
- if your crypto pair, forex pair, stock or any other instrument close above the yellow line, its an sell opportunity
----------
Which timeframe you recommend?
- we recommend to use this indicator for daily timeframe
- we also recommend to use this indicator for weekly and monthly timeframe
- in the indicator settings you can change the indicator timeframe from 250 (daily chart) to 52 (weekly chart) and 12 (monthly chart)
- after changing the indicator timeframe you have to change the chart timeframe to daily, weekly or monthly
- it's also possible to use this indicator intraday, but we don't recommend to use it with instruments which you can't trade (24/5 24/7)
send me a message for a free trial

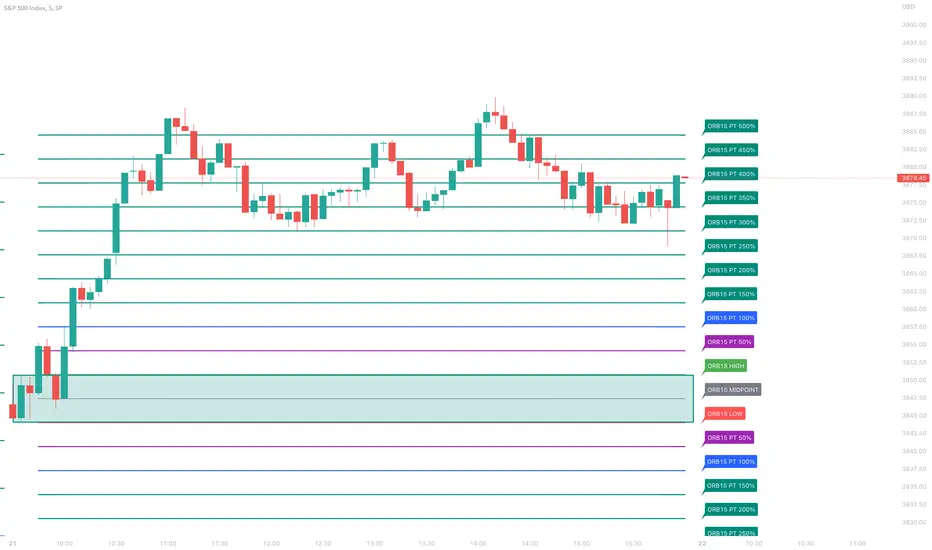
ORB with Price TargetsThe ORB with Price Targets Script will display the Opening Range (15 minutes of the open session by default) High and Low. It will then render upper and 2 lower Price Target Levels based on 50% and 100% profit targets of the Opening Range.
The opening range is customizable in the settings, where you can choose from 5 minute, 15 minute, or 30 minute Opening Ranges.
Many stock tickers tend to follow the Opening Range, and sees continuation after a break of that range. This is a common strategy used by traders to enter trades. Price action also tends to find support and resistance at the 50% and 100% retracement levels, thus providing you Price Targets to start trimming your position, or finding new entries.
Pivot Support/ResistanceThis indicator displays immediate Pivot Highs/Lows compared to the current price as lines on the chart. It can be useful to identify support/resistance.

poopivs [ULTIMATE PIVOT HIGHS AND LOWS]Big thanks to @LudaCode for the missing pivots script. Carried my dumpy trucky badoinkadoink.
This is an elevated pivot script that follows the 3 candle pivot rule (strictly) and does not miss pivots like williams fractals.
Missing pivots marked by transparent circles are derived pivots, giving you a higher resolution for price action.
Colored bars show potential problem areas for pivots (drawing zigzags in particular) and indicate a pivot high and low on the same candle.
Will potentially upgrade this script to include auto zig zags, trend, and intermediate highs and lows finder.
Let me know if you have any suggestions ideas in the comments.
Best,
P

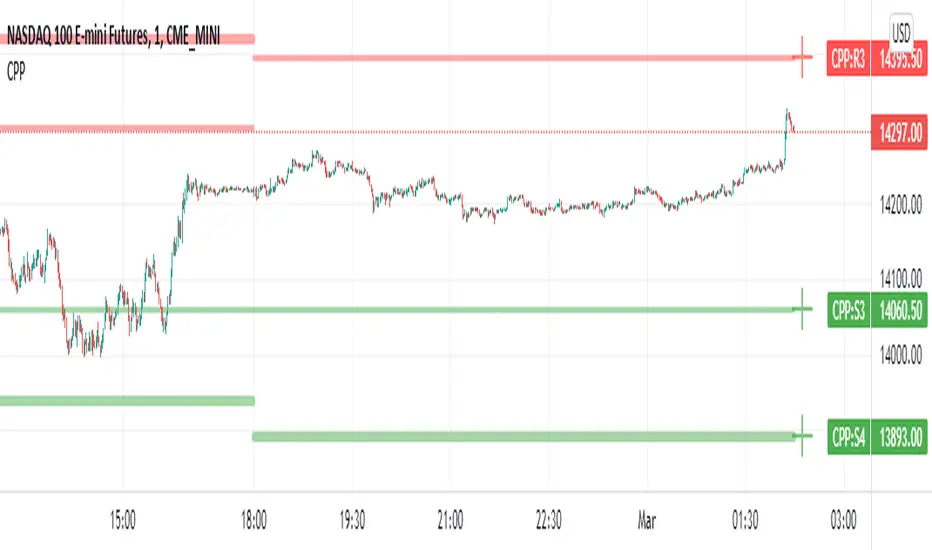
Camarilla Pivot Points L3/4 D/W with Labels AlertsThis version of the camarilla pivot points will provide daily or weekly S3, S4, R3 and R4 Levels.
This release is intended to help you declutter your charts by not having too many lines but still getting the benefit of clearly seeing where the key camarilla levels are, which can help with identifying market structure and potential market extremes.
It has the option to show or hide the lines to help unclutter your charts.
The lines can also be hidden by the user line transparency input, in which case the values will still appear on the scale.
It comes with a cross label for each pivot point that can be offset horizontally by user input. Per the screenshot, the intention is to have these labels adjacent to the right axis to clearly idenfity the pivot levels.
It also has alerts for each pivot point level
Bias Pivot PointA simple indicator that uses Pivot Points as a filter and to generate a Directional Bias .
How to use this indicator?
1. Directional Bias
Bullish => Closing Price > Pivot Point
Bearish => Closing Price < Pivot Point
2. Support / Resistance
Each Pivot Points can be used as Support or Resistance
3. Take Profit Targets
Each Pivot Points can be used as targets for taking profit

Pivot Points High Low & Missed Reversal Levels [LuxAlgo]Pivot Points High/Low, sometimes referred to as "Bar Count Reversals" allows highlighting market prices local tops and bottoms. This method compares the price value at a certain index within a user-specified window length and tests whether it is the highest (pivot high) or lowest (pivot low).
This method can return successive pivots of the same type, thus missing certain reversals, as such, we aimed to highlight those missed reversals and provide a level at their location to determine if they had any significant role to play. A zig-zag is additionally built, connecting regular pivots with missed reversals.
Settings
Pivot Length: Determine the "Bar Count Reversals" window size. higher values will highlight more significant reversals.
Other settings control the look of the displayed graphical elements within the indicator.
Usage
Missed reversals are highlighted by labels with a ghost emoji, a Zig-Zag line connecting a missed reversal is dashed. Note that labels are offset by -Pivot Length bars (with the exception of the most recent one), and as such are detected further ahead of their location.
When a missed reversal is detected, a level is displayed, starting at the location of the missed reversal and ending when a new missed reversal is detected.
These levels can be used as support and resistance.
The most recent label estimates the possible location of a confirmed reversal, and will continuously readjust whether price makes a new higher high/lower low depending on the type of previously detected pivot. A level is also made out of this estimated reversal.

Precise Supply Demand Levels
Concept of Supply and Demand Zones
The concept of supply and demand zones is confusing to some traders. And most tend to believe it's not a concrete concept to be relied upon as they don't exactly know where to draw the lines precisely that best represents the supply and demand zones.
A demand zone is where most traders placing their buy order based on the historical trade analysis; these areas could be found at the lowest low with strong support levels. A demand zone is formed where price is most deviated from it's equilibrium market price in lower direction where most sellers has exhausted their energy along the way and the buyers has regained their energy for a bullish momentum.
A supply zone is where most traders placing their sell orders. These are are often found at the highest high with strong resistance level. A supply zone is formed where price is most deviated from it's equilibrium market price in higher direction where most buyers has exhausted their energy along the way and the sellers has regained their energy for a bearish momentum.
Underlying Algorithm used in the indicator
I am using the of concept of "Frequency Lines" to calculate the areas. Lines with the highest frequency has the most support and resistant strength to cause a reversal on the opposite direction.
Settings and Stylings
Lookback : Default is 50 (The lookback period for calculatibf pivots)
No of Pivots: Default is 3 (The maximum number of pivots to consider, higher will result more boxes)
Aligned: Default is True
Whether to align the supply demand levels or not. If true, it will check the deviation of adjacent supply demand levels, if they are very close it will align themselves vertically to create a single level of support or resistance.
A layout with the levels not aligned
Aligned layout
This levels also will most of the times work as support and resistance levels.
I haven't added any other extra features to make the performance robust. Although I might add in future upon requests.
For now I am keeping it in protected mode, as this is my first indicator script and I am unsure of what to expect from it, but If I get enough of your support and love, I might make the source code public.
Thank you for visiting my page and I hope this helps in your trading journey. If it does truly help, follow me as I will be publishing many more indicators soon.

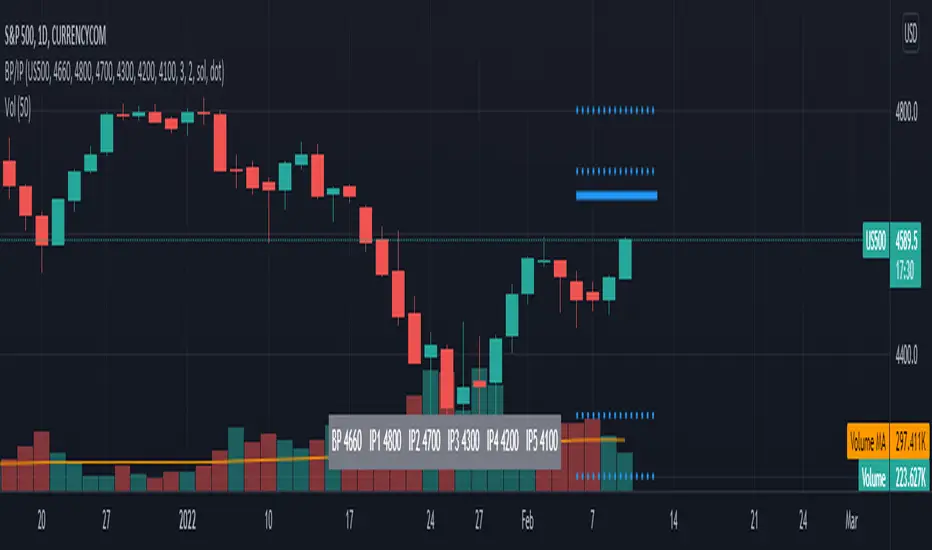
TL BP/IP LevelsScript to ploy Bolded Pivot and Intermediate Pivots based on the TraderLion Daily Plan.
To use the automatic alerts, you need to open the add alert menu and select BP / IP as the Condition and then select the add any alert() function call. Otherwise, you can select and create your own alerts for crossing any of the BP or IP levels. Alerts work best when setting them in the 5 or 15-minute timeframe. If you set them in the daily timeframe then you will not get multiple alerts if they cross over then back under within the day.
Lastly, set your alerts to expire within the trading day. If you set the alerts to last longer than the trading day, then you will get alerts for the wrong levels days after it was set.
Please send me questions and feedback for enhancements.
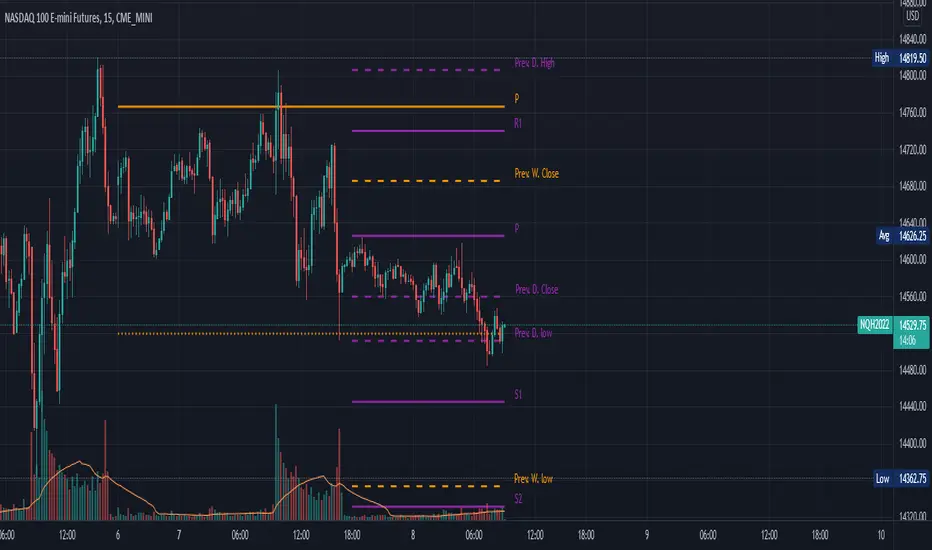
Daily, Weekly, Monthly Pivot Points StandardShow Higher timeframe Pivot Point along with 3 support/Resistance and mid line between them
Option to show the Monthly lines, with or without mid line, and can select the color
Option to show the Weekly lines, with or without mid line, and can select the color
Option to show the Daily lines, with or without mid line, and can select the color
Option to show a tables with the previous Open, High, Low, Close for these higher timeframe
TAPLOT Mini CoilMy entire trading style is built on finding stocks in stage 2 uptrends that are building healthy bases and exhibiting volatility contraction patterns (VCP).
I look for price tightening on the right hand side of the base to find low risk entries.
This Mini Coil indicator is nothing but one way of visualizing tight trading ranges. It essentially plots a box around price areas where price traded inside of one larger bar (candle in my case).
The minimum requirement is for 1 bar to engulf 2 bars that are in-front of it, thus the "Mini Coil" name.
From indicator setting, you can force minimum bars to 3 to reduce coil occurrence on the chart.
Not all Mini Coil price action is tradable. I use this strictly on stocks that are in stage 2 uptrends and potentially getting ready to come out of bases.
If a Mini Coil shows up at the right side of a base, it could potentially be an indication that the stock is ready to break out of that base.
Trigger would be to buy as the price is moving above the high of the wide bar coil area.
Indicator Setting
The indicator is highly customizable with 3 options to display the price coil area
A box - you can customize border and background color as well as transparency
Coil bar paint - Paints the widest bar in the coil area. Paint color for up and down bars is customizable. Default is green/red but you probably want to change that if you are already using green and red bars. I use white and black bars to this works for me.
This options allows you to visually get hints that a coil is forming but without cluttering your charts
Arrow up on coil bar - similar to paint but only puts a signal (arrow up) below the coil bar.
Box Mini Coil Example
Pain Bar Mini Coil Example
Arrow Up Signal Mini Coil Example

World Markets Open/Close BackgroundIndicator fills background color on the chart for different markets around the world.
This can be helpful in some markets to understand after hours and premarket price action. User can study if there is correlation between highs/low in whole session or open/close of different markets.
Tokyo, Hong Kong and Shanghai are Asian Markets in Red are combined
Bombay, London and NYSE are individually plotted.
Times can be changed for each session to include the entire session, or selected block of 15 minutes.
Less than 15 minutes will need to be changed in the default value of the code which is why I'm publishing it open source.
All coded default times for each market are in CST.
Background color can be turned off individually under the Style tab, and can also be unchecked under Inputs and can just be used for source for further coding.
My intentions for this script is to use it and its variable value to plot the highs and lows just in the specific times in a session and to more easily visualize those sessions with color coding.
I hope this is useful
Cheers!

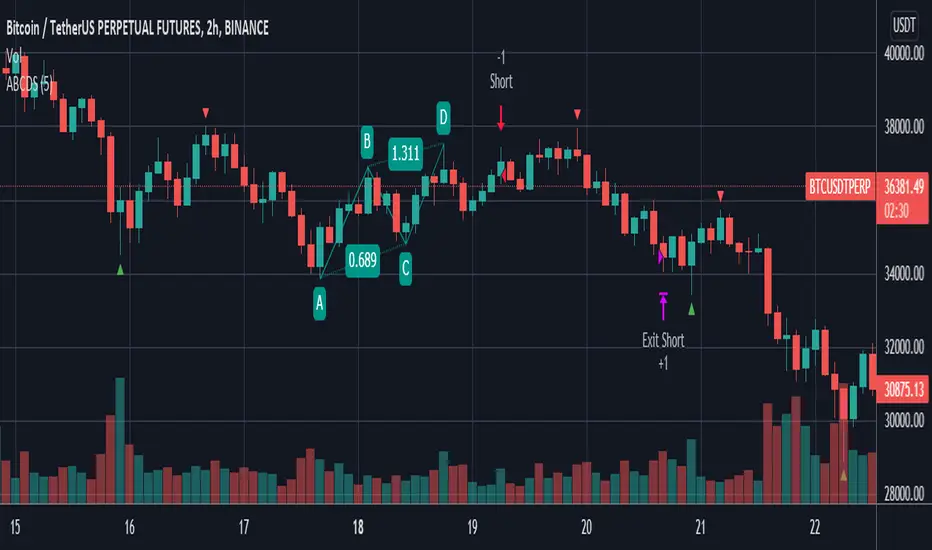
ABCD StrategyOne from many harmonic pattern that consists of two equivalent price legs. The ABCD pattern that helps traders predict when the price is about to change direction.
Tracing And Calculation
This code using pivot high and pivot low built-in method and calculate with Fibonacci Retracement.
Limitation
To find ABCD pattern is very difficult, just coming up a few from thousand candle. That why this code using little bit tolerance ratio to get more pattern.
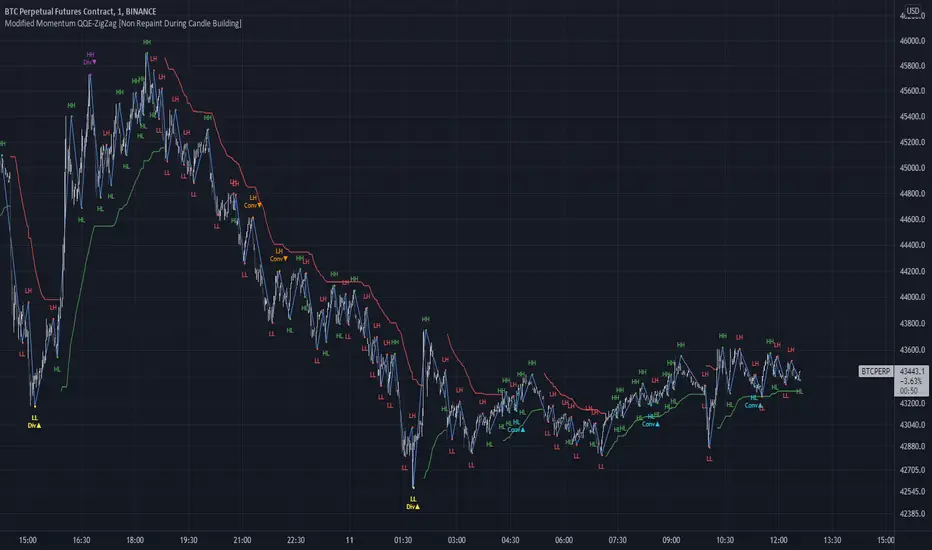
Modified QQE-ZigZag [Non Repaint During Candle Building]V V V V V V V Please Read V V V V V V V
I ask Peter and he is fine, that im published this script
Tell me if you have some ideas or criticism about that sricpt
>>>>>>>>>> This is a modified Version of Peter_O's Momentum Based ZigZag <<<<<<<<<<<
This is only a test, and i want to share it with the community
It works like other ZigZags
Because Peters_O's original Version is only non repaint on closed historical Data ,
during a Candle building process it can still repaint (signal appears / 21 seconds later signal disapears / 42 seconds later signal appears again in the same candle / etc.),
but that isnt important for backtesting, its only important for realtime PivotPoints during a candle.
My goal for this zigzag was to make it absolute non repaint neither during a candle building process (current candle),
so once the signal is shown there is no chance that it disapers and shown a few seconds later again on that same candle, it can only show up one time per candle an thats it,
and that makes it absolute non repaint in all time frames.
Credits to:
==> Thanks to @glaz , for bringing the QQE to Tradingview <3
==> Thanks to @Peter_O , for sharing his idea to use the QQE as base for a Zigzag
and for sharing his MTF RSI with the Community <3
Changes:
- I changed the MTF RSI a little bit, you can choose between two version
- I changed the QQE a little bit, its now using the MTF RSI , and its using High and Low values as Source to make it absolute non repaint during a candle is building
- I added a little Divergence Calculation beween price and the MTF RSI that is used for the ZigZag
Colors :
- Green for HH / HL Continuation
- Red for LL / LH Continuation
- Yellow for Positive Divergence
- Purple for Negative Divergence
Important:
It is not possible to backtest this script correctly with historical Data, its only possible in Realtime,
because the QQE is using crossunders with RSILowSource and the QQE Line to find the Tops and,
because the QQE is using crossovers with RSIHighSource and the QQE Line to find the Bottoms,
and that means it is not possible to find the correct Time/Moment when that crossovers / crossunders happens in historical Data
=============> So please be sure you understand the Calculation and Backtest it in Realtime when you want to use it,
because i didn't published this script for real trading
=============> Im not a financial advisor and youre using this script at your own risk
=============> Please do your own research
IBP_AccDistThis indicator plots distribution / accumulation.
Distribution is when price falls by 0.2% and volume is 1.25 times the 20 day average volume.
Opposite is accumulation.
If there are 5 distibution days in a span of 20 days then market direction is confirmed down.
William O Neils method. Parameters tweaked based on Indian markets and my experience.

TrendLineScalping-BasicDear Traders,
Here is the thought which came to my mind on the trendline break scalping. sometimes during the trade we do plot trendlines and we do anticipate for the line to break and take a trade. with the same thing in mind I had created this basic script to help you and other to create based on the logic used in the script.
This is just a logic based script and doesn't do any kind of wonders. Hence you may use it as necessary.
Regards....

[Herif's] Wolfe WavesWolfe Waves™
This indicator draws wolfe wave patterns.
Some patterns need to be validated by the user.
When detecting Wolfe waves, two triangles are formed.
A target line is drawn from the origin of one of these triangles to the apex or trough of the other.
Bullish patterns are indicated by green triangles and bearish patterns by red triangles. The target line is black.
Care bullish wolfe wave rules
Understanding Wolfe Waves
Wolfe Wave patterns were first identified by Bill Wolfe and his son, Brian. According to Wolfe, they occur naturally in all markets. To recognize them, traders must identify a series of price oscillations that correspond to specific criteria:
-The waves must cycle at a consistent time interval.
-The third and fourth waves must stay within the channel created by the first and second waves.
-The third and fourth waves must show symmetry with the first and second waves.
-In a Wolfe Wave pattern, the fifth wave breaks out of the channel. According to the theory behind the pattern, a line drawn from the point at the beginning of the first wave and passing through the beginning of the fourth wave predicts a target price for the end of the fifth wave. If a trader properly identifies a Wolfe Wave as it forms, the beginning of the fifth wave represents an opportunity to take a long or short position. The target price predicts the end of the wave, and therefore the point at which the trader aims to profit off the position.

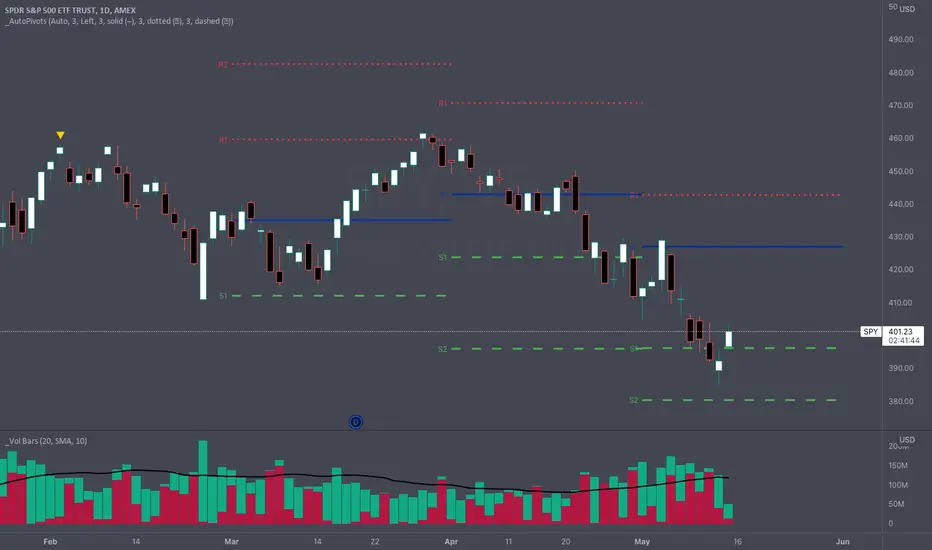
_Auto Pivot PointsOne of the main drawbacks to displaying Pivot Points on a chart is that many times the more extreme pivots (R/S3, R/S4, R/S5) aren't anywhere close to the price action during a timeframe. These extreme pivot points clutter up your chart and make it hard to use the "auto" zoom feature of TradingView.
The " _Auto Pivot Points " indicator solves these problems by automatically only displaying the pivot points if the price has crossed the pivot during the timeframe or it is the next closest pivot . For example, on monthly pivots if the price has only crossed the R1 Pivot then this indicator will display the R2 Pivot and any pivots below but it won't display the R3, R4, R5 pivots . The R3, R4, & R5 pivots are not very useful to the trader because the price hasn't even crossed the R2 Pivot . But as soon as the price crosses the R2 Pivot then this indicator will display the R3 Pivot because it is the next closest. And the same logic applies to the S Pivots .
If you need to see all the Pivots then there is a convenient toggle to display all the pivots by turning off the intelligent auto pivots . But as soon as you don't need to display all the pivots the toggle will turn on the automatic pivots .
This indicator has many style and logic options. This script allows you to control:
Number of past timeframes to display
Displaying Pivot labels
Label position (left/right)
Line color
Line width
Note: TradingView has a limit of 40 security calls per script. Due to this limitation this indicator can only display pivots a max of 7 time periods back.
Note 2: This indicator uses the Traditional pivot calculations.
Swing Pivots High LowBINANCE:BTCUSDT
This indicator is an opensource merge of the built in 'Pivot Points High Low' and the most popular 'Swing-high-low-support-resistance' indicators. The original 'Pivot Points High Low' does not have extensions with better visibility, while the most popular 'Swing-high-low-support-resistance' has no source available. I've also added additional configurable alert conditions for Pivot High and Low Crossover/Crossunder.
Please read the official documentation for further information about the indicator.

HTF Candles & PivotsThis indicator displays HTF candles and pivot points.
The candles are displayed in a box and you can select Open-Close, High-Low or both.
You can show all of the past, or just "today only" or "previous day only".
You can also shift one previous candle to the current one.
The pivot point is the normal one.
There is an option to display CPR (Central pivot range).
Example: Shift previous to current
