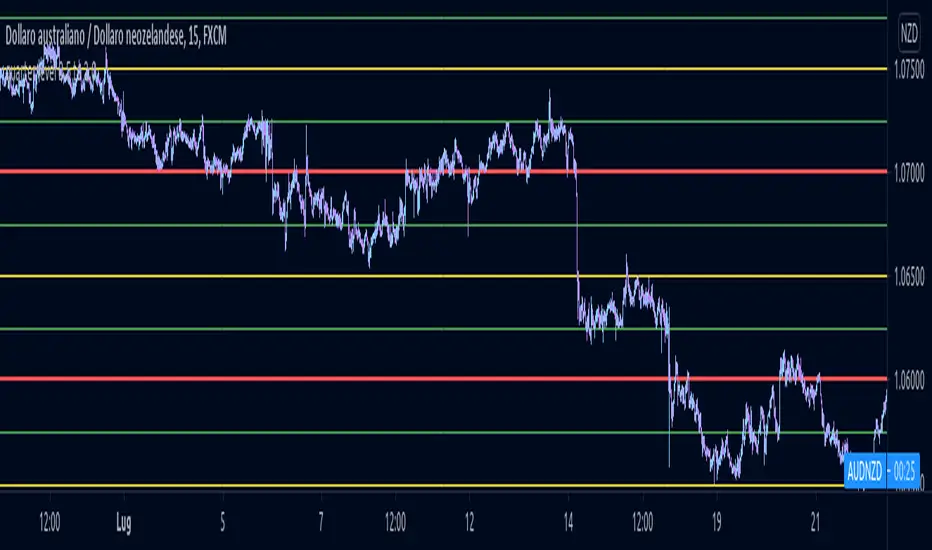
Marked Highs - Support & Resistance [LevelUp]This indicator mimics the functionality of marked highs/lows in MarketSmith, a charting tool available from Investor's Business Daily. Marked highs/lows, sometimes referred to as pivot highs/lows, can be used to locate areas of support and resistance. These same points can also be helpful when drawing trendlines and channels.
I've added several customization options that add to the flexibility and overall usefulness of this technical indicator.
Custom Ranges for Marked Highs/Lows
In MarketSmith, a marked high is the highest high going back nine bars and forward nine bars. The number of required bars with lower highs on each side of the high is referred to as the period. The default for the indicator is a nine bar period, however, you can configure the period to fit with your trading style.
View Marked Highs/Lows on Any Timeframe
MarketSmith only supports marked highs/lows on daily charts. With this indicator you can view marked highs/lows on any timeframe.
Suggestions
■ Draw horizontal rays from the most recent marked high and low to help visualize areas of support and resistance.
■ Create a channel to show the current trading range. Draw a trendline across marked highs and a separate trendline across marked lows.
■ Increase the marked high/low periods to find more significant highs and lows.
Pivot Points

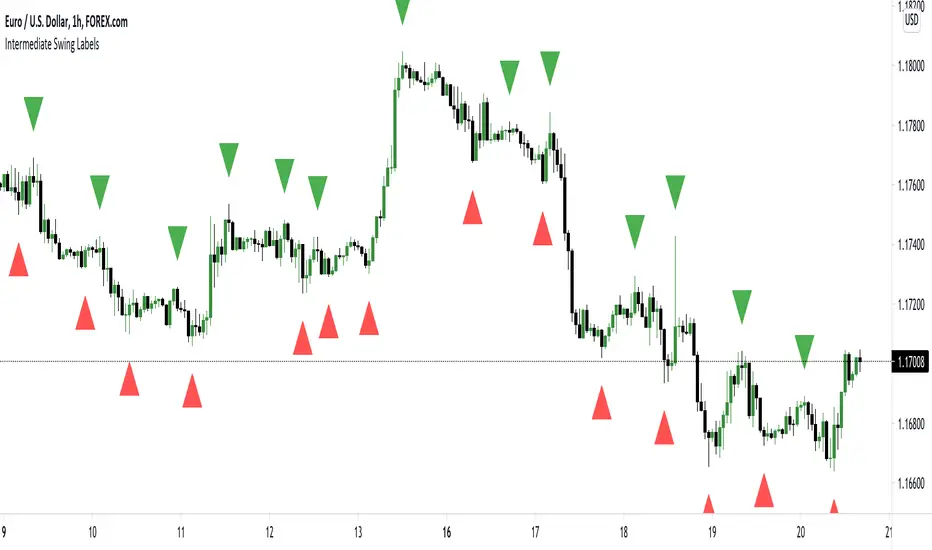
Intermediate Swing LabelsDraws labels above Intermediate Swing Highs, and below Intermediate Swing Lows. Intermediate Swing Highs are highs with swing highs on either side. Intermediate Swing Lows are lows with swing lows on either side.
Pivot Points And Breakout Price Action With LuckyNickVaBar Color Candle Aligned with pivot points swing high and swing lows For Those Who Are Familiar with Trading The Breakouts Of Highs & Lows Of Structure. Pivots are said to be key areas in the market where price shows heavy reaction to where reversals make occur. At these points there are swing Highs & swing lows that traders may be able to find opportunity in the market. This Script is a combination of pivot points and Barcolor signals for the breakout.

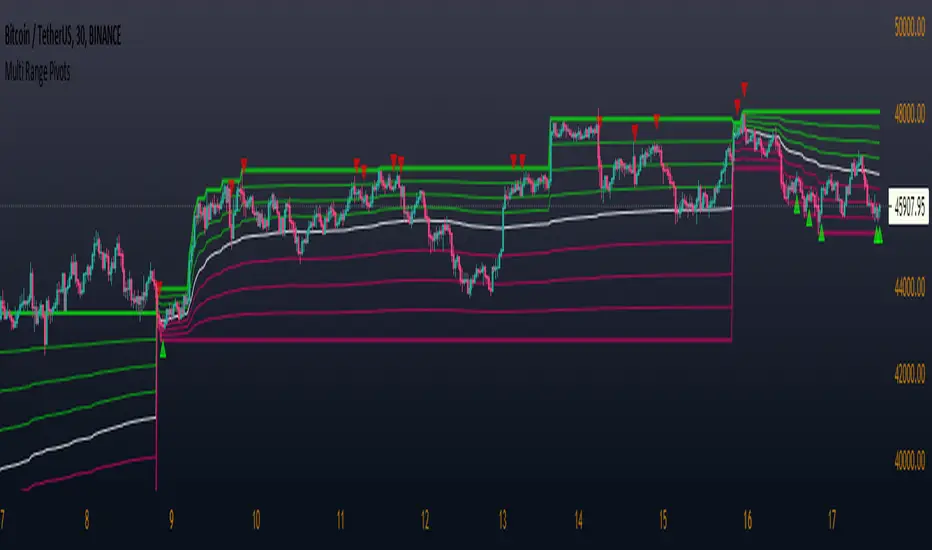
Multi Range Pivots
Multi Range Pivots works by recognizing the high and low of the timeframe selected and plotting range high to MEAN averages and range low to MEAN averages.
This is essentially the VWAP pivots updated to include not only VWAP as a MEAN, but also SMA, EMA, VWMA, DEMA, TEMA, TRIMA, KAMA, MAMA, T3, H/L basis and Donchian basis.
Also, with high and low no longer repainting, I was able to add true reliable signals.
Enjoy
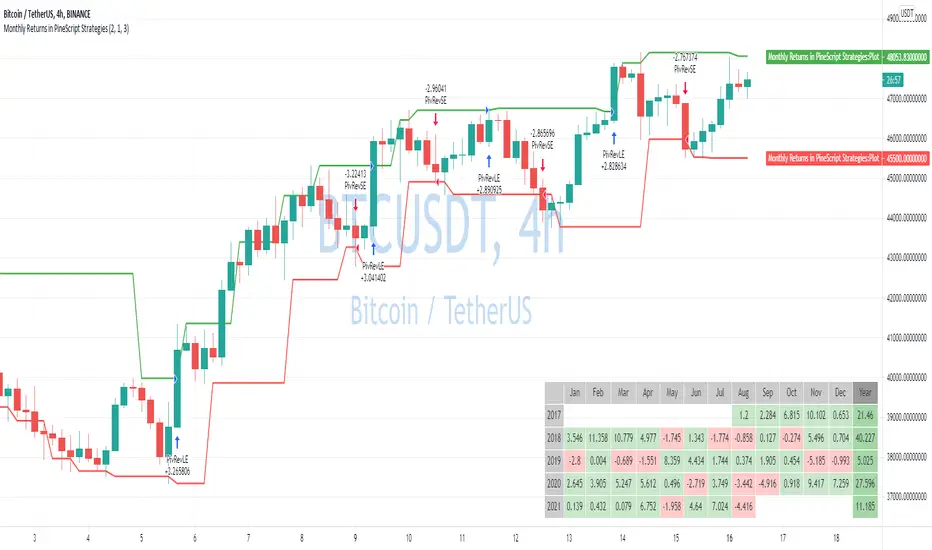
Monthly Returns in PineScript StrategiesI'm not 100% satisfied with the strategy performance output I receive from TradingView. Quite often I want to see something that is not available by default. I usually export raw trades/metrics from TradingView and then do additional analysis manually.
But with tables, you can build additional metrics and tools for your strategies quite easily.
This script will just show a table with monthly/yearly performance of your script. Quite a lot of traders/investors used to look at returns like that. Also, it might help you to identify periods of time when your strategy performed good/bad than expected and try to analyze that better.
The script is very simple and I believe you can easily apply it to your own strategies.
Disclaimer
Please remember that past performance may not be indicative of future results.
Due to various factors, including changing market conditions, the strategy may no longer perform as well as in historical backtesting.
This post and the script don’t provide any financial advice.
Average Zigzag Range (AZR)Here is an attempt calculate Average Zigzag Range (AZR). This can be used similar to ATR. Using AZR instead of ATR for trailing stop calculation may yield better outcome in trend trading.
Logic is simple.
Calculate zigzag based on ZigzagLength
Calculate distance between each zigzag pivots
Calculate simple moving average of last MALength pivots
Use DoubleMA option to further smooth AZR using a Secondary Moving Average

Breakout in 20 daysbreakout condition
1. current close price must be higher than all close prices in 20 days
2. close prices change in 20 days must be less than 20%
3. current volume must be greater than previous volume by 10%
ブレイクアウト条件
1. 最新の終値が直近20日のすべての終値より高い
2. 直近X日の終値の変動率が20%以下
3. 最新の出来高が前日の出来高より10%大きい

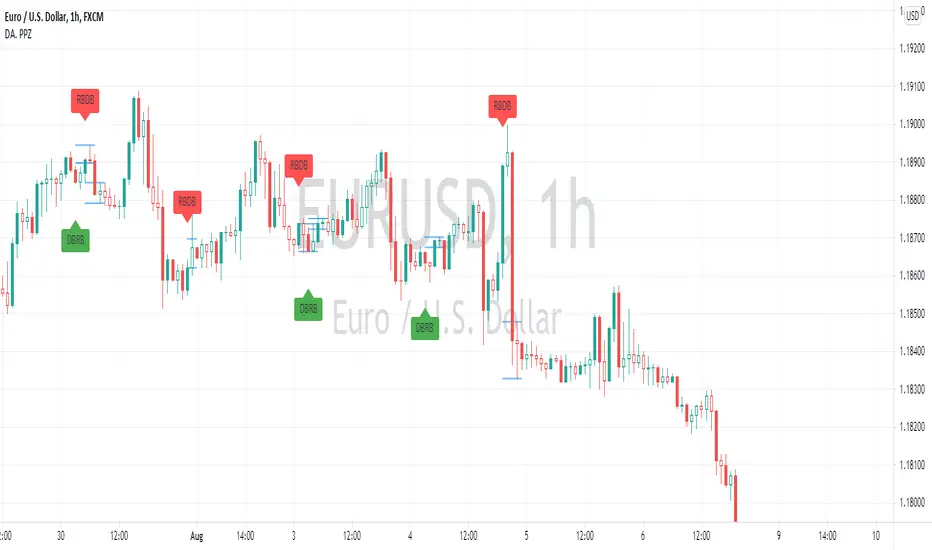
DA. PPZThis is an indicator to mark the Leg in Base Leg out Base zone, for the Picture Perfect Zone. Help us easily find out the zone quickly when we are zoom in the area.
But first we need to identify the Structure, a place where we want find the area, then we use this indicator for zoom in to help us find out the zone.
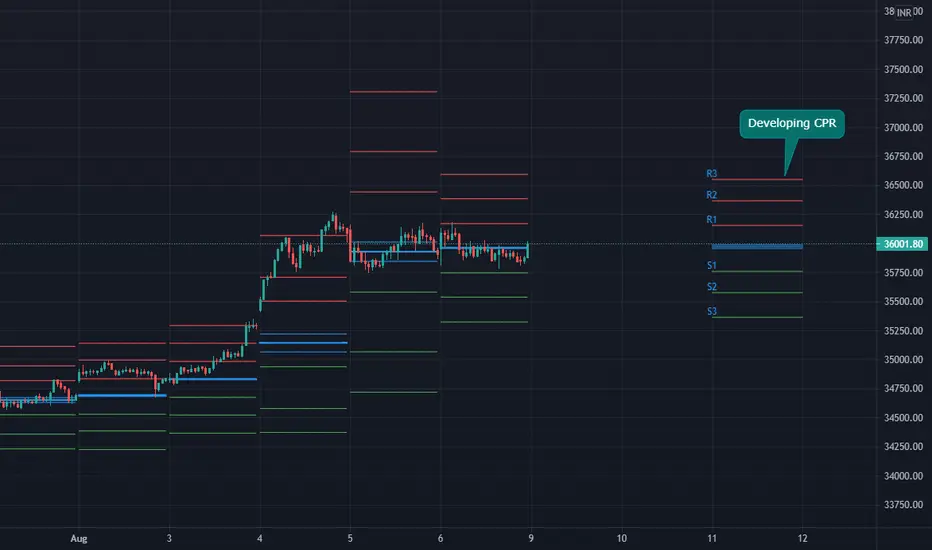
Developing CPR - Day, Week, Month, Year by [GSY]This Scripts shows the developing CPR for the selected timeframe for Daily, Weekly, Monthly or Yearly time frame. One can select the time frame using the well-organized settings.
The weekends and trading holidays for the year 2021 for India market is taken care
This script is very useful in knowing the following:
• Support and resistances for the next day/week/moth/year
• CPR value area relationship for the next session/time frame
• Width of the CPR for the upcoming session/time frame
The above values help in predicting the probability of the market behavior in the coming session.
Script also generates the alters with the values by the end of trading session. The alter need to be configured.
Dynamic Pivot Box for Month and YearThe basic idea of the ‘Dynamic Pivot Box’ is to show only the Pivots that are closer to the Price. This is, the nearest pivots acting as support and resistance; thus hiding all other pivots which are further away from the price and also hiding the pivots from previous periods… Pivots will be hidden until price breaks out from the current box and moves to the next one. Hopefully, with this change you can focus more on the actual price action/ price patterns on the chart rather than on several/ noisy lines on the screen.
**Please note that the recommended use for this indicator is on the daily or higher timeframes if you want to see Year pivots... Monthly pivots can be still seen on the hourly chart, but I am afraid that lower timeframes will not plot the indicator properly.**
The Pivots are taken from Frank Ochoa’s book ‘Secrets of a Pivot Boss’, so if you are not familiar with them, I would recommend you to first take a look at the theory behind them.
The Pivots in this indicator are divided in two groups: ‘Standard pivot’ and ‘Camarilla’ pivots.; and then this latter is group is divided in two also: the ‘Main Camarilla’ and ‘Regular Camarilla pivot’. You can select which groups of pivots are taken into account for the ‘Dynamic Pivot Box’.
If you decide to select all Three Groups: ‘Standard Pivot’, ‘Main Camarilla’ and ‘Regular Camarilla pivot’ you will see ALWAYS 4 pivots surrounding the price. My recommendation is to select only ‘Standard Pivot’ and ‘Main Camarilla’ so that you see only between 2-3 pivots on the screen. This recommended view is actually the default settings.
In addition, if you want to further reduce noise from the chart, you can unselect the ‘Lines’ option within the SETTINGS/ STYLE menu.
What you see on the chart/sample is actually this indicator plotted twice:
1. Year Pivots which have the default settings and are shown as white ines
2. Month Pivots have also the default settings BUT I also selected the option ‘Previous Pivots’ to show the pivots from previous period , and also I unselected the ‘Lines’ options as mentioned above to reduce noise.
You are more than welcome to enhance the current version, my only ask is to please share the enhanced version back with the community. I wish I could make amends or modify the current version myself but I actually just came up with the idea and I paid a coder in Fiverr to develop it.

CPR Strategy - (Call and Put Option Selling)The strategy is designed using CPR and Donchian Channels.
STRATEGY RULES:
We need to wait for "Sell Call" or "Sell Put" arrow on the chart.
Sell call or put on the next candle.
Sell call strike above CPR resistance and candle close above it will be stop loss.
Similarly, sell put strike below CPR support and candle close below it will be stop loss.
This strategy is purely based on theta decay principle.
Hence, always use this strategy on weekly option.
Also, never trade on Monday or Friday to avoid volatility.
Hope you enjoy this strategy and become a professional trader.
Enjoy! :-)
Drop your message below if you have any doubts. Thanks.

Pivot Reversal strategy long onlyPivot Point Reversal Strategy
Pivot point reversal strategy is based on the first support level’s price action during the bullish trend and the first resistance level during the bearish trend . Traders follow the main trend and enter into the trade after reversal analyzing pivot point levels.
This version is an upgraded version, combining the initial pivot point reversal strategy together with one of the most accuracy moving average in my opinion for day trade, the Least square moving average.
At the same time I applied an option to backtest using a date range and a leverage calculator.
The default options are optimized for BTC /USDT 2H charts, using 0.1% comission fee.
If you have any questions, let me know

ATR Mark Up/DownThis script looks for a period with increased volatility, as measured by ATR (Average True Range), then it looks for a high or a low in that area.
When price is above EMA (200 is default, can be changed), it looks for the highs and adds multiples of ATR to the high. Default values for multipliers are 3,9 and 27, meaning that the script will show 3xATR level above the high, 9xATR above the high and 27xATR above the high.
When price is below EMA it looks for the lows and subtracts multiples of ATR from the low.The script will show 3xATR level below the low, 9xATR below the low and 27xATR below the low.
Multipliers values can be changed as well, making it a versatile tool that shows potential levels of suppport/resistance based on the volatility.
Possible use cases:
Breakout trading, when price crosses a certain level, it may show potential profit targets for trades opened at a breakout.
Stoploss helper. Many traders use ATR for their stoplosses, 1 ATR below the swing low for long trades and 1 ATR above the swing high for short trades are common values used by many traders. In this case, the Lookback value comes handy, if we want to look maybe at a more recent value for swing high/low point.
The levels shown by this indicator are not guaranteed to be or not to be reached by price, these levels should be used in confluence with other indicators and looked at as a visual helper.
That's all, hope you enjoy it!
PS.
*It does not plot the ATR. I don't know how to do it and IF it can be done
** It does not plot the EMA. If necessary,it can be added in a future update
Pivot and liquidation lines [LM]Hello traders,
I would like to introduce you pivot and liquidation zones. Levels are rendered based on pivot points. We are looking for confluence of liquidation lines in order to have the gist where the market could go. calculation for the liquidation lines are taken from Bybit. It's good to look for line clusters. Indicator doesn't tell you where the market will go but it tells you where are the potential zones of position liquidations
There are several settings:
pivot setting - ordinary pivot lines setting
first leverage - setting for first leverage
second leverage - setting for second leverage
third leverage - setting for first leverage
fourth leverage - setting for second leverage
Hope you will enjoy it.

Multi ZigZag EW - Impulse V2Another version of Elliot Wave 3 projection. This time with more features.
I have based the calculations based on Wave 1,2 and 3 relation mentioned in www.esignal.com
Ratios for Wave 2
Wave 2 = either 50% of Wave 1 or 62% of Wave 1
Wave 3 is related to Wave 1 by one of the following:
Wave 3 = either 1.62 x length of Wave 1 or 2.62 x length of Wave 1 or 4.25 x length of Wave 1
Logic and calculations are similar to that of previous version:
But, effort has been made to add some additional infomation and tools into this script.
Similar to the previous script, upto 4 zigzag lengths can be selected from input. Users can also set, color, line style and width for each Zigzag lines. Error threshold defines how much vairation from fib ratios are allowed before recognizing patterns. EntryPercent is minimal bounce off required from Wave 2 to get into the trade. This will also determine initial Stoploss.
Now lets have look at fun features.
In Trade Stats Table
By default, you can find this in bottom right corner of the screen. This table shows details of trades which are running at the moment based on different patterns formed. Trade will be running till it hits target 4 or trailing stop loss. Multiple zigzags can generate multiple trades at a time, stats containing Wave Points 0 to 3 and other information will be printed in the table.
Closed Trades Stats Table
This is by default found in bottom left corner of the screen. This table consists of stats related to all the closed trades. It shows how many trades are generated, how many failed to hit Entry point, how many hit Entry and then reversed to hit stoploss. How many entered trades hit different stop levels etc.
Unique Coordinates: Sometimes different zigzags produce same waves - Point (1) (2) abd (3). Enabling unique coordinates will filter these and generate only one trade altogether.
AtrLength and AtrMult are used for calculation of trailing stop loss. Trailing stop loss activation can be controlled by the parameter TrailingStart - which lets you select upon reaching what state the trailing stop needs to be activated. Even if trailing stop is not activated, stops will still trail by two levels. For example, when price hits Target 3, stoploss is automatically moved to Target 1 which is below two levels.
In the chart, the remaining Target levels and Current stop levels are highlighted with bigger font and solid lines whereas the inactive ones will have dotted lines and smaller font. For example, Entry label and line will show up in bigger font till price crosses entry. Once this is done, Entry point is not significant anymore. Hence, they are diminished. Similarly target levels will diminish as and when they are reached.
Last parameter is Direction - this lets you select what direction you want to generate the signals. By default it is set to all. But, users can select only bullish or bearish signals.

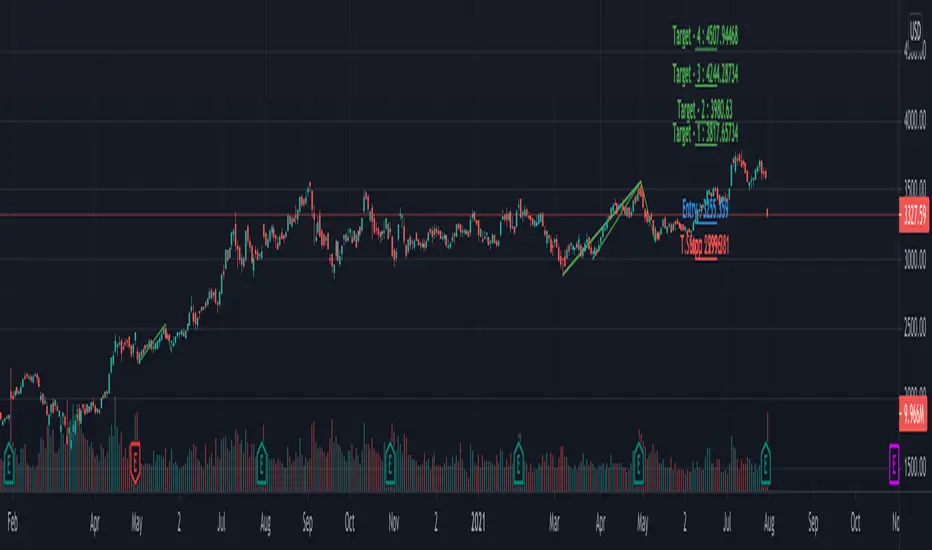
Multi ZigZag EW - ImpulseSimilar to the previous script on Elliot Wave Impulse:
But, here we are trying to use multiple zigzags instead of just one.
You can select upto 4 different Zigzags and set different length, line color, line width and style for each. Parameters ShowZigZag , ZigZag Length, ZigZag Color, ZigZag Width, ZigZag Style can be used for adjusting these.
ErrorPercent lets you set error threshold calculation of ratios for pattern identification
EntryPercent is used for marking Entry and T.Stop (Tight Stoploss) based on the length of Wave 2.
Target of the script is same as before. We are trying to identify Wave 1 and 2 of Elliot Impulese Wave and then project Wave 3. Chances of price following the pattern are there. Hence, we set Stoploss based on levels which fails the pattern.
Ratios are taken from below link: elliottwave-forecast.com - Section 3.1 Impulse
Wave 2 is 50%, 61.8%, 76.4%, or 85.4% of wave 1 - used for identifying the pattern.
Wave 3 is 161.8%, 200%, 261.8%, or 323.6% of wave 1-2 - used for setting the targets
Since we use multiple zigzags, labels can be quite messy at times. In such scenarios, just disable one of the zigzag length causing label overlaps.
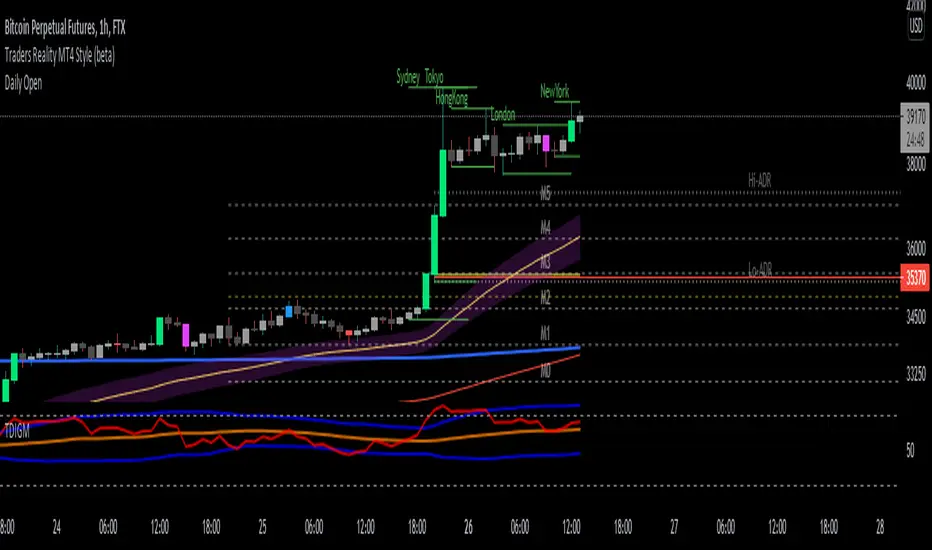
Daily Open Horizontal LineThis script draws a horizontal line that starts in the daily open (00:00 UTC)
Basically I did this since lots of times price come back down/up to the daily open and then bounces, meaning we can take trades based on this.
Hope you enjoy it.
PD: Took the code from infernix, all the credits to him, I know shit about coding.
Infernix TDV Profile: tradingview.com/u/infernixx
Pivot High/Low Analysis & Forecast [LuxAlgo]Returns pivot points high/low alongside the percentage change between one pivot and the previous one (Δ%) and the distance between the same type of pivots in bars (Δt). The trailing mean for each of these metrics is returned on a dashboard on the chart. The indicator also returns an estimate of the future time position of the pivot points.
This indicator by its very nature is not real-time and is meant for descriptive analysis alongside other components of the script. This is normal behavior for scripts detecting pivots as a part of a system and it is important you are aware the pivot labels are not designed to be traded in real-time themselves
🔶 USAGE
The indicator can provide information helping the user to infer the position of future pivot points. This information is directly used in the indicator to provide such forecasting. Note that each metric is calculated relative to the same type of pivot points.
It is also common for analysts to use pivot points for the construction of various figures, getting the percentage change and distance for each pivot point can allow them to eventually filter out points of non-interest.
🔹 Forecast
We use the trailing mean of the distance between respective pivots to estimate the time position of future pivot points, this can be useful to estimate the location of future tops/bottoms. The time position of the forecasted pivot is given by a vertical dashed line on the chart.
We can see a successful application of this method below:
Above we see the forecasted pivots for BTCUSD15. The forecast of interest being the pivot high. We highlight the forecast position with a blue dotted line for reference.
After some time we obtain a new pivot high with a new forecast. However, we can see that the time location of this new pivot high matches perfectly with the prior forecast.
The position in time for the forecast is given by:
x1_ph + E
x1_pl + E
where x1_ph denotes the position in time of the most recent pivot high. x1_pl denotes the position in time of the most recent pivot low and E the average distance between respective pivot points.
🔶 SETTINGS
Length: Window size for the detection of pivot points.
Show Forecasted Pivots: Display forecast of future pivot points.
🔹 Dashboard
Dashboard Location: Location of the dashboard on the chart
Dashboard Size: Size of the dashboard on the chart
Text/Frame Color: Determines the color of the frame grid as well as the text color

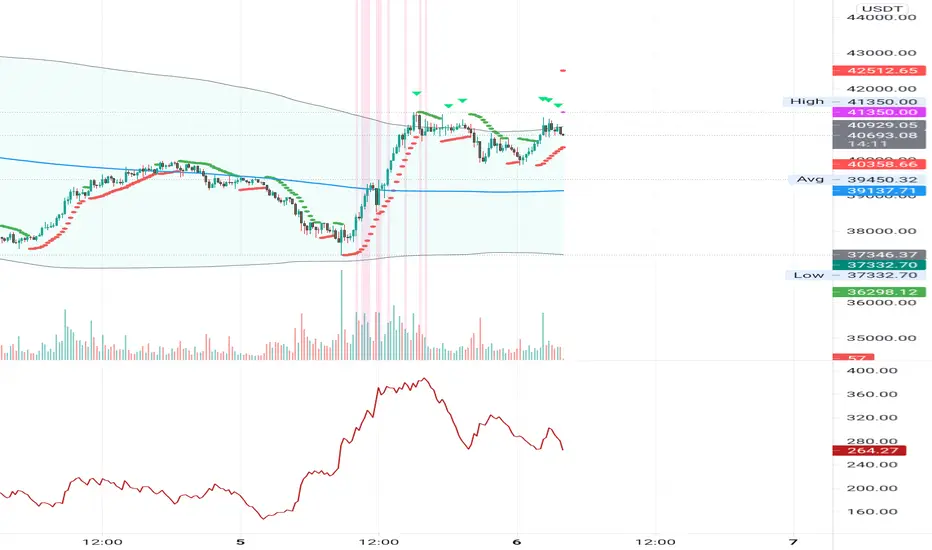
Multi Range VWAP PivotsMulti Range VWAP Pivots turned out to be one of my most accurate pivot indicators to date!
Multi Range VWAP Pivots works by recognizing the high and low of the timeframe selected (D, W, M, 6M, and 12M) and plotting range high to VWAP averages and range low to VWAP averages.
After further examination of each completed range, I came to the conclusion that due to the nature of averages, high and low respectively would need to be completed within the current range, for the averages to actually display pivots correctly. This means that if all averages appear to be "pivoting" correctly after or during a break lower of higher, then we can only assume the most recent break higher or lower could be exhaustion and price will be reverted to the mean (VWAP). OR, this could be the most accurate hindsight indicator on the planet.
*DISCLAIMER*: This indicator repaints. DO NOT backtest or set alerts with this indicator.

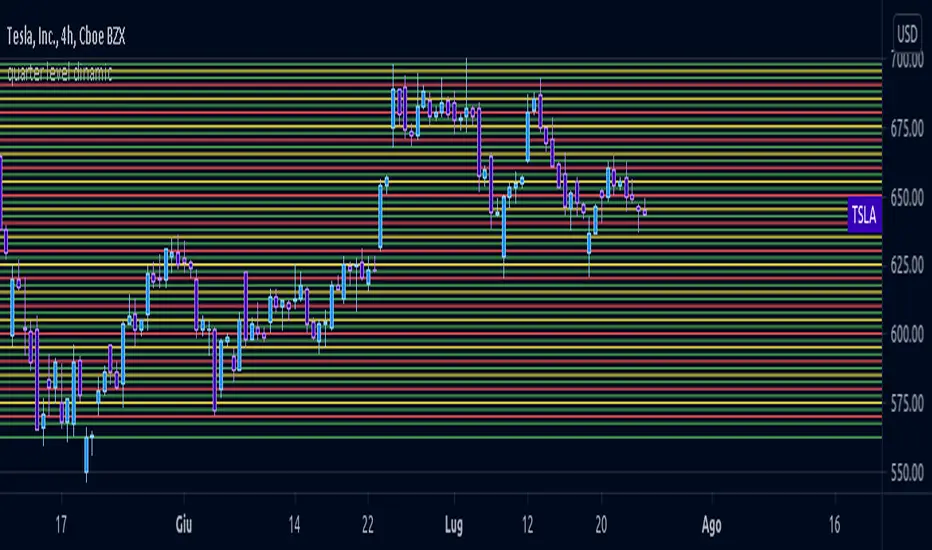
quarter level dinamicLimited quarter level script but more flexible in compared to my FX script, same logic behind
Multi ZigZagI created this as basis for my next scripts. We are just trying to plot multiple zigzags with different length basis here. Input allows you to select different Length , Width , Color and Line Style for each Zigzags.
Max_pivot_size says how many pivots each Zigzag can have. Value 100 means, each zigzag will show 99 lines joining 100 points.
Additional option ShowStatsTable allows you to print pivots in a table. Table only shows selected zigzags.

High/Low Anchored VWAPHigh/Low Anchored VWAP simply plots an Anchored VWAP at High and Low, within a set range (D,W,M) , with a central "Basis" plot of the High and Low anchored VWAPs
*DISCLAMER* This indicator repaints. DO NOT set alerts or backtest using this indicator.

quarter level 0.5 to 2.0This script could help to see edged level for a reverse on forex, not for yen pairs and is based on quarter and round number theory.
I suggest to use it on H4 timeframe or lower to have a confermation on support or resistance level.