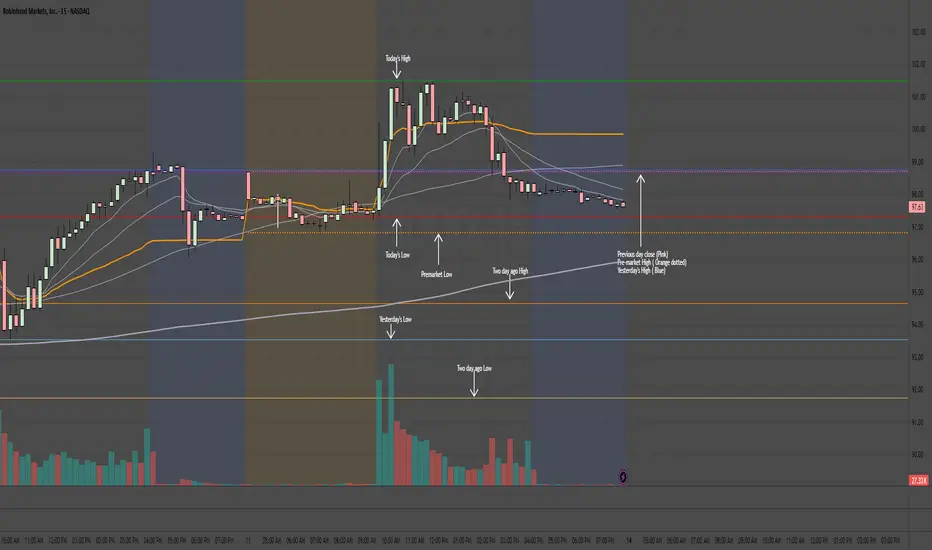
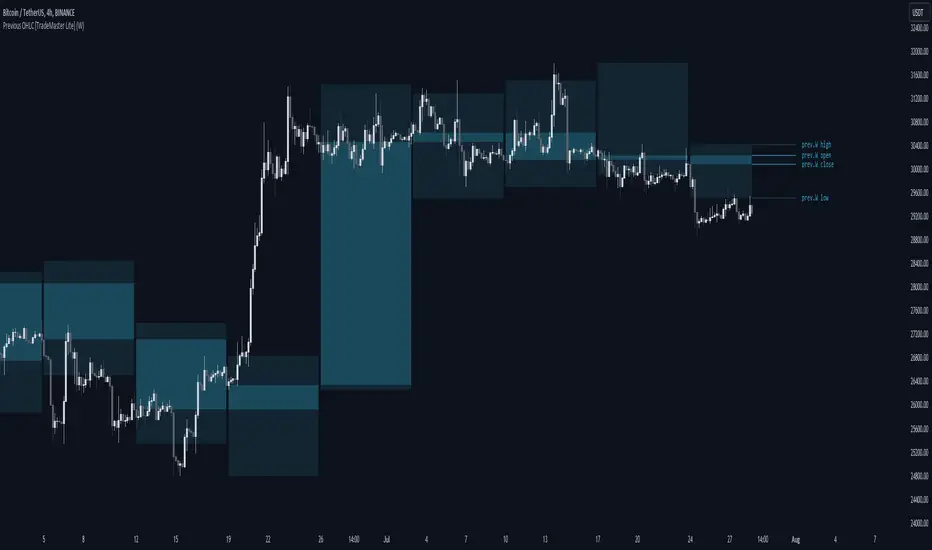
Previous Levels - CA23📌 Indicator: Previous Levels – CA23
Description:
“Previous Levels – CA23” is a powerful multi-timeframe utility tool designed to automatically plot the Open, High, Low, and Close (OHLC) levels from up to 6 higher timeframes (HTFs) directly onto your chart. These levels serve as key reference points for support, resistance, liquidity grabs, or institutional price reactions, helping you spot high-probability areas for entries, exits, and trade management.
Whether you’re a scalper on the 1-minute chart or a swing trader using daily or weekly levels, this indicator provides precise historical price levels with full customization options.
⸻
⚙️ Features:
• ✅ Plot OHLC levels from up to 6 different HTFs (e.g., 15m, 1H, 4H, Daily, Weekly, Monthly).
• ✅ Display customizable labels for each level (e.g., “Previous”, “OHLC”, “Price”, “Date/Time”, or custom symbols).
• ✅ Trace historical extensions of each level to the left (ghost line) for improved backtesting and structure analysis.
• ✅ Fade colors of levels far from current price using an ATR proximity filter, for better visual focus.
• ✅ Works across all markets: futures, crypto, forex, stocks.
⸻
🧩 Customization Options:
🔹 HTF Levels:
For each HTF (1–6), you can:
• Enable or disable the level
• Set the timeframe (e.g., 15m, 1H, 4H, Daily…)
• Limit how many previous bars to display
• Choose which OHLC values to show: Open, High, Low, Close
• Customize color, line style (solid, dashed, dotted), and line thickness
• Show a vertical start marker for each level
• Enable trace-back lines to show level history
🔹 Labeling System:
• Toggle labels on/off
• Choose text color, background color, and label size
• Build labels using up to 9 elements:
• Interval, OHLC type, “Previous”, Price, Date, Symbols (like • or ◆), etc.
• Full flexibility to format the text shown next to each level
🔹 Layout & Display:
• Offset levels forward/backward in time to declutter chart
• Control vertical spacing between stacked HTF levels
• Hide levels on higher timeframes if needed
🔹 Advanced:
• Fade out levels if price is too far (based on ATR × factor)
• Select fade transparency percentage and ATR length
⸻
🧠 Use Cases:
• Identify institutional levels like daily/weekly highs/lows
• Backtest reactions to previous highs/lows
• Detect liquidity zones or breaker blocks
• Combine with ICT, SMC, or supply/demand strategies
• Confluence with killzones and session ranges
⸻
📎 Notes:
• Optimized for performance and clean chart display
• Compatible with both light and dark modes
• Maximum customization for experienced traders
• Created by ca23
Previoushigh
Today, Previous Day, and Two Days Ago LevelsOverview
This indicator plots key price levels from the current trading day, the previous day, and two days ago directly on your chart. Designed for traders who rely on daily price action, it displays the high, low, and close of the previous day, as well as the high and low of two days ago, alongside the developing high and low of the current day. Each level is drawn as a horizontal line with customizable visibility and distinct colors for easy identification.
Features
Today’s Levels: Shows the current day’s high (green) and low (red) as they develop during the regular trading session (9:30 AM–4:00 PM EDT).
Previous Day Levels: Plots the high (blue), low (light blue), and close (purple) of the most recent completed trading day, updating after 4:00 PM EDT.
Two Days Ago Levels: Displays the high (orange) and low (light orange) from two trading days prior.
Customizable Display: Toggle each level on or off via input settings to focus on the data that matters to you.
Session-Based Accuracy: Uses the regular U.S. equity session (9:30 AM–4:00 PM EDT) to ensure levels reflect standard trading hours.
How It Works
The indicator fetches daily price data based on the regular trading session (9:30 AM–4:00 PM EDT, Monday–Friday). After the session closes at 4:00 PM EDT, the "Previous Day" levels shift to reflect the just-completed day’s high, low, and close, while "Two Days Ago" levels update to the day before that. This makes it ideal for pre-market analysis the next morning, ensuring you’re always working with the latest completed session data.
Usage
Intraday Trading: Use on 1-minute, 5-minute, or 15-minute charts to monitor key levels during the day or in pre-market.
Daily Analysis: View on daily charts to assess historical levels, with updates reflecting the latest session after 4:00 PM EDT.
Support/Resistance: Leverage these levels as potential support and resistance zones for your trading strategy.
Limitations
Timeframe Consistency: Works best on intraday charts (e.g., 1-min, 5-min, 15-min, 30-min, 60-min). On higher timeframes (e.g. daily , weekly, monthly), the levels may not align as expected due to the daily session focus.
Securities Traded: Optimized for U.S. equities with a 9:30 AM–4:00 PM EDT session (e.g., stocks like SPY, AAPL). May not work correctly for:
Futures or Forex: These markets have different session hours (e.g., 5:00 PM EDT close for some futures), which could misalign the levels.
Non-U.S. Markets: Securities with different trading hours (e.g., European or Asian exchanges) won’t match the hardcoded EDT session.
Time Zone Dependency: Assumes a UTC-4 (EDT) timezone. If your chart or TradingView settings use a different timezone (e.g., EST, UTC), the session close detection (4:00 PM EDT) may be off.
Extended Hours: Excludes pre-market and after-hours data, focusing only on regular session prices. If you need extended hours, this indicator won’t reflect those levels.
Notes
Published under the Mozilla Public License 2.0.
Created on November 20, 2024, with updates for accuracy as of March 27, 2025.
If you encounter issues (e.g., levels not updating correctly), check your symbol’s session hours and chart timezone match the U.S. equity standard (9:30 AM–4:00 PM EDT).
Enjoy trading with clearer daily levels!
PDH & PDL Indicator: Previous Day's High/Low with AlertsThe PDH & PDL Indicator plots the Previous Day's High (PDH) and Previous Day's Low (PDL) directly on the chart, providing a clear visual reference for key price levels. These levels are often used by traders to identify potential breakout or breakdown zones and to gauge market strength or weakness.
Features:
PDH (Green Line) : Represents the high of the previous trading day.
PDL (Red Line): Represents the low of the previous trading day.
Alerts:
Get notified when the price crosses above PDH or below PDL.
Custom alert messages to keep you informed in real-time.
Use Cases:
Identify key breakout and breakdown points for potential trade entries or exits.
Confirm the strength of a trend by monitoring price action relative to PDH and PDL.
Useful for intraday, swing, and positional traders who rely on historical price levels for strategy development.
Previous OHLC Levels [TradeMaster Lite]In trading, the “Previous Open/High/Low/Close” (or previous OHLC) refers to the opening, high, low and closing price of the instrument in the previous period. These prices are typically used in technical analysis to identify trends and patterns and to make trading decisions. Some traders may also use the differences between the opening, high, low and closing prices to make trading decisions. For example, the difference between the closing and opening price (the so-called “true body”) and the high and low price (the so-called “upper shadow” and “lower shadow”) can indicate the strength of a trend, whether the bulls or bears are controlling the market, and can also give an idea of market volatility, and are also used as support and resistance levels.
Previous Open: shows the opening price of the previous period. It's the price at which the market first started trading in that period.
Previous High: represents the highest price reached during the previous period. It can act as a resistance level for the current period.
Previous Low: indicates the lowest price hit during the previous period. It can serve as a support level in the current period.
Previous Close: the last price at which the asset traded during the previous period. It's often considered the most accurate reflection of the market sentiment at the end of that period.
These values provide a summary of the previous trading period's price action, giving you a baseline for comparing current price movements. They can help in understanding the market's direction and identifying potential support and resistance levels. It is important to keep in mind that, like any other technical indicator, Previous OHLC does not give a definitive indication of future market direction and should be used in conjunction with other analytical tools, as well as fundamental analysis and market sentiment. It is also important to have appropriate risk management in place.
👉 General advice
Confirming Signals with other indicators:
As with all technical indicators, it is important to confirm potential signals with other analytical tools, such as support and resistance levels, as well as indicators like RSI, MACD, and volume. This helps increase the probability of a successful trade.
Use proper risk management:
When using this or any other indicator, it is crucial to have proper risk management in place. Consider implementing stop-loss levels and thoughtful position sizing.
Combining with other technical indicators:
The indicator can be effectively used alongside other technical indicators to create a comprehensive trading strategy and provide additional confirmation.
Keep in Mind:
Thorough research and backtesting are essential before making any trading decisions. Furthermore, it's crucial to have a solid understanding of the indicator and its behavior. Additionally, incorporating fundamental analysis and considering market sentiment can be vital factors to take into account in your trading approach.
Limitations:
This is a lagging indicator. Please note that the displayed values are delayed by the chosen timeframe on historical bars and show the values from the previous period on the current bar.
The indicators within the TradeMaster Lite package aim for simplicity and efficiency, while retaining their original purpose and value. Some settings, functions or visuals may be simpler than expected.
⭐ Conclusion
We hold the view that the true path to success is the synergy between the trader and the tool, contrary to the common belief that the tool itself is the sole determinant of profitability. The actual scenario is more nuanced than such an oversimplification. Our aim is to offer useful features that meet the needs of the 21st century and that we actually use.
🛑 Risk Notice:
Everything provided by trademasterindicator – from scripts, tools, and articles to educational materials – is intended solely for educational and informational purposes. Past performance does not assure future returns.
Lowest / Highest From WidgetRecent events inspired me to create a small widget that allows you to spot from when current value is lowest / highest.
Just add it to chart and script will compute most recent day when price was higher / lower than current and it will display:
Line coming from that value to the current one
A table with previous low/high information
Thanks to @MUQWISHI to help me coding it.
Disclaimer
Please remember that past performance may not be indicative of future results.
Due to various factors, including changing market conditions, the strategy may no longer perform as well as in historical backtesting.
This post and the script don’t provide any financial advice.