Candles Colored Green/Red According To Buy & Sell PressureCANDLES COLORED GREEN OR RED ACCORDING TO BUY & SELL PRESSURE
This indicator paints each candle green, red or blue depending on whether the buy/sell pressure for that candle is bullish, bearish or neutral.
***TURN OFF NORMAL CANDLE COLORS***
For this script to show properly on the chart, make sure you go to chart settings(gear icon in top right corner) and in the symbol tab, uncheck body, borders and wick.
***HOW TO USE***
When the directional movement index indicator shows more buying pressure than selling pressure, the candle will appear lime green. This indicates bullish buying pressure.
When the directional movement index indicator shows more selling pressure than buying pressure, the candle will appear red. This indicates bearish selling pressure.
When the directional movement index indicator shows the same amount of buy and sell pressure, the candle will appear blue. This indicates neutral buy/sell pressure.
Use the color changes to see if there is more buying or selling to pinpoint reversals and understand current market buying. Wait to enter or exit positions until the candles turn the opposite color.
***MARKETS***
This indicator can be used as a signal on all markets, including stocks, crypto, futures and forex.
***TIMEFRAMES***
This DMI color coded candlestick indicator can be used on all timeframes.
***TIPS***
Try using numerous indicators of ours on your chart so you can instantly see the bullish or bearish trend of multiple indicators in real time without having to analyze the data. Some of our favorites are our Auto Fibonacci, Directional Movement Index, Color Coded Buy & Sell Pressure Volume Profile, Auto Support And Resistance and Money Flow Index in combination with this Buy & Sell pressure Candle indicator.
Search in scripts for "Candlestick"

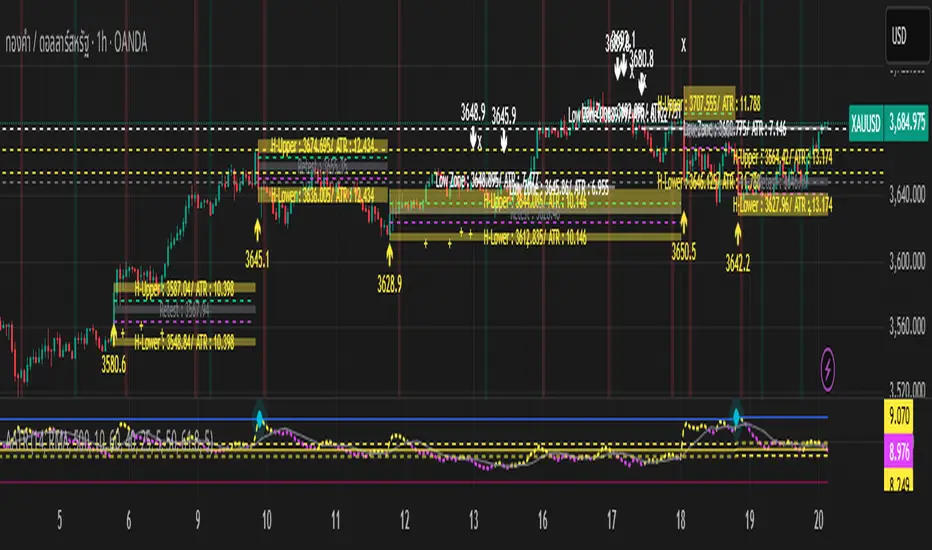
Adaptive Average True RangeOANDA:XAUUSD OANDA:XAUUSD This indicator is based on the hypothesis that a candlestick exhibiting unusual movement, exceeding the maximum value of the Average True Range (ATR), signifies abnormally strong buying or selling pressure. These particular candlesticks are often followed by a retest. We can use Fibonacci levels to help measure the extent of these retests by drawing a box from the upper to the lower wick of the candlestick. The central box defaults to the 0.5 - 0.618 Fibonacci retracement levels, with dashed lines at the 0.382 and 0.732 levels.
The retest of the candlestick can be categorized into two patterns: a strong trend or a sideways market.
In the case of a strong trend, whether it is a downtrend or an uptrend, the retest often only reaches the box drawn on the wicks. However, sometimes it may only retest the 0.382 level for a downtrend or the 0.732 level for an uptrend. Infrequently, if the asset has sufficient volatility, the price may retest the box on the opposite side of the trend.
In the case of a market entering a sideways phase, whether it's a sideways down or sideways up, the price will typically retest the central box before determining its next direction.
This indicator also measures the standard deviation of the ATR to determine the maximum and minimum price movement, based on another hypothesis regarding "time for a move or time for a slow down," which is plotted as a background color.
Please use this indicator with caution, as it is based solely on a hypothesis.
MTFT Full Time Frame Continuity Table TheStrat Suite(2of5)Multi Time Frame Tools
Multi Time Frame Tools (MTFT) is a suite of scripts aimed to establish a standard timeframe-based color scheme. This can be utilized to overlay different timeframes calculations/values over a single timeframe. As one example, this would allow to observe the 5-month moving average, 5-week moving average, and 5-day moving average overlaid over each other. This would allow to study a chart, get accustomed to the color scheme and study all these at the same time much easier.
All indicators calculated using the below specific timeframes as input, will always use the color scheme outlined below. This is to get you in habit of recognizing the different timeframes overlaid in top of each other. These can be personalized.
Longer TF analysis.
Yearly - Black
Semi-Annual - Yellow
Quarterly - White
Monthly - Maroon
Weekly - Royal Blue
Daily - Lime
Shorter TF analysis.
4 hour - Fuchsia
1 hour - Orange
30 min - Red
15 min - Brown
10 min - Purple
5 min - Lilac
All color coordination is able to be modified in either the “Inputs” or “Style” section. If you need to make changes, make sure to select “Save as Default” on the bottom right of the settings menu.
Recommended Chart Color Layout
I played around with color coordination a lot. The final product was what worked best for me. I personally use the following chart settings to accent all available TF colors.
-> Click on the settings wheel on your chart. -> Click on “Appearance”.
Background - Solid -> On the top row pick the 6th color from the left.
Vert Grid Lines and Horz Grid Lines -> On the top row pick the 7th color from the left.
You may of course change these and the indicator line colors as you like.
Adding indicator to Chart
-> Open the TradingView “Indicators & Strategies” library, the icon has “ƒx”. -> All premium scripts will be located under “Invite-Only Scripts” -> Click indicator to add to your chart.
MTFT TheStrat Suite (5 Scripts)
Rob Smith is the creator of ‘TheStrat’ trading strategy. For ‘TheStrat’ I have put together a suite of 5 premium scripts that combined will offer people interested in learning ‘TheStrat’ a cleaner learning process. For 2 of the 5 scripts specifically, the MTFT approach of overlaying multiple longer timeframes(TF) over a shorter TF selected as a display cannot be utilized. The other 2 scripts will have full MTFT functionality and they are my personal favorite. I will be providing very basic info to utilize this script; it is up to you to dive deep into learning this strategy. I am not an expert with the tool or a financial advisor. As with all aspects of life, I recommend you research, learn, discern and practice extensively in order to become a master.
1. MTFT Patterns Pro/Noob
*2. MTFT Full Time Frame Continuity Table
3. MTFT Last HML wOpen
4. MTFT Actionable Signal Targets
5. MTFT Reversal Lines
MTFT Full Time Frame Continuity Table, TheStrat Suite (2of5)
Full timeframe continuity observes what direction different timeframes are pointed at, red or green. This gives you a bias when evaluating a trade. Image below shows 3 instances of the script to outline the max capacity of the script.
Features includes:
1. Four user selected TFs, with 20 different TF to pick from per script instance. Timeframes(TF) include: Yearly(Y), Semi-annually(S), Quarterly(Q), Monthly(M), 2-Week(2W), Weekly(W), 3-Day(3D), Daily(D), 12 hour, 8 hour, 6 hour, 4 hour, 3 hour, 2 hour, 1 hour, 30 min, 15 min, 10 min, 5 min. The first row on the table cell will show the text for the selected timeframe.
2. Color text Green/Red timeframe based on candlestick status for the selected timeframe. Entire Table Cell text will be colored in this color. These can be customized to user preference.
3. Absolute Truth for most recently closed candlestick, plus the active candlestick. This will be displayed in the second row of the table cell. The value inside the brackets ‘ ’ is used for the previous closed candlestick. The value outside the brackets is for the active candlestick.
4. Label pattern if it’s “in force” or not. This only applies for the active candlestick absolute truth value. Note, ‘i’ means the absolute truth is in force. ‘x’ means the absolute truth is not in force.
5. Actionable Signal indication at bottom. If there is an inside candlestick, a hammer or a shooter, the script will display , , and respectively at the bottom on the third row.
6. Auto-hide Lower Timeframes. When the table cell value is smaller than the selected timeframe this timeframe will be hidden. This is done because their will be errors in calculations.
7. Customizable Table Cell Width for use in the different platforms, desktop/mobile. For desktop I use the setting.
IMPORTANT NOTE for TradingView admin: One of the lessons I would consider most important in attaining clarity regarding trading, is “TheStrat” by Rob Smith. His lesson on “actionable signals” is something that can be applied to any strategy. For this reason, I am including “MTFT TheStrat Patterns Pro” script in all images that will depict confluence for a better trade selection.
Example using TheStrat Pro MTFT with this indicator.
Look for a “TheStrat actionable signal” or a “TheStrat Reversal signal” along with this indicator showing several other larger timeframes Red/Green depending on the direction of the actionable signal.
The Image below shows what this would look like with this indicator. The selected candlestick is the Week, it shows a confirmed closed Shooting Star Actionable signal and below the table shows that the Current Week(W), Month(M), Quarter(Q), and Year(Y) are all Red. This actionable signal would be played for SHORTS. If the low is breached than you would enter a short. For targets you would look at the previous pivots, for this example all targets were hit. This wont always play out so nice and clean, but given that there is so many stocks and so many signals this is just a thought to improve the quality of the signal as it has extra confluence.

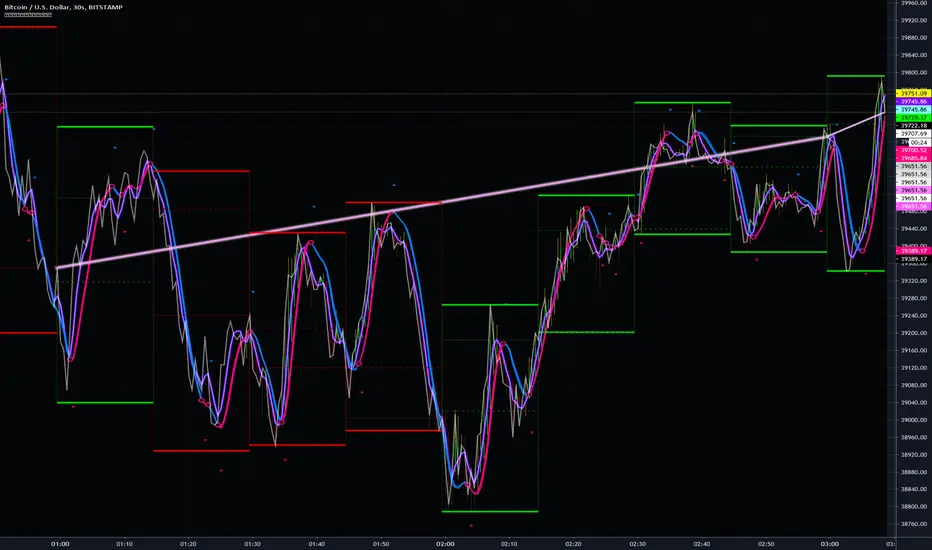
HTF Candles: 3x Multi-Timeframe Candle Boxes #Pip-Whisperer
- Modify 3 Timeframes to display Candle Boxes over your Chart
- Thats it.
- Enjoy!
- If anyone implements candlestick pattern detection to this before me, please send me link, that would be sick!

Perfect Candles By SalamunPerfect Candles Compass Trade Academy By Salamun
The "Perfect Candles By Salamun" indicator is a custom indicator for the TradingView trading platform that uses Pine Script v5. Let me explain its function and usage:
Main Function
1. Candlestick Display Modification
This indicator redraws candlesticks with special logic, especially to handle price gaps that occur when the market reopens after a close.
2. Eliminate Price Gaps
When the market opens after a break (for example after a weekend or holiday), there is usually a gap between the previous closing price and the new opening price.
This indicator "fixes" the gap by adjusting the open price of the new candle to be equal to the close price of the previous candle.
Input Parameters
"Valid only on open days" (default: false)
If enabled, modifications are only applied on market opening days.
If disabled, all candles will be modified
"Hourly threshold for detecting open days" (default: 6 hours)
Determine the time threshold for detecting gaps.
If the time interval between candles is > 6 hours, it is considered as the opening of a new day.
"Show Price" (default: true)
Displays a horizontal price line at the last price level
Ways of working
Gap Detection : Calculating the time difference between candles
Modification Conditions :
If applyToDayOpenOnly= false, OR
If the time gap > the specified threshold
Price Adjustment :
Open price = Close price of the previous candle
Close, High, Low still use original values
Coloring :
Teal green for bullish candles (close ≥ open)
Red for bearish candle (close < open)
Utility
For Traders:
Provides a smoother chart visualization without gaps
Helps with more continuous technical analysis
Useful for timeframes that often experience gaps (such as daily, weekly)
For Analysis:
Reduces noise from opening gap
Helps identify clearer trends
Suitable for strategies that focus on continuous price movements

FX Fix with Adjustable TimezoneFX Fix Time Highlighter
This indicator visually highlights candlesticks at a user-defined time and timezone to help traders easily identify when the FX fix occurs. Simply set your preferred timezone and the exact time you want to mark on the chart, and the indicator will automatically highlight the corresponding candlesticks.
Ideal for forex traders who want a clear visual reference of the FX fix window, aiding in analysis of price behavior during this key market event.
Features:
Customizable timezone selection
Adjustable highlight time (hour and minute)
Automatic candlestick highlighting at the chosen time
Supports all timeframes
Use this tool to better understand market dynamics around the FX fix and improve your trading decisions.

Doji Detector- Alerts!
1. Purpose
The script identifies Doji candles, which are candlesticks with very small or negligible bodies and relatively large wicks. These patterns often indicate market indecision and can serve as potential reversal signals.
2. User Inputs
The script includes several customizable parameters to fine-tune the detection of Doji candles:
• wickRatioLimit: Defines the maximum allowable ratio between the sizes of the upper and lower wicks.
• Example: If the upper wick is no more than 1.5 times larger than the lower wick (or vice versa), the candle can be classified as a Doji.
• bodyColor: Specifies the color for the body of detected Doji candles.
• showMarker: Enables or disables the display of a visual marker (a triangle) below detected Doji candles.
• bodyToWickRatio: Sets the maximum ratio between the size of the candle’s body and the total length of its wicks.
• Example: A body-to-wick ratio of 0.5 means the body cannot be larger than 50% of the sum of the upper and lower wicks.
• alertOnDoji: Activates or deactivates alerts when a Doji candle is detected.
3. Detection Mechanism
The script calculates key components of the candlestick:
• Upper Wick: Difference between the high price and the larger of the open or close prices.
• Lower Wick: Difference between the low price and the smaller of the open or close prices.
• Body Size: Absolute difference between the open and close prices.
It then determines whether the candle qualifies as a Doji based on the following conditions:
1. The body size must be less than or equal to the specified fraction of the total wick size (bodyToWickRatio).
2. The ratio of the upper wick to the lower wick must not exceed the defined wickRatioLimit.
If both conditions are met, the candle is classified as a Doji.
4. Visual Features
The script provides visual indicators for detected Doji candles:
• Bar Coloring: The bodies of detected Doji candles are colored with the specified bodyColor (default is red).
• Markers: If enabled (showMarker = true), a green triangle is plotted below each detected Doji candle for easy identification.
5. Alerts
The script sets up alert conditions for detected Doji candles:
• If alertOnDoji is enabled, an alert is triggered whenever a Doji candle is detected.
• The alert message is customizable and displays “Doji Detected!” by default.
6. Use Case
This script is useful for traders who want to:
• Identify moments of market indecision (Doji patterns) automatically.
• Receive alerts to take appropriate trading actions based on these patterns.
• Highlight Doji candles on charts with customized colors and markers.

HTF Inversion Fair Value Gap | Flux Charts💎 GENERAL OVERVIEW
Introducing our new Higher Timeframe Inversion Fair Value Gaps (IFVG) indicator! Inversion Fair Value Gaps occur when a Fair Value Gap becomes invalidated. They reverse the role of the original Fair Value Gap, making a bullish zone bearish and vice versa. This indicator finds the latest IFVG in a higher timeframe and renders it in the current chart with it's divergence. For more information about the process, read the "HOW DOES IT WORK" section of the description.
Features of the new Higher Timeframe IFVG Indicator :
Renders The Higher Timeframe IFVG
Invalidation Borders
Variety Of Zone Detection / Sensitivity / Filtering / Invalidation Settings
High Customizability
🚩 UNIQUENESS
This indicator lets you take a look at the bigger picture by rendering the latest IFVG in a higher timeframe. You can see the current IFVG divergence to see how is the price action acting around the IFVG. You also can customize the FVG Filtering method, FVG & IFVG Zone Invalidation, Detection Sensitivity etc. according to your needs to get the best performance from the indicator.
📌 HOW DOES IT WORK ?
A Fair Value Gap generally occur when there is an imbalance in the market. They can be detected by specific formations within the chart. An Inversion Fair Value Gap is when a FVG becomes invalidated, thus reversing the direction of the FVG.
This indicator then renders the IFVG in a higher timeframe in your chart like this :
The opaque dashed lines at the top and the bottom of the IFVG indicate the bars that formed the original FVG. The middle dashed line that is semi-transparent shows the candlestick that invalidated the original FVG, thus created the current IFVG. The vertical solid top & bottom wicks indicate the current divergence of the highest & lowest points to the current IFVG.
The IFVGs can act as strong support & resistance points, depending on their creation volume and invalidation volume. Traders can use them for confirmation signals to their positions.
⚙️ SETTINGS
1. General Configuration
Higher Timeframe -> The higher timeframe to detect latest IFVG from. Keep in mind that his setting must be higher than the current timeframe.
IFVG Zone Invalidation -> Select between Wick & Close price for IFVG Zone Invalidation.
2. Fair Value Gaps
FVG Zone Invalidation -> Select between Wick & Close price for FVG Zone Invalidation.
Zone Filtering -> With "Average Range" selected, algorithm will find FVG zones in comparison with average range of last bars in the chart. With the "Volume Threshold" option, you may select a Volume Threshold % to spot FVGs with a larger total volume than average.
FVG Detection -> With the "Same Type" option, all 3 bars that formed the FVG should be the same type. (Bullish / Bearish). If the "All" option is selected, bar types may vary between Bullish / Bearish.
Detection Sensitivity -> You may select between Low, Normal or High FVG detection sensitivity. This will essentially determine the size of the spotted FVGs, with lower sensitivities resulting in spotting bigger FVGs, and higher sensitivities resulting in spotting all sizes of FVGs.
3. Dasboard
You can enable / disable the mitigation dashboard and customize it here.
4. Customization
Offset -> The number of candlesticks the IFVG will be rendered to the right of the latest bar.
Width -> The width of the rendered IFVG in candlesticks.

Liquidity Engulfing & Displacement [MsF]Japanese below / 日本語説明は英文の後にあります。
-------------------------
*This indicator is based on upslidedown's "Liquidity Engulfing Candles ". It's a very cool indicator. thank you.
It has 2 functions: show the Liquidity Engulfing on HTF and candle color change when displacement occurs.
=== Function description ===
1. Liquidity Engulfing on HTF
This indicator gives Liquidity Engulfing signals not only for the current candle, but also for H4 and H1 on HTF.
You can use that a bullish engulfing on H1 is a BOS on m5 and on H4 is a BOS on m15. It uses the theory of stop hunt from ICT.
Also, It's possible to fire alert.
2. Displacement
Change the color display of the candlesticks when a bullish candleStick or bearish candleStick is attached. Furthermore, by enabling the "Require FVG" option, you can easily discover the FVG (Fair Value Gap). It is a very useful function for ICT trading.
When H1 candle takes liquidity from one side and moves with an explosive move to the other side of the previous candle (displacement), it creates break of market structure on M5. Entry on discount FVG or OTE with stop loss at or below the stop hunt wick.
=== Parameter description ===
- Liquidity engulfing candles(LEC) SETTING
- Show H1 LEC … Whether to show LEC for H1
- Show H4 LEC … Whether to show LEC for H4
- Show Current LEC … Whether to show LEC for current timeframe
- Apply Stop Hunt Wick Filter … Require candle wick into prior candle retracement zone
- Apply Close Filter … Require LL/HH on candle in order to print a valid engulfing signal
- DISPLACEMENT SETTING
- Require FVG … Draw only when FVG occurs
- Displacement Type … Displacement from open to close? or from high to low?
- Displacement Length … Period over which to calculate the standard deviation
- Displacement Strength … The larger the number, the stronger the displacement detected
-------------------------
2つの機能があります: 上位足のLiquidity engulfing(流動性獲得)を表示することと、大きな変位が発生したときにローソク足の色を変更することです。
=== 機能説明 ===
1. 上位足のLiquidity engulfing
このインジケーターは、現在のローソク足だけでなく、上位足の H4 および H1 に対してもLiquidity engulfingシグナルを提供します。
H1はm5、H4はm15での使用を推奨します。これはICTのストップハント理論を活用しています。また、アラートを発することも可能です。
2. 変位(DISPLACEMENT)
大きな陽線、陰線を付けた場合に、そのローソク足をカラー表示を変更します。
さらに"Require FVG"オプションを有効にすることで、FVG(Fair Value Gap)を容易に発見することができます。ICTトレードにを行うにあたり大変有用な機能となっています。
=== パラメータの説明 ===
- Liquidity engulfing candles(LEC) SETTING
- Show H1 LEC … H1のLECを表示するかどうか
- Show H4 LEC … H4のLECを表示するかどうか
- Show Current LEC … 現在の期間の LEC を表示するかどうか
- Apply Stop Hunt Wick Filter … ハラミ足、もしくは包み足になっている場合のみに検知させる
- Apply Close Filter … 1つ前のローソクよりも終値で超えていた場合のみに検知させる
- DISPLACEMENT SETTING
- Require FVG … FVG発生時のみ描画する
- Displacement Type … openからcloseまでの変位か?highからlowまでの変位か?
- Displacement Length … 標準偏差を計算する期間
- Displacement Strength … 変位の強さ(数字が大きいほど強い変位を検出)

shadow barThis indicator shows a new formation of retrospective candlestick bars of one period (n) of time.
In this way the trader can see how the traditional bars are part of a larger formation that can show a trend or a range.
The new shadow bars are drawn with a degree of transparency that makes it possible to distinguish traditional candlesticks;
and where shadow candles can be seen as support or resistance to traditional candlesticks.
When the traditional candlesticks are the same size as the shadow candlesticks, it can be expected that we are forming a compression or range that will result in a strong move.
In addition to the shadow bars, there is a ribbon created from the new candlestick data that is formed as a line from the linear regression function and another that is the previous line smoothed by its exponential moving average. This tape allows you to see the trend more clearly and at the crossovers of the lines that form possible reversals or continuations of the trend. The indicator has the timeframe field active, which allows the indicator to be displayed in other temporalities.
*The closing price of the new bars is the same as that of the traditional bars.
* The tape is turned off by defa

Three Bar Gap (Simple Price Action - with 1 line plot)This script is tailored towards experienced traders who prefer to view raw price charts during live execution. It searches for a three-bar pattern of what is colloquially called "fair value gap", or "imbalance" and uses a single line to plot the results. The goal is to display price in a way that is as simple as possible so that chart readers who don't prefer to add indicators on their screen will still find this indicator as an acceptable option to consider for.
From a code perspective, this script explores a new PineScript feature called UDT (user-defined types). This is an incredible update because it brings developers one step close to having the ability to create abstract data types.
█ What is price action?
Experienced traders will tell you that the chart that they use for live execution is raw, clean, and uses no indicators. They say they execute on price action, so what exactly is price action?
There is no formal definition to it, but one can agree that it implies the process of analyzing price without considering the fundamentals, without needing to know what the news was about, and without needing to know any of the Greeks (except for the desire to “seek alpha” Ha.haa...). This is not to say that price action traders are executing in their own vacuums without the need to know what is happening around the world. Surely fundamentals and financial models can be used beforehand for developing a bias for what is being traded, but it’s price-first at the moment of execution. That said, Factor (A) is Price.
Factor (B) is time-perception, it’s how the trader reads the tape. How the trader perceives price to change with respect to time is valuable information. Interpretation of "time" will be elaborated in the next section that talks about candlestick patterns detected by this script.
Putting this together, price action means the analysis of price movement by only considering (A) price, and (B) time, to predict which direction the market will move. A speculative trader is timing the market with the expectation to make a quick in-and-out profit; she/she is using price action. On the other hand, a long term investor holding a diversified portfolio with a strategy based on modern portfolio theory combined with fundamental analysis (at this point candlesticks are irrelevant) but has one additional criteria of, say, can only go Long on a stock when it has closed Green on Daily; he/she is also considered to be executing on price action.
█ Candlestick patterns
This script calculates the displacement of highs and lows over three consecutive bars.
A) Down move = When High of the recent confirmed bar is lower than the Low of the previous-previous candle
B) Up move = When Low of the recent confirmed bar is higher than the High of the previous-previous candle
(Note that its the confirmed bar that is being talked about, so it does not repaint)
An ATR filter will be applied to reduce the number of lines generated as many times they might just be associated with minor price changes.
Interpretations:
When price moves quickly across three bars, it can be thought that it has gapped. Although the candle in the middle appears to be solid, it’s not from a conceptual perspective. This is because time itself is arbitrary; timeframes don’t necessarily have to be fixed intervals. Take stocks with regular trading hours for example, if price makes a breakaway gap and you bundle the after-hours and pre-market sessions together as one candle, never minding that intervals should be fixed, then you will see the exact three-bar-gap patterns. Similar happens during intraday sessions on lower timeframes, if you zoom-in closer, you’ll see that ticks within the middle candle are sparsely dispersed. This is why it's called a gap.
█ Parameters with fixed inputs & assumptions used:
ATR is used for filtering out minor movements that will likely be deemed as irrelevant by trader for the purpose of live execution. The following inputs are required:
A) ATR lookback period
B) Multiplier
The product of ATR(len=A) and B produces a threshold for minimum distance that price must gap by. Initially, it was proposed to be only based on one ATR, but often an ATR is too wide and using it will filter out too many lines. Because of this observation, a multiplier (Parameter B) has been introduced to allow users to apply fractional ATR as a threshold.
█ Applications:
For trend followers: Follow the direction of the gap. Entering above recent high/low points above/below the first impulse with a stop-limit order is a viable tactic.
For contrarians fading a trend: The mid-point is a good point of reference for predicting potential areas of support/resistance.

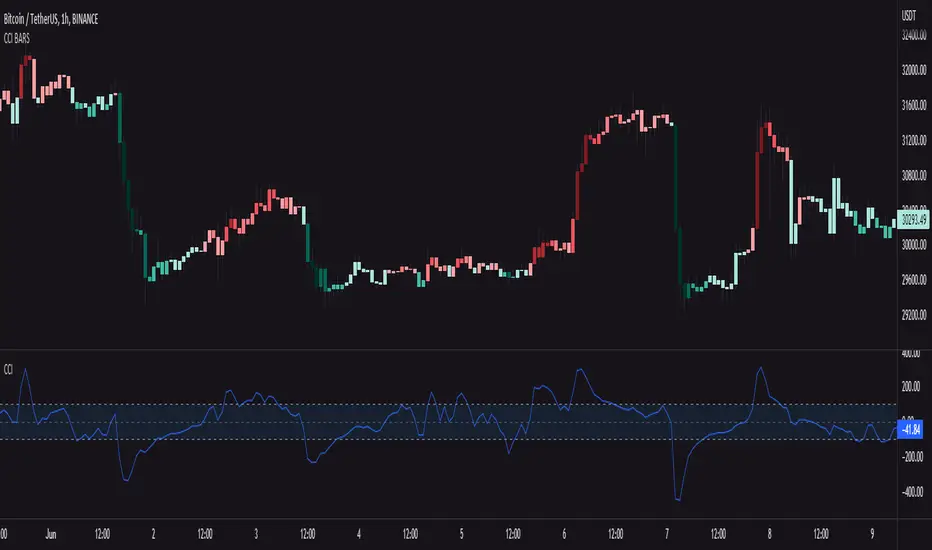
CCI BARSCandlesticks with color of the current CCI value
This script works following: It measures CCI value from -250 to 250 => the lower the value, the darker green candlesticks will be.. it works the same in the opposite direction, but with red color
You can also edit colors of candlesticks and length and source of the CCI indicator
Bullish and Bearish by NicolErazoFThis indicator changes the color of the candlesticks when there’s a change in the trend to the rising or falling trend.
BEARISH ENGULFING: Yellow candlestick. It is an engulfing falling trend reversal; you must make a sell decision.
BEARISH HARAMI: White candlestick. Indicates a possible falling trend change, you must be alert for a possible sale.
BULLISH ENGULFING: Black candlestick. It is a change in the engulfing rising trend, you must make a purchase decision.
BULLISH HARAMI: Blue candlestick. Indicates a possible rising trend change, you should be alert for a possible purchase.
On the chart, you can see the 4 candles, on September 11 the black candle appears indicating a change in the uptrend. But today, the white candle is seen, which appears on September 8, indicating a rebound with a possible change in trend to bearish.
Previous days, on August 26, you see the blue candle with a possible change in the upward trend, which then, on August 28, a yellow candle appears with a change in the downward trend.
The Engulfing indicator (yellow and black) says that the candle has an engulfing change that is radical.
On the other hand, the Harami (blue and white) indicates a possible change in trend that must be previously analyzed.
Harami candles are smaller than Engulfing candles, since Harami in a Japanese term that means pregnancy, where the previous candle is the woman and the next candle is the baby.
___________________________________________________________________________
ESPAÑOL
Este indicador cambia las velas de color cuando ocurre un cambio de tendencia ALCISTA o BAJISTA
BEARISH ENGULFING: Vela de color amarillo. Es una cambio de tendencia bajista envolvente, debes tomar una decisión de venta.
BEARISH HARAMI: Vela de color blanco. Indica un posible cambio de tendencia bajista, debes estar alerta para una posible venta.
BULLISH ENGULFING: Vela de color negro. Es un cambio de tendencia alcista envolvente, debes tomar una decisión de compra.
BULLISH HARAMI: Vela de color azul. Indica un posible cambio de tendencia alcista, debes estar alerta para una posible compra.
En el gráfico, se pueden ver las 4 velas, el 11 de Septiembre aparece la vela negra que indica un cambio de tendencia alcista. Pero hoy, se ve la vela blanca, que aparece el 8 de septiembre, indicando un rebote con un posible cambio de tendencia a bajista.
Días anteriores, el 26 de Agosto, se ve la vela azul con un posible cambio de tendencia alcista, que luego, el 28 de agosto aparece una vela amarilla con cambio de tendencia bajista.
El indicador Engulfing (amarillo y negro) dice que la vela tiene un cambio envolvente que es radical.
En cambio, el Harami (azul y blanco) indica un posible cambio de tendencia que debe ser previamente analizado.
Las velas Harami son más pequeñas que las Engulfing , ya que Harami en un término japonés que significa embarazo, en donde la vela anterior es la mujer y la vela siguiente es el bebé.

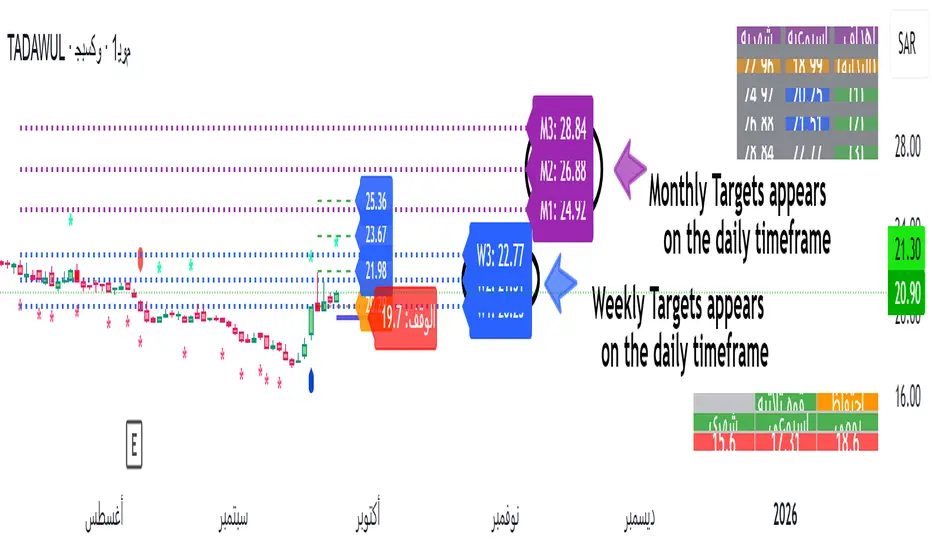
MTF POWER OF 3 TNF💻Types of Candlesticks in the Indicator
• Strong/Valid Candles: Identified by small asterisks below and above the candlestick body; Those with a body larger than 55% of the candle's total range.
• Tailed Candles: Are not marked by asterisks.
( onedrive.live.com)]! ( onedrive.live.com)
The General Idea of the Indicator's Signals
The indicator generates signals based on specific candlestick patterns. It identifies valid candlesticks (those with a body larger than 55% of the total candlestick range) and marks them with asterisks above and below the body. Candlesticks with significant tails (long wicks) that do not meet the criteria are not marked.
These signals help traders spot potential trend reversals or continuation patterns, depending on the context and location of the marked candles within the broader price action.
(onedrive.live.com)]! (onedrive.live.com)
Daily time frame conditions
( onedrive.live.com)]! ( onedrive.live.com)
Weekly and monthly time frame conditions
( onedrive.live.com)]! ( onedrive.live.com)
( onedrive.live.com)]! ( onedrive.live.com)
(onedrive.live.com)]! (onedrive.live.com)
(onedrive.live.com)]! (onedrive.live.com)
Best Trading Conditions
- Condition 1: (the best)
• Daily Timeframe: Buy
• Weekly Timeframe: Positive (Bullish)
• Monthly Timeframe: Positive (Bullish)
( onedrive.live.com)]- ! ( onedrive.live.com)
- Condition 2:
• Daily Timeframe: Buy
• Weekly Timeframe: Positive (Bullish)
• Monthly Timeframe: Negative (Bearish) (with the condition that monthly resistance is distant)
(onedrive.live.com)]- ! (onedrive.live.com)
- Confirmatory trend line
( onedrive.live.com)]- ! ( onedrive.live.com)
- Volume detection by candle colors;
- ! (onedrive.live.com)
CE_ZLSMA_5MIN_CANDLECHART-- Overview
The "CE_ZLSMA_5MIN_CANDLECHART" strategy, developed by DailyPanda, is a comprehensive trading strategy designed for analyzing trading on 5-minute candlestick charts.
It aims to use some indicators calculated from a Hekin Ashi chart, while running it on a normal candlestick chart, making sure that no price distortion affects the strategy results .
It also brings a feature to show, on the candlestick chart, where the entries would take place on the HA chart, to also be able to study the effect that the price distortion would make on your backtest.
-- Credit
The code in this script is based on open-source indicators originally written by veryfid and everget, I've made significant changes and additions to the scripts but all credit for the idea goes to them, I just built on top of it:
-- Key Features
It incorporate already built indicators (ZLSMA) and CandelierExit (CE)
-- Zero Lag Least Squares Moving Average (ZLSMA) - by veryfid
The ZLSMA is used to detect trends with minimal lag, improving the accuracy of entry and exit signals.
It incorporates a double-smoothed linear regression to minimize lag and enhance trend-following capabilities.
Buy signals are generated when the price closes above the ZLSMA together with the CE signal.
It is calculated based on the HA candlestick pattern.
-- Chandelier Exit (CE) - by everget
The Chandelier Exit indicator is used to dynamically manage stop-loss levels based on the Average True Range (ATR).
It ensures that stop-loss levels are adaptive to market volatility, protecting profits and limiting losses.
The ATR period and multiplier can be customized to fit different trading styles and risk tolerances.
It is calculated based on the HA candlestick pattern.
-- Heikin Ashi Candles
The strategy leverages Heikin Ashi candlesticks to be able identify trends more clearly and leverage this to stay on winning trades longer.
Traders can choose to display Heikin Ashi candlesticks and order fills on the chart for better visualization.
-- Risk Management
The strategy includes multiple risk management options to protect traders' capital.
Maximum intraday loss limit based on a percentage of equity.
Maximum stop-loss in points to filter out entries with excessive risk.
Daily profit target to stop trading once the goal is achieved.
Options to use fixed contract sizes or dynamically adjust based on a percentage of equity.
These features help traders manage risk and ensure sustainable trading practices.
Moving Averages
Several moving averages (EMA 9, EMA 20, EMA 50, EMA 72, EMA 200, SMA 200, and SMA 500) are plotted to provide additional context and trend confirmation.
A "Zone of Value" is highlighted between the EMA 200 and SMA 200 to identify potential support and resistance areas.
-- Customizable Inputs
The strategy includes various customizable inputs, allowing traders to tailor it to their specific needs.
Start and stop trading times.
Risk management parameters (e.g., maximum stop-loss, daily drawdown limit, and daily profit target).
Display options for Heikin Ashi candles and moving averages.
ZLSMA length and offset.
-- Usage
-- Setting Up the Strategy
Configure the start year for the strategy and the trading hours using the input fields. The first candle of each day will be filled black for easy identification, while candles that are outside the allowed time range will be filled purple.
Customize the risk management parameters to match your risk tolerance and trading style.
Enable or disable the display of Heikin Ashi candlesticks and moving averages as desired.
-- Interpreting Signals
Buy signals are indicated by a "Buy" label when the Heikin Ashi close price is above the ZLSMA and the Chandelier Exit indicates a long position.
The strategy will automatically enter a long position with a stop-loss level determined the swing low.
Positions are closed when the close price falls below the ZLSMA.
-- Risk Management
The strategy monitors the maximum intraday loss and stops trading if the loss limit is reached.
If enabled, also stops trading once the daily profit target is achieved, helping to lock in gains.
You have the option to filter operations based on a maximum accepted stop-loss level, based on your risk tolerance.
You can also operate with a fixed amount of contracts or dynamically adjust it based on your allowed risk per trade, ensuring optimal protection of capital.
-- Visual Aids
The strategy plots various moving averages to provide additional trend context.
The "Zone of Value" between the EMA 200 and SMA 200 highlights potential support and resistance areas.
Heikin Ashi candlesticks and order fills can be displayed to enhance the difference this strategy would take if you were to backtest it on a Heikin Ashi chart.
-- Table of results
This strategy also breaks down the results on a monthly basis for better understanding of your capital development along the way.
-- Conclusion
The "CE_ZLSMA_5MIN_CANDLECHART" strategy is a tool for intraday traders looking to understand and leaverage the Heikin Ashi chart while still using the normal candle chart. Traders can customize the strategy to fit their specific needs, making it a versatile addition to any trading toolkit.

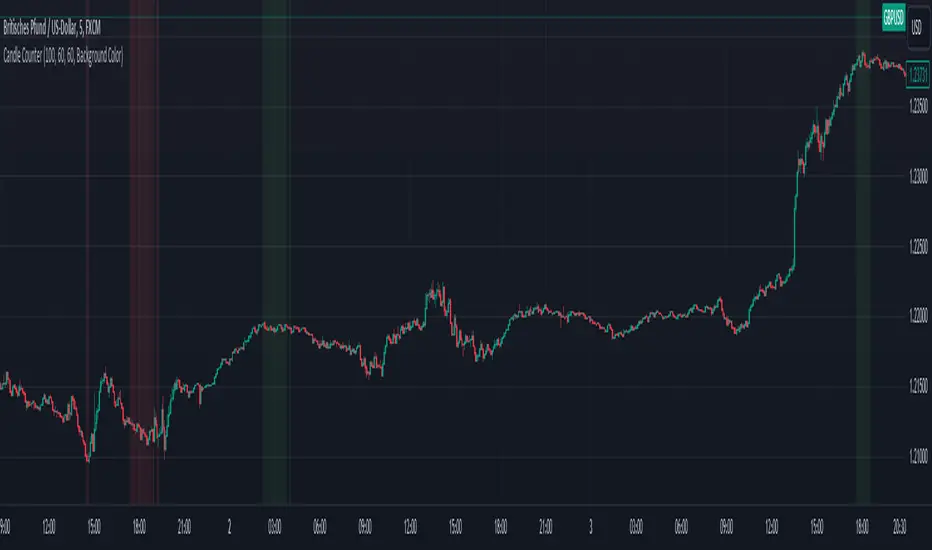
Bullish vs. Bearish Candle CounterFollowing an exhaustive analysis of the most recent 50,000 candles within a given currency pair, a notable equilibrium between bearish and bullish candles has emerged as a persistent market phenomenon. This equilibrium, indicative of the market's continuous endeavor to establish parity, has spurred the development of the following indicator.
The indicator meticulously scrutinizes the preceding 100 candles, promptly triggering an on-chart marker when either bullish or bearish candle counts surpass the threshold of 60%. This marker serves as an invaluable tool, providing traders with a potential signal for the initiation of a trend reversal.
As such, this indicator serves as a valuable asset in a trader's toolkit, offering insights into shifts in market sentiment and the prospect of emerging trends.
Key Features:
- Customizable Candle Count: Traders can set the number of candlesticks to be analyzed in the input parameters, allowing flexibility in their analysis.
- Bullish and Bearish Percentage: Users can define their desired percentage for both bullish and bearish candles in the indicator's settings. The indicator calculates the percentage of each candle type within the specified range.
- Arrow Signals: The indicator plots arrows above or below the current candle, indicating bullish or bearish conditions based on the defined percentage thresholds. A green arrow signifies bullish sentiment, while a red arrow denotes bearish sentiment.
How to Use:
- Adjust Parameters: In the indicator settings, users can customize the number of candlesticks to be analyzed, as well as set their preferred percentages for both bullish and bearish conditions.
- Interpret Arrows: The indicator generates arrows above or below the current candle, reflecting the prevailing market sentiment. A green arrow suggests a bullish bias, while a red arrow indicates a bearish bias.
- Trade with Confidence: Traders can use this indicator as a tool to gauge market sentiment and make informed trading decisions. It helps identify potential entry and exit points based on the chosen percentage thresholds.
CANDLE STICK HEATMAPCANDLE STICK HEATMAP shows the statistics of a candle at a particular time. its very useful to find repeating pattern's at a particular time in a day.
based on the settings you can see regular repeating patterns of a day in an hourly chart. During a particular time in day there is always a down or up signal or candles.
The table boxes are candles in RED and GREEN based on open and close of the chart. The Heat map is very useful in analyzing the daily Hourly candlesticks in a week. The Time of each candlestick is plotted on the table along with default Indicators like RSI, MACD, EMA, VOLUME, ADX.
Additionally this can be used as a screener of candles on all timeframes. Analysis is easy when you want to see what happened exactly at a particular time in the previous hour, day, month etc.,
Hopefully additional updates will be introduced shortly.
Indicators:
1. MACD (close,12,26,9)
2.RSI (close,14)
3.EMA 200
3.Volume MA
Option is provided to show indicator statistics and time.
Color can be changed using settings.
Supports all Time Zones

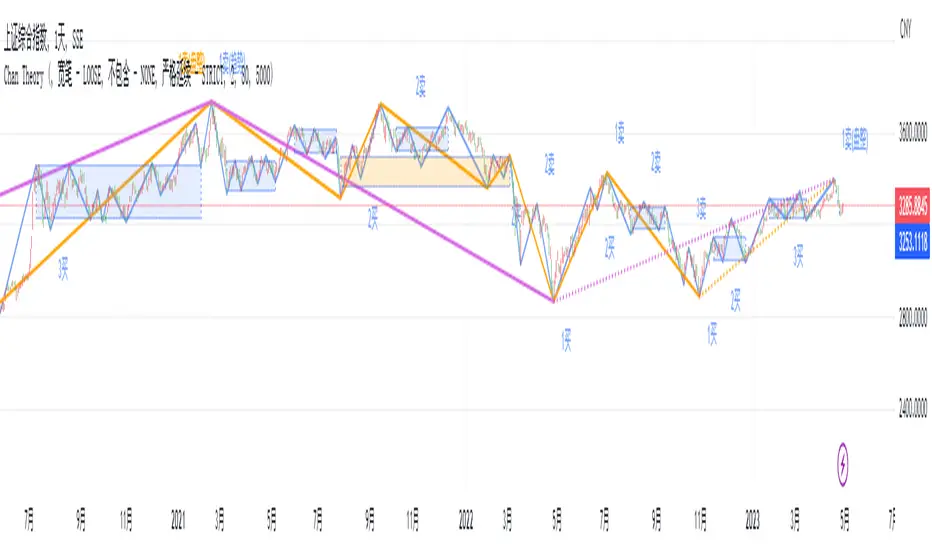
Chan Theory - CHANLUN | CZSCChan Theory (CHANLUN) is a technical analysis theory created by Chinese analyst CZSC, primarily applied in the analysis and decision-making of financial markets such as stocks, futures, forex, and crypto.
It is a technical analysis method based on price and time, including candlestick patterns, fractal theory, box theory, trend theory, divergence theory, multiple time frame analysis, and more.
"Chan" means zen, indicating that the fluctuations in the market are rooted in human nature, such as greed, anger, ignorance, slowness, and suspicion.
"Chan" is also the pinyin of the Chinese character '缠', which means entanglement or entwining. as the fluctuations in the stock market were intertwined like a spiral.
Concepts
Fractal - fractal is formed by three candlesticks, with the middle one being the highest for a top fractal and the lowest for a bottom fractal. In Chan Theory, the first step is to traverse all candlesticks to find all valid fractals.
Stroke - stroke is usually composed of multiple fractals, with a top fractal and a bottom fractal at both ends, and the connection between them forms a stroke with clear high and low points. This is the smallest unit of composition in Chan Theory, similar to the zigzag algorithm.
Segment - segment is generated from strokes based on the feature sequence algorithm, and a segment contains at least three strokes. a segment is a higher level of period, indicating the trend of the market at a higher level,similar to period 5M to period 30M.
Box - box is the overlapping area of multiple segments, and a box contains at least three segments. A box represents a densely traded area and a temporary consensus price range,the bull-bear battle has not produced a clear outcome, it means that the market is in a state of uncertainty and that the direction of the trend is unclear.
Trend - In Chan Theory, two or more boxes in the same direction form a trend,If the box position are gradually rising, it is defined as an uptrend,conversely, it is a downtrend.
Differences with ZigZag
Both the Chan Theory Stroke and the ZigZag are formed by connecting the high and low points to create a line. But in Chan Theory, there are strict additional requirements:
There must be at least five candlesticks between the high and low points, Otherwise it does not form a Stroke.
The high and low fractal cannot share the same candlestick,Otherwise it does not form a Stroke.
There must be at least three candlesticks between the high and low fractal,these three candlesticks must move in the same direction.
There may be complex situations where there are multiple top or bottom patterns in a single Stroke, requiring special handling to determine the connection rules for the lines.
Chan Theory is a complex theory that includes not only Stroke, but also other theories such as Box、Recursion and Divergence.
Recursion
The processing flow of the Chan Theory is similar to a ternary algorithm, It organizes chaotic candlestick into an orderly system (Fractal -> Stroke -> Segment -> Box -> Trend),levels gradually increase from small to large. We can let the levels develop continuously to obtain the appropriate level for analysis and trading, In Chan Theory, it is called "recursion". This method allows us to observe the structure of smaller levels to make trading decisions at the current level,and it allows us to combine multiple levels to determine specific trading points.
Divergence
Chan Theory uses MACD to infer the strength of the trend as momentum analysis. Chan Theory calculates the MACD area of the K-line to quantify the strength of a trend, and compares the areas of the front and back two sections of the same level box to determine whether the trend is exhausted,it is called "divergence". this is one of the important part to determine trading points.
缠论是一种技术分析理论,由中国分析师 "缠中说禅"所创立,主要应用于股票、期货、外汇、加密货币等金融市场的分析和决策。
市场哲学和禅
以股市为基础。缠者,价格重叠区间也,买卖双方阵地战之区域也;禅者,破解之道也。以阵地战为
中心,比较前后两段之力度大小,大者,留之,小者,去之。
以现实存在为基础。缠者,人性之纠结,贪嗔疾慢疑也;禅者,觉悟、超脱者也。以禅破缠,上善若
水,尤如空筒,随波而走,方入空门。
技术分析简解
以走势中枢为中间点的力度比较,尤如拔河,力大者,持有原仓位,力小者,反向操作。
把走势全部同级别分解,关注新的走势之形成,以前一走势段为中间点与再前一走势段比大小,大者,
留之,小者,去之。
进行多重赋格性的同级别分解操作,尤如行船、尤如开车,以不同档位适应不同情况
技术分析量化组件
形态学 - 笔、线段、走势中枢、走势类型
动力学 - 背驰、走势中枢、走势的能量结构
壹缠脚本是以缠论为核心理论,实现的技术分析指标系统
功能说明
基于缠论分析 实时笔段走势画线、自动中枢标识、多级别K线递归走势、实时标注缠论三类买卖点
支持配置多种笔、段、走势规则 满足交易者的笔段习惯和风格
支持TradingView警报机制 实时推送各级别买卖点通知到邮箱或Webhook
脚本图例说明
笔段走势 - 蓝线为当前级别K线构成的笔,紫色线为基于笔级别特征序列处理生成的段,紫线为基于当前级别段生成的走势
中枢级别 - 各级别画线、中枢、买卖点提示信息采用同一颜色。即笔级别中枢同为浅蓝色、段级别中枢为橙色。
MACD面积 - 笔段走势的末端数字为对应笔段的MACD面积, 蓝色为笔MACD面积,橙色为段MACD面积,紫色为走势MACD面积。
DojiCandle body size RSI-SMMA filter MTF
DojiCandle body size RSI-SMMA filter MTF
Hi. I was inspired by a public script written by @ahmedirshad419, .
I thank him for his idea and hard work.
His script is the combination of RSI and Engulfing Pattern.
//------------------------------------------------------------
I decided to tweak it a bit with Open IA.
I have changed:
1) candle pattern to DojiCandle Pattern;
2) I added the ability for the user to change the size of the candlestick body;
3) Added SMMA 200;
4) Changed the colour of SMMA 200 depending on price direction;
5) Added a change in the colour of candlesticks, depending on the colour of the SMMA 200;
6) Added buy and sell signals with indicator name, ticker and close price;
7) Added ability to use indicator on multi time frame.
How it works
1. when RSI > 70 > SMMA 200 and form the bullish DojiCandle Pattern. It gives sell signal
2. when RSI < 30 < SMMA 200 and form the bearish DojiCandle Pattern. It gives buy signal
settings:
basic setting for RSI, SMMA 200 has been enabled in the script to set the levels accordingly to your trades
Enjoy

4K+ Candlestacks/ColumnCandles Plus PerksFor all candle analysis enthusiasts out there, this is my cutting edge "4K+ Candlestacks/ColumnCandles Plus Perks" that I spontaneously invented long ago. Just when you may have thought it was the end of the evolutionary line for candle technology, it's not! There are candlesticks and now "candlestacks". Your eyes are presently gazing upon a NEW candle type intended for destiny well into the 21st century and onward to support much higher graphics resolutions including 4K, 8K, 16K+ yielding enhanced chart analytics. With extremely high resolution display technologies arriving within the affordable range, having thin 1 pixel wide traditional candle wicks are going to become more and more visually apprehensible. Particularly for folks with a visual acuity that is not par at 20/20 or have some degree of color blindness, the candlestacks have a "large" amount of different color schemes to select from.
"Candlestick charts" are suspected to have been invented by Munehisa Homma well over 200 years ago. We have been using technology that is older than the age of distributed electricity and the modern car combined with billions at stake, hour to hour of each day. While candlesticks are effective, by having an abundance of computing power, the old candlestick wick width is becoming indistinguishably lost in the fog of a plenitude of plots. After a short time of contemplating about it linguistically in Pine Script, I arrived at a eureka moment having an actual working candle that was entirely novel. However, I didn't want to stop there. It required color finesse for diagnosed visual impairments combined with methods such as Heikin Ashi variants. My intention while inventing this was to provide the ultimate experience in candle technology that could potentially exist.
"Candlestacks" are just like the original OHLC candlesticks, however the "wick" portion is more like a column displaying visually increased situational awareness. Immediately at first sight, I originally conceived of the name "ColumnCandles" upon initial inspection of the plot, being it was remarkably similar to overlapping column charts I have been seeing for years with data metrics. In my attempt to formulate a worthier name, I noticed their appearance looks like stacks of blocks. Stacks, sticks, it sounded rhythmically sweet. I decided candlestacks would be a more appropriate name for this candle type distinguishable from candlesticks, but all to similarly sounding. I am hopeful I chose candlestacks as a fitting name that the rest of the world may come to appreciate one day when the planet is powered by nuclear "compact fusion" reactors and everyone has personal aerial transportation availability. "Candlestacks" vs "ColumnCandles", leave your opinion below in the comments if you are compelled to do so, providing a consensus. I respect your opinion either way...
Heikin Ashi, with it's advantages of identifying current short term trends, seemed worthy of inclusion, so I decided to expand on candlestacks with three different formulations to select from, including a fourth OHLC basic type. There are two distinct methods of Hieken Ashi employing pre-smoothing and post-smoothing techniques, each of which having capabilities of using different smoothing filters that are selectable.
Other features include a brightening option for the first descending candle which is best suited while using Heikin Ashi. The candlestacks wick transparency is independently controllable. Descending candlestacks have a darker wick than the ascending kind. With the Heikin Ashi smoothing techniques, I included a selection to see traditional candlestick wicks in a supplementary fashion. Also, there is an option to control the amount of candlestacks that are displayable. This is also a multicator including my "SWIFT Moving Average Crossover", which is complimentary to the candlestacks, especially in one of the Heikin Ashi modes. This moving average crossover(MAC), having multiple color schemes, limits the divergences between the leading and lagging lines. Of notable mention, the crossover dots on the SWIFT MAC you see, are actually one bar late. Lastly, with this flagship indicator, I included a multi-color "neon source" line to view close, hl2, etc... in combination with the candlestacks yielding the best of both worlds selectively. Any one of the individual indicators may actually be enabled/disabled independently. Being this is an overlay chart, I "may" include other overlay indicators in the future where they provide an added benefit to what is already included.
I provided multiple color schemes for those of you who may have color blindness vision impairments. You may contact me in private, if these color schemes are not suitable for your diagnosed visual impairment, and you wish to contribute to seeing the color schemes improved along with other future indicators I shall release.
I.P.O.C.S.: "Initial Public Offering Clean Start" proprietary technology. Firstly, many of my other indicators already possess this capability. It allows suitable plotting from day one, minute one of IPO, remedying visually delayed signal analysis. It's basically accurate plotting from the very first bar (bar_index==0) on Tradingview. If you don't know what this is, most people don't, go back to the VERY beginning of any stock on the "All" chart and compare it to other similar indicators. What's so special about this? It is extremely difficult to get a healthy plot from bar_index==0 on any platform. However, I have become exceedingly talented performing this feat in most cases, but not all depending on the algorithm. This indicator is a successful accomplishment implementing IPOCS. It's inherent value is predominantly for IPO traders who in the past have had to wait 20, 50, and 150 bars before they obtain a precise indicator measurement for the simplest of algorithms in order to make a properly informed decision to potentially invest in an asset. How is this achieved? It's a highly protected secret of mine... but I will say I rarely use Pine built-in functions at all. When I do, I use them scarcely due to currently existing Pine language limitations.
Features List Includes:
I.P.O.C.S.(Initial Public Offering Clean Start) Technology
Enable/disable dark background for enhanced visibility
Color schemes for individual indicators
Controls for Heikin Ashi candlestacks smoothing
Historical bar controls
"Neon Source" options
Many, many more previously described...
This is not a freely available indicator, FYI. To witness my Pine poetry in action, properly negotiated requests for unlimited access, per indicator, may ONLY be obtained by direct contact with me using TV's "Private Chats" or by "Message" hidden in my member name above. The comments section below is solely just for commenting and other remarks, ideas, compliments, etc... regarding only this indicator, not others. When available time provides itself, I will consider your inquiries, thoughts, and concepts presented below in the comments section if you do have any questions or comments regarding this indicator. When my indicators achieve more prevalent use by TV members, I will implement more ideas when they present themselves as worthy additions. As always, "Like" it if you simply just like it with a proper thumbs up, and also return to my scripts list occasionally for additional postings. Have a profitable future everyone!
Bearish Engulfing Backtest This is a bearish candlestick reversal pattern formed by two candlesticks.
Following an uptrend, the first candlestick is a up candlestick which is
followed by a down candlestick which has a long real body that engulfs or
contains the real body of the prior bar. The Engulfing pattern is the reverse
of the Harami pattern.
WARNING:
- For purpose educate only
- This script to change bars colors.

[DEM] MACD Bars MACD Bars is designed to color price bars based on the relationship between the MACD line and its histogram to provide immediate visual feedback about momentum conditions and potential trend changes. The indicator calculates the standard MACD using the default parameters (12, 26, 9) and applies a three-color system to the candlesticks: green bars when the MACD line is above both the histogram and zero (indicating strong bullish momentum), red bars when the MACD line is below both the histogram and zero (indicating strong bearish momentum), and purple bars for all other conditions where momentum signals are mixed or transitional. This color-coding system helps traders quickly identify periods of strong directional momentum versus periods of uncertainty or potential reversal without needing to reference a separate MACD indicator pane.
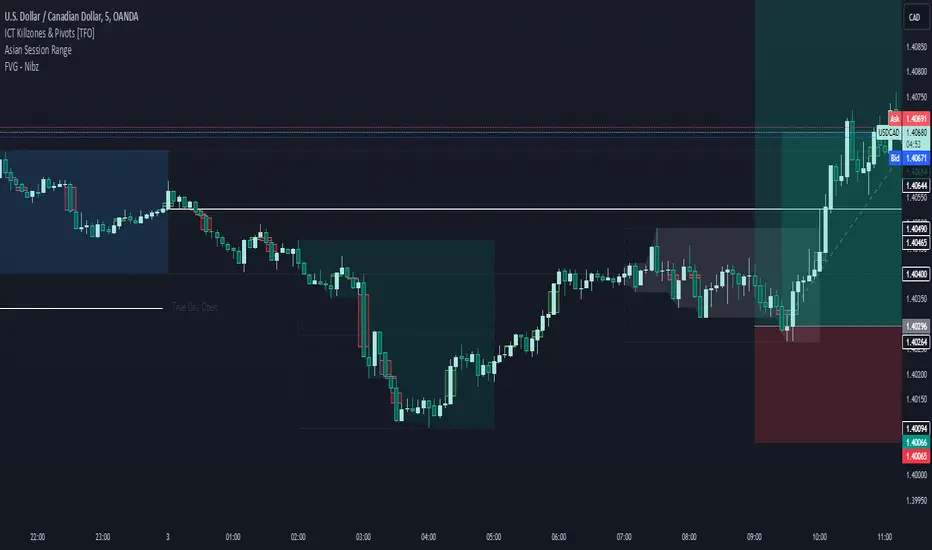
FVG - NibzDescription: Fair Value Gap (FVG) Indicator - Nibz
This Pine Script identifies and visualizes Fair Value Gaps (FVGs) on your TradingView chart. FVGs are price inefficiencies left behind when the market moves too quickly, skipping price levels that might not be tested. These gaps often act as magnets, attracting price for potential reversals or continuations.
The script works by detecting upward (bullish) and downward (bearish) price imbalances based on specific candlestick criteria and then marks these zones on your chart using customizable shaded boxes. This tool is essential for traders looking to identify key areas of market inefficiency that could signify support/resistance levels, potential reversal zones, or areas to monitor for market rebalancing.
How It Works
1. Bullish FVG Detection
The script identifies an upward imbalance when:
The low of the candlestick two bars back is less than or equal to the open of the previous bar.
The high of the current candlestick is greater than or equal to the close of the previous bar.
When this condition is met and the size of the imbalance is greater than zero, a green box is drawn from the low of the second candlestick back to the high of the current candlestick.
2. Bearish FVG Detection
The script identifies a downward imbalance when:
The high of the candlestick two bars back is greater than or equal to the open of the previous bar.
The low of the current candlestick is less than or equal to the close of the previous bar.
When this condition is met and the size of the imbalance is greater than zero, a red box is drawn from the low of the current candlestick to the high of the second candlestick back.
Customization Options
This script is highly customizable, allowing you to tailor the appearance of the FVG boxes to suit your trading style and chart aesthetics:
Bullish FVG:
Fill color and transparency.
Border color and transparency.
Bearish FVG:
Fill color and transparency.
Border color and transparency.
The settings are user-friendly, with intuitive sliders for transparency and color pickers for customization.
How to Use the Indicator
Adding the Script:
Add the indicator to your chart, and it will automatically mark bullish (green) and bearish (red) FVGs.
Interpreting FVGs:
Bullish FVGs (green zones): These often act as support or areas of potential price rebalancing on retracement.
Bearish FVGs (red zones): These often act as resistance or areas of interest for short entries.
Trade Ideas:
Use FVG zones to confirm other trade signals or strategies.
Watch for price interaction with these zones to time entries and exits.
Key Features
Automated detection of Fair Value Gaps.
Customizable visual representation to match your chart preferences.
Enhances trading precision by identifying price inefficiencies.
Suitable for scalping, day trading, or swing trading strategies.
This script provides a powerful tool to highlight important price levels and inefficiencies in the market, enabling traders to make informed decisions. Whether you're using it as a standalone indicator or combining it with other tools, the 'FVG - Nibz' indicator is a valuable addition to any trader's toolkit!