The Candle Hunter Candlestick Pattern - by Karoshi TradingThe Candle Hunter Indicator - by Karoshi Trading
The Candle Hunter Indicator is based on specific Candlesticks and Patterns.
Activating this indicator will mark all specific Bullish & Bearish Candles on the Chart.
Depending on your settings, not all candles will be displayed on the chart.
The goal of this indicator is, to highlight all the important trending candles and ignore all ranging candles.
This can be helpful for rejecting/bouncing zones or S&R Levels. Or even if you like to trade reversals, you do not want to trade it on low volume ranging candles.
This indicator should only be used as a supplementary tool while trading, not as a stand alone.
Which Candles & Pattern will be marked on the chart?
1# Pinbar / Hammer (multiple Variations)
2# Marubozu Candles (multiple Variations)
3# Engulfing Candles (Multiple Variations)
How does this indicator works?
First of all, the indicator has to calculate 3 different parameters, before marking one of the given candle. To do so, we will need the average volume, average candle size and the specific candles.
1st Parameter: Defining the needed Candles
First of all, the indicator will calculate, based on the opening & closing price and also the wick (range of each candle). If one of the calculation is a match, for the mentioned candles above, we come to step 2.
2nd Parameter: Average Candle Size
The next one is the size of each candle, compared to the average candle on the chart.
You can customize the settings, but in this example, we want the specific candle be at least 1.5 times the size of the average last 14 candles.
3rd Parameter: Average Volume
The indicator will now calculate the average volume of the last selected candles period (default settings = 14) and compare it to the current candle. In this example, the current candle should be at least 1.5 times the average volume.
The indicator provides two possibilities to calculate the average volume:
1# Volume MA = Volume Moving Average
2# Volume SA = Volume Simple Average
Result: Colorizing the given Candle
After all parameters were met, the indicator will colorize and mark with a label + name all the candles on the chart.
Special Settings:
1st The Engulfing Candles, have 3 different options:
1# Classic = Only the body of the previous candle has to be engulfed by the current candle
2# Reinforced = The full candle + wick of the previous candle has to be engulfed
3# Multiple Candles = Minimum 3 previous candles has to be engulfed to be marked on the chart
The numbers of candles are changeable and you can have all 3 options simultaneously active.
That means, that the code will check all 3 options to see if there is a match.
2nd Marubozu Candle
You can set the ratio between body compared to wick in the settings. Depends if you want full marubozu candles or also the variations of it.
3rd Hammer Wick
You can decide how much bigger the wick should be, compared to the body of the candle. The default settings are set on 1.5 times.
You can also set the position of the body. As example if the settings are set on 30%, the body of the hammer should be on the upper half of a bullish hammer or the lower 30% of the candle if bearish.
Search in scripts for "Candlestick"

Oxy CandlestickOxymoronic (oxy) candlesticks often appear at significant levels in a chart and can indicate increased probabilities of directional moves.
Typically, green candles are hollow and red candles are filled. An oxymoronic candle is colored bullishly but filled bearishly (solid green) or vice versa (hollow red).
Oxy flags occur when:
1) Price gaps up and closes lower than the open but above the last close. A solid green (or black) candle is bearish.
2) Price gaps down and closes higher than the open but below the last close. A hollow red candle is bullish.
An oxy candle indicates one of three things:
1) Price is going up (bullish oxy)
2) Price is going down (bearish oxy)
3) Price will return to this level (either)
#1 and #2 are the default meaning. If those don't play out then look for #3.
As is the case with most indicators, it is best not to use this indicator in isolation, but to combine it with other forms of analysis to increase your probabilities and to identify significant levels.

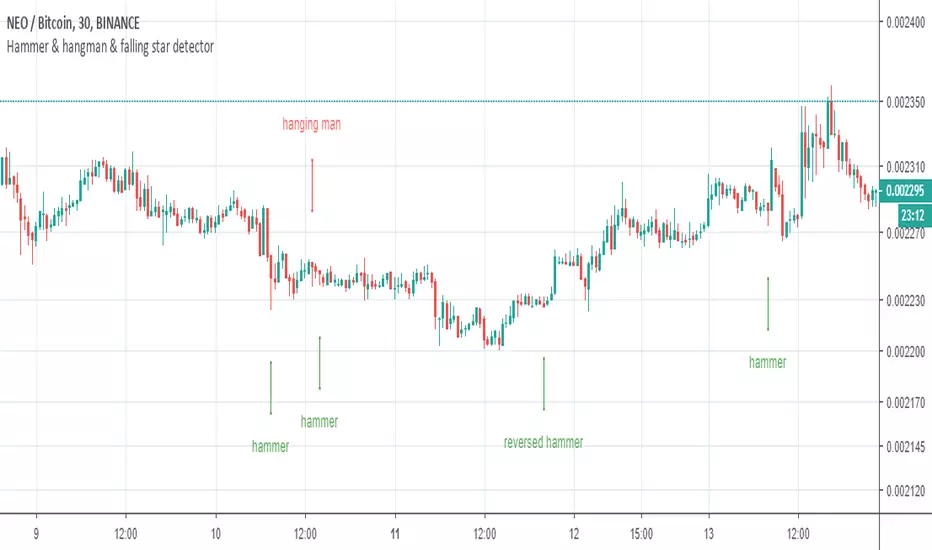
Hammer and Hanging Man candlesticks detectorSimple script to detect and mark possible reversal candlesticks - "hammer" and reversed version "hanging man".
hammer:
en.wikipedia.org(candlestick_pattern)
hanging man:
en.wikipedia.org(candlestick_pattern)
Engulfing CandlesticksThe Engulfing Candlesticks indicator is a powerful tool for traders and investors to identify potential reversal patterns in financial markets. This indicator is based on the popular candlestick pattern recognition technique, which has been used for centuries to predict market trends and identify trading opportunities.
The Engulfing Candlesticks indicator specifically looks for two types of patterns: Bullish Engulfing and Bearish Engulfing. A Bullish Engulfing pattern occurs when a small bearish candle is followed by a larger bullish candle that completely engulfs the previous candle, indicating a potential reversal from a downtrend to an uptrend. On the other hand, a Bearish Engulfing pattern occurs when a small bullish candle is followed by a larger bearish candle that completely engulfs the previous candle, indicating a potential reversal from an uptrend to a downtrend.
The Engulfing Candlesticks indicator is designed to be easy to use and understand, even for traders who are new to candlestick pattern recognition. The indicator plots a yellow color for Bullish Engulfing patterns and a purple color for Bearish Engulfing patterns, making it easy to visualize and identify potential trading opportunities.
One of the key benefits of the Engulfing Candlesticks indicator is its ability to identify potential reversal patterns early, allowing traders to enter trades at the beginning of a new trend. This can be especially useful in markets that are highly volatile or subject to sudden changes in direction.
In addition to its ability to identify reversal patterns, the Engulfing Candlesticks indicator can also be used as a confirmation tool for other trading strategies. For example, a trader who is using a moving average crossover strategy may use the Engulfing Candlesticks indicator to confirm the validity of the signal.
The Engulfing Candlesticks indicator is also highly customizable, allowing traders to adjust the sensitivity of the indicator to suit their individual trading style. This can be especially useful for traders who are looking to trade in specific market conditions, such as during times of high volatility or in markets with low liquidity.
Overall, the Engulfing Candlesticks indicator is a powerful tool for traders and investors who are looking to identify potential reversal patterns and trading opportunities in financial markets. Its ease of use, customization options, and ability to identify early reversal patterns make it a valuable addition to any trading strategy.
Here are the settings for the Engulfing Candlesticks indicator:
Length: This setting determines the number of bars used to calculate the engulfing pattern. A higher value will result in more precise signals, but may also reduce the number of signals generated.
Color 0: This setting determines the color used for Bullish Engulfing patterns.
Color 1: This setting determines the color used for Bearish Engulfing patterns.
Bar Color: This setting determines whether the indicator will color the bars based on the engulfing pattern.
Alerts: This setting determines whether the indicator will generate alerts when an engulfing pattern is detected.
Note: These settings may vary depending on the specific trading platform or software being used.

Custom Candlestick MarkingsThis indicator allows you to filter candlesticks based on their body (the real body) and wick lengths. Specifically, it marks candlesticks based on the following criteria:
For Bearish Candles:
1. The close price is lower than the open price (indicating a bearish candle).
2. The difference between the high and the maximum of open and close is less than or equal to the specified upper wick length.
3. The absolute difference between the close and open is greater than or equal to the specified body height.
For Bullish Candles:
1. The close price is higher than the open price (indicating a bullish candle).
2. The difference between the maximum of open and close and the low is less than or equal to the specified lower wick length.
3. The absolute difference between the close and open is greater than or equal to the specified body height.
These conditions are used to filter and mark candlesticks that meet the specified criteria, allowing you to visually identify them on the chart. This can be useful for technical analysis and identifying specific candlestick patterns or conditions based on body and wick lengths.
Certainly, this indicator can help in identifying trends more easily. Specifically, by applying certain criteria based on the length of candlestick bodies and wicks, it becomes easier to visually capture changes in market trends and specific patterns.
For instance, you can use this indicator to identify candlestick patterns that match specific body heights or wick lengths. This makes it easier to detect signs of trend reversals or trend changes, and it can assist in making trading decisions when combined with trendlines or support and resistance levels.
However, it's common to use this indicator in conjunction with other technical analysis tools and indicators. Confirming trends and pinpointing entry points often requires multiple sources of information and analysis. In investing and trading, thorough research and careful strategy are essential.

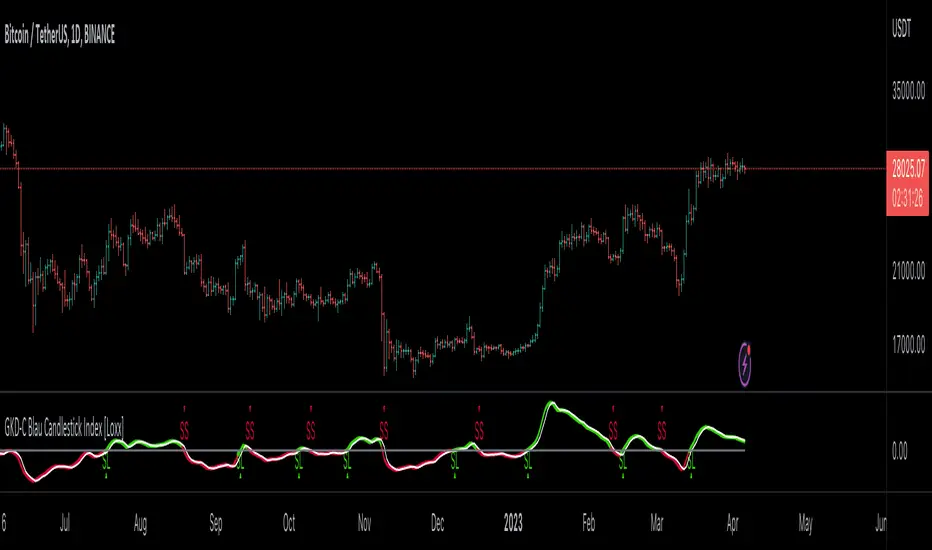
GKD-C Blau Candlestick Index [Loxx]Giga Kaleidoscope GKD-C Blau Candlestick Index is a Confirmation module included in Loxx's "Giga Kaleidoscope Modularized Trading System".
█ Giga Kaleidoscope Modularized Trading System
What is Loxx's "Giga Kaleidoscope Modularized Trading System"?
The Giga Kaleidoscope Modularized Trading System is a trading system built on the philosophy of the NNFX (No Nonsense Forex) algorithmic trading.
What is the NNFX algorithmic trading strategy?
The NNFX (No-Nonsense Forex) trading system is a comprehensive approach to Forex trading that is designed to simplify the process and remove the confusion and complexity that often surrounds trading. The system was developed by a Forex trader who goes by the pseudonym "VP" and has gained a significant following in the Forex community.
The NNFX trading system is based on a set of rules and guidelines that help traders make objective and informed decisions. These rules cover all aspects of trading, including market analysis, trade entry, stop loss placement, and trade management.
Here are the main components of the NNFX trading system:
1. Trading Philosophy: The NNFX trading system is based on the idea that successful trading requires a comprehensive understanding of the market, objective analysis, and strict risk management. The system aims to remove subjective elements from trading and focuses on objective rules and guidelines.
2. Technical Analysis: The NNFX trading system relies heavily on technical analysis and uses a range of indicators to identify high-probability trading opportunities. The system uses a combination of trend-following and mean-reverting strategies to identify trades.
3. Market Structure: The NNFX trading system emphasizes the importance of understanding the market structure, including price action, support and resistance levels, and market cycles. The system uses a range of tools to identify the market structure, including trend lines, channels, and moving averages.
4. Trade Entry: The NNFX trading system has strict rules for trade entry. The system uses a combination of technical indicators to identify high-probability trades, and traders must meet specific criteria to enter a trade.
5. Stop Loss Placement: The NNFX trading system places a significant emphasis on risk management and requires traders to place a stop loss order on every trade. The system uses a combination of technical analysis and market structure to determine the appropriate stop loss level.
6. Trade Management: The NNFX trading system has specific rules for managing open trades. The system aims to minimize risk and maximize profit by using a combination of trailing stops, take profit levels, and position sizing.
Overall, the NNFX trading system is designed to be a straightforward and easy-to-follow approach to Forex trading that can be applied by traders of all skill levels.
Core components of an NNFX algorithmic trading strategy
The NNFX algorithm is built on the principles of trend, momentum, and volatility. There are six core components in the NNFX trading algorithm:
1. Volatility - price volatility; e.g., Average True Range, True Range Double, Close-to-Close, etc.
2. Baseline - a moving average to identify price trend
3. Confirmation 1 - a technical indicator used to identify trends
4. Confirmation 2 - a technical indicator used to identify trends
5. Continuation - a technical indicator used to identify trends
6. Volatility/Volume - a technical indicator used to identify volatility/volume breakouts/breakdown
7. Exit - a technical indicator used to determine when a trend is exhausted
What is Volatility in the NNFX trading system?
In the NNFX (No Nonsense Forex) trading system, ATR (Average True Range) is typically used to measure the volatility of an asset. It is used as a part of the system to help determine the appropriate stop loss and take profit levels for a trade. ATR is calculated by taking the average of the true range values over a specified period.
True range is calculated as the maximum of the following values:
-Current high minus the current low
-Absolute value of the current high minus the previous close
-Absolute value of the current low minus the previous close
ATR is a dynamic indicator that changes with changes in volatility. As volatility increases, the value of ATR increases, and as volatility decreases, the value of ATR decreases. By using ATR in NNFX system, traders can adjust their stop loss and take profit levels according to the volatility of the asset being traded. This helps to ensure that the trade is given enough room to move, while also minimizing potential losses.
Other types of volatility include True Range Double (TRD), Close-to-Close, and Garman-Klass
What is a Baseline indicator?
The baseline is essentially a moving average, and is used to determine the overall direction of the market.
The baseline in the NNFX system is used to filter out trades that are not in line with the long-term trend of the market. The baseline is plotted on the chart along with other indicators, such as the Moving Average (MA), the Relative Strength Index (RSI), and the Average True Range (ATR).
Trades are only taken when the price is in the same direction as the baseline. For example, if the baseline is sloping upwards, only long trades are taken, and if the baseline is sloping downwards, only short trades are taken. This approach helps to ensure that trades are in line with the overall trend of the market, and reduces the risk of entering trades that are likely to fail.
By using a baseline in the NNFX system, traders can have a clear reference point for determining the overall trend of the market, and can make more informed trading decisions. The baseline helps to filter out noise and false signals, and ensures that trades are taken in the direction of the long-term trend.
What is a Confirmation indicator?
Confirmation indicators are technical indicators that are used to confirm the signals generated by primary indicators. Primary indicators are the core indicators used in the NNFX system, such as the Average True Range (ATR), the Moving Average (MA), and the Relative Strength Index (RSI).
The purpose of the confirmation indicators is to reduce false signals and improve the accuracy of the trading system. They are designed to confirm the signals generated by the primary indicators by providing additional information about the strength and direction of the trend.
Some examples of confirmation indicators that may be used in the NNFX system include the Bollinger Bands, the MACD (Moving Average Convergence Divergence), and the MACD Oscillator. These indicators can provide information about the volatility, momentum, and trend strength of the market, and can be used to confirm the signals generated by the primary indicators.
In the NNFX system, confirmation indicators are used in combination with primary indicators and other filters to create a trading system that is robust and reliable. By using multiple indicators to confirm trading signals, the system aims to reduce the risk of false signals and improve the overall profitability of the trades.
What is a Continuation indicator?
In the NNFX (No Nonsense Forex) trading system, a continuation indicator is a technical indicator that is used to confirm a current trend and predict that the trend is likely to continue in the same direction. A continuation indicator is typically used in conjunction with other indicators in the system, such as a baseline indicator, to provide a comprehensive trading strategy.
What is a Volatility/Volume indicator?
Volume indicators, such as the On Balance Volume (OBV), the Chaikin Money Flow (CMF), or the Volume Price Trend (VPT), are used to measure the amount of buying and selling activity in a market. They are based on the trading volume of the market, and can provide information about the strength of the trend. In the NNFX system, volume indicators are used to confirm trading signals generated by the Moving Average and the Relative Strength Index. Volatility indicators include Average Direction Index, Waddah Attar, and Volatility Ratio. In the NNFX trading system, volatility is a proxy for volume and vice versa.
By using volume indicators as confirmation tools, the NNFX trading system aims to reduce the risk of false signals and improve the overall profitability of trades. These indicators can provide additional information about the market that is not captured by the primary indicators, and can help traders to make more informed trading decisions. In addition, volume indicators can be used to identify potential changes in market trends and to confirm the strength of price movements.
What is an Exit indicator?
The exit indicator is used in conjunction with other indicators in the system, such as the Moving Average (MA), the Relative Strength Index (RSI), and the Average True Range (ATR), to provide a comprehensive trading strategy.
The exit indicator in the NNFX system can be any technical indicator that is deemed effective at identifying optimal exit points. Examples of exit indicators that are commonly used include the Parabolic SAR, the Average Directional Index (ADX), and the Chandelier Exit.
The purpose of the exit indicator is to identify when a trend is likely to reverse or when the market conditions have changed, signaling the need to exit a trade. By using an exit indicator, traders can manage their risk and prevent significant losses.
In the NNFX system, the exit indicator is used in conjunction with a stop loss and a take profit order to maximize profits and minimize losses. The stop loss order is used to limit the amount of loss that can be incurred if the trade goes against the trader, while the take profit order is used to lock in profits when the trade is moving in the trader's favor.
Overall, the use of an exit indicator in the NNFX trading system is an important component of a comprehensive trading strategy. It allows traders to manage their risk effectively and improve the profitability of their trades by exiting at the right time.
How does Loxx's GKD (Giga Kaleidoscope Modularized Trading System) implement the NNFX algorithm outlined above?
Loxx's GKD v1.0 system has five types of modules (indicators/strategies). These modules are:
1. GKD-BT - Backtesting module (Volatility, Number 1 in the NNFX algorithm)
2. GKD-B - Baseline module (Baseline and Volatility/Volume, Numbers 1 and 2 in the NNFX algorithm)
3. GKD-C - Confirmation 1/2 and Continuation module (Confirmation 1/2 and Continuation, Numbers 3, 4, and 5 in the NNFX algorithm)
4. GKD-V - Volatility/Volume module (Confirmation 1/2, Number 6 in the NNFX algorithm)
5. GKD-E - Exit module (Exit, Number 7 in the NNFX algorithm)
(additional module types will added in future releases)
Each module interacts with every module by passing data between modules. Data is passed between each module as described below:
GKD-B => GKD-V => GKD-C(1) => GKD-C(2) => GKD-C(Continuation) => GKD-E => GKD-BT
That is, the Baseline indicator passes its data to Volatility/Volume. The Volatility/Volume indicator passes its values to the Confirmation 1 indicator. The Confirmation 1 indicator passes its values to the Confirmation 2 indicator. The Confirmation 2 indicator passes its values to the Continuation indicator. The Continuation indicator passes its values to the Exit indicator, and finally, the Exit indicator passes its values to the Backtest strategy.
This chaining of indicators requires that each module conform to Loxx's GKD protocol, therefore allowing for the testing of every possible combination of technical indicators that make up the six components of the NNFX algorithm.
What does the application of the GKD trading system look like?
Example trading system:
Backtest: Strategy with 1-3 take profits, trailing stop loss, multiple types of PnL volatility, and 2 backtesting styles
Baseline: Hull Moving Average
Volatility/Volume: Hurst Exponent
Confirmation 1: Blau Candlestick Index as shown on the chart above
Confirmation 2: Williams Percent Range
Continuation: Fisher Transform
Exit: Rex Oscillator
Each GKD indicator is denoted with a module identifier of either: GKD-BT, GKD-B, GKD-C, GKD-V, or GKD-E. This allows traders to understand to which module each indicator belongs and where each indicator fits into the GKD protocol chain.
Giga Kaleidoscope Modularized Trading System Signals (based on the NNFX algorithm)
Standard Entry
1. GKD-C Confirmation 1 Signal
2. GKD-B Baseline agrees
3. Price is within a range of 0.2x Volatility and 1.0x Volatility of the Goldie Locks Mean
4. GKD-C Confirmation 2 agrees
5. GKD-V Volatility/Volume agrees
Baseline Entry
1. GKD-B Baseline signal
2. GKD-C Confirmation 1 agrees
3. Price is within a range of 0.2x Volatility and 1.0x Volatility of the Goldie Locks Mean
4. GKD-C Confirmation 2 agrees
5. GKD-V Volatility/Volume agrees
6. GKD-C Confirmation 1 signal was less than 7 candles prior
Continuation Entry
1. Standard Entry, Baseline Entry, or Pullback; entry triggered previously
2. GKD-B Baseline hasn't crossed since entry signal trigger
3. GKD-C Confirmation Continuation Indicator signals
4. GKD-C Confirmation 1 agrees
5. GKD-B Baseline agrees
6. GKD-C Confirmation 2 agrees
1-Candle Rule Standard Entry
1. GKD-C Confirmation 1 signal
2. GKD-B Baseline agrees
3. Price is within a range of 0.2x Volatility and 1.0x Volatility of the Goldie Locks Mean
Next Candle:
1. Price retraced (Long: close < close or Short: close > close )
2. GKD-B Baseline agrees
3. GKD-C Confirmation 1 agrees
4. GKD-C Confirmation 2 agrees
5. GKD-V Volatility/Volume agrees
1-Candle Rule Baseline Entry
1. GKD-B Baseline signal
2. GKD-C Confirmation 1 agrees
3. Price is within a range of 0.2x Volatility and 1.0x Volatility of the Goldie Locks Mean
4. GKD-C Confirmation 1 signal was less than 7 candles prior
Next Candle:
1. Price retraced (Long: close < close or Short: close > close )
2. GKD-B Baseline agrees
3. GKD-C Confirmation 1 agrees
4. GKD-C Confirmation 2 agrees
5. GKD-V Volatility/Volume Agrees
PullBack Entry
1. GKD-B Baseline signal
2. GKD-C Confirmation 1 agrees
3. Price is beyond 1.0x Volatility of Baseline
Next Candle:
1. Price is within a range of 0.2x Volatility and 1.0x Volatility of the Goldie Locks Mean
3. GKD-C Confirmation 1 agrees
4. GKD-C Confirmation 2 agrees
5. GKD-V Volatility/Volume Agrees
█ GKD-C Blau Candlestick Index
What is Blau Candlestick Index?
The Blau Candlestick Index (CSI) is a technical analysis indicator developed by William Blau and described in his book “Momentum, Direction, and Divergence: Applying the Latest Momentum Indicators for Technical Analysis”. It is based on the Candlestick Momentum Indicator, which measures the difference between the current close price and the open price of a certain number of bars ago. The values of the CSI are normalized by the price range and mapped into the interval ³.
The CSI is calculated using the following formula:
CSI(price1,price2,q,r,s,u) = 100 * CMtm(price1,price2,q,r,s,u) / EMA(EMA(EMA(HH(q)-LL(q),r),s),u)
where:
- price1: close price
- price2: open price q bars ago
- q: number of bars used in calculation of Candlestick Momentum
- cmtm(price1,price2,q): Candlestick Momentum
- CMtm(price1,price2,q,r,s,u): Triple smoothed Candlestick Momentum
- LL(q): lowest price of the q bars
- HH(q): highest price of the q bars
- EMA(...,r): first smoothing - exponentially smoothed moving average with period r, applied to Candlestick Momentum and q-period Price Range
- EMA(EMA(...,r),s): second smoothing - EMA of period s, applied to result of the first smoothing
- EMA(EMA(EMA(...,r),s),u): third smoothing - EMA of period u, applied to result of the second smoothing ³.
The input parameters for this indicator are:
- q: number of bars used in calculation of Candlestick Momentum (default value is 1)
- r: period of the first EMA applied to Candlestick Momentum (default value is 20)
- s: period of the second EMA applied to result of the first smoothing (default value is 5)
- u: period of the third EMA applied to result of the second smoothing (default value is 3)
- AppliedPrice1: price type (default value is PRICE_CLOSE)
- AppliedPrice2: price type (default value is PRICE_OPEN) ³.
(1) Candlestick Index Blau_CSI - indicator for MetaTrader 5 - MQL5. www.mql5.com Accessed 4/6/2023.
(2) The Blau Candlestick Index trading indicator for MT5. www.fxtradingrevolution.com Accessed 4/6/2023.
(3) True Strength Index (TSI) - StockCharts.com. school.stockcharts.com Accessed 4/6/2023.
Requirements
Inputs
Confirmation 1 and Solo Confirmation: GKD-V Volatility / Volume indicator
Confirmation 2: GKD-C Confirmation indicator
Outputs
Confirmation 2 and Solo Confirmation Complex: GKD-E Exit indicator
Confirmation 1: GKD-C Confirmation indicator
Continuation: GKD-E Exit indicator
Solo Confirmation Simple: GKD-BT Backtest strategy
Additional features will be added in future releases.
GKD-C Blau Candlestick Momentum Index [Loxx]Giga Kaleidoscope GKD-C Blau Candlestick Momentum Index is a Confirmation module included in Loxx's "Giga Kaleidoscope Modularized Trading System".
█ Giga Kaleidoscope Modularized Trading System
What is Loxx's "Giga Kaleidoscope Modularized Trading System"?
The Giga Kaleidoscope Modularized Trading System is a trading system built on the philosophy of the NNFX (No Nonsense Forex) algorithmic trading.
What is the NNFX algorithmic trading strategy?
The NNFX (No-Nonsense Forex) trading system is a comprehensive approach to Forex trading that is designed to simplify the process and remove the confusion and complexity that often surrounds trading. The system was developed by a Forex trader who goes by the pseudonym "VP" and has gained a significant following in the Forex community.
The NNFX trading system is based on a set of rules and guidelines that help traders make objective and informed decisions. These rules cover all aspects of trading, including market analysis, trade entry, stop loss placement, and trade management.
Here are the main components of the NNFX trading system:
1. Trading Philosophy: The NNFX trading system is based on the idea that successful trading requires a comprehensive understanding of the market, objective analysis, and strict risk management. The system aims to remove subjective elements from trading and focuses on objective rules and guidelines.
2. Technical Analysis: The NNFX trading system relies heavily on technical analysis and uses a range of indicators to identify high-probability trading opportunities. The system uses a combination of trend-following and mean-reverting strategies to identify trades.
3. Market Structure: The NNFX trading system emphasizes the importance of understanding the market structure, including price action, support and resistance levels, and market cycles. The system uses a range of tools to identify the market structure, including trend lines, channels, and moving averages.
4. Trade Entry: The NNFX trading system has strict rules for trade entry. The system uses a combination of technical indicators to identify high-probability trades, and traders must meet specific criteria to enter a trade.
5. Stop Loss Placement: The NNFX trading system places a significant emphasis on risk management and requires traders to place a stop loss order on every trade. The system uses a combination of technical analysis and market structure to determine the appropriate stop loss level.
6. Trade Management: The NNFX trading system has specific rules for managing open trades. The system aims to minimize risk and maximize profit by using a combination of trailing stops, take profit levels, and position sizing.
Overall, the NNFX trading system is designed to be a straightforward and easy-to-follow approach to Forex trading that can be applied by traders of all skill levels.
Core components of an NNFX algorithmic trading strategy
The NNFX algorithm is built on the principles of trend, momentum, and volatility. There are six core components in the NNFX trading algorithm:
1. Volatility - price volatility; e.g., Average True Range, True Range Double, Close-to-Close, etc.
2. Baseline - a moving average to identify price trend
3. Confirmation 1 - a technical indicator used to identify trends
4. Confirmation 2 - a technical indicator used to identify trends
5. Continuation - a technical indicator used to identify trends
6. Volatility/Volume - a technical indicator used to identify volatility/volume breakouts/breakdown
7. Exit - a technical indicator used to determine when a trend is exhausted
What is Volatility in the NNFX trading system?
In the NNFX (No Nonsense Forex) trading system, ATR (Average True Range) is typically used to measure the volatility of an asset. It is used as a part of the system to help determine the appropriate stop loss and take profit levels for a trade. ATR is calculated by taking the average of the true range values over a specified period.
True range is calculated as the maximum of the following values:
-Current high minus the current low
-Absolute value of the current high minus the previous close
-Absolute value of the current low minus the previous close
ATR is a dynamic indicator that changes with changes in volatility. As volatility increases, the value of ATR increases, and as volatility decreases, the value of ATR decreases. By using ATR in NNFX system, traders can adjust their stop loss and take profit levels according to the volatility of the asset being traded. This helps to ensure that the trade is given enough room to move, while also minimizing potential losses.
Other types of volatility include True Range Double (TRD), Close-to-Close, and Garman-Klass
What is a Baseline indicator?
The baseline is essentially a moving average, and is used to determine the overall direction of the market.
The baseline in the NNFX system is used to filter out trades that are not in line with the long-term trend of the market. The baseline is plotted on the chart along with other indicators, such as the Moving Average (MA), the Relative Strength Index (RSI), and the Average True Range (ATR).
Trades are only taken when the price is in the same direction as the baseline. For example, if the baseline is sloping upwards, only long trades are taken, and if the baseline is sloping downwards, only short trades are taken. This approach helps to ensure that trades are in line with the overall trend of the market, and reduces the risk of entering trades that are likely to fail.
By using a baseline in the NNFX system, traders can have a clear reference point for determining the overall trend of the market, and can make more informed trading decisions. The baseline helps to filter out noise and false signals, and ensures that trades are taken in the direction of the long-term trend.
What is a Confirmation indicator?
Confirmation indicators are technical indicators that are used to confirm the signals generated by primary indicators. Primary indicators are the core indicators used in the NNFX system, such as the Average True Range (ATR), the Moving Average (MA), and the Relative Strength Index (RSI).
The purpose of the confirmation indicators is to reduce false signals and improve the accuracy of the trading system. They are designed to confirm the signals generated by the primary indicators by providing additional information about the strength and direction of the trend.
Some examples of confirmation indicators that may be used in the NNFX system include the Bollinger Bands, the MACD (Moving Average Convergence Divergence), and the MACD Oscillator. These indicators can provide information about the volatility, momentum, and trend strength of the market, and can be used to confirm the signals generated by the primary indicators.
In the NNFX system, confirmation indicators are used in combination with primary indicators and other filters to create a trading system that is robust and reliable. By using multiple indicators to confirm trading signals, the system aims to reduce the risk of false signals and improve the overall profitability of the trades.
What is a Continuation indicator?
In the NNFX (No Nonsense Forex) trading system, a continuation indicator is a technical indicator that is used to confirm a current trend and predict that the trend is likely to continue in the same direction. A continuation indicator is typically used in conjunction with other indicators in the system, such as a baseline indicator, to provide a comprehensive trading strategy.
What is a Volatility/Volume indicator?
Volume indicators, such as the On Balance Volume (OBV), the Chaikin Money Flow (CMF), or the Volume Price Trend (VPT), are used to measure the amount of buying and selling activity in a market. They are based on the trading volume of the market, and can provide information about the strength of the trend. In the NNFX system, volume indicators are used to confirm trading signals generated by the Moving Average and the Relative Strength Index. Volatility indicators include Average Direction Index, Waddah Attar, and Volatility Ratio. In the NNFX trading system, volatility is a proxy for volume and vice versa.
By using volume indicators as confirmation tools, the NNFX trading system aims to reduce the risk of false signals and improve the overall profitability of trades. These indicators can provide additional information about the market that is not captured by the primary indicators, and can help traders to make more informed trading decisions. In addition, volume indicators can be used to identify potential changes in market trends and to confirm the strength of price movements.
What is an Exit indicator?
The exit indicator is used in conjunction with other indicators in the system, such as the Moving Average (MA), the Relative Strength Index (RSI), and the Average True Range (ATR), to provide a comprehensive trading strategy.
The exit indicator in the NNFX system can be any technical indicator that is deemed effective at identifying optimal exit points. Examples of exit indicators that are commonly used include the Parabolic SAR, the Average Directional Index (ADX), and the Chandelier Exit.
The purpose of the exit indicator is to identify when a trend is likely to reverse or when the market conditions have changed, signaling the need to exit a trade. By using an exit indicator, traders can manage their risk and prevent significant losses.
In the NNFX system, the exit indicator is used in conjunction with a stop loss and a take profit order to maximize profits and minimize losses. The stop loss order is used to limit the amount of loss that can be incurred if the trade goes against the trader, while the take profit order is used to lock in profits when the trade is moving in the trader's favor.
Overall, the use of an exit indicator in the NNFX trading system is an important component of a comprehensive trading strategy. It allows traders to manage their risk effectively and improve the profitability of their trades by exiting at the right time.
How does Loxx's GKD (Giga Kaleidoscope Modularized Trading System) implement the NNFX algorithm outlined above?
Loxx's GKD v1.0 system has five types of modules (indicators/strategies). These modules are:
1. GKD-BT - Backtesting module (Volatility, Number 1 in the NNFX algorithm)
2. GKD-B - Baseline module (Baseline and Volatility/Volume, Numbers 1 and 2 in the NNFX algorithm)
3. GKD-C - Confirmation 1/2 and Continuation module (Confirmation 1/2 and Continuation, Numbers 3, 4, and 5 in the NNFX algorithm)
4. GKD-V - Volatility/Volume module (Confirmation 1/2, Number 6 in the NNFX algorithm)
5. GKD-E - Exit module (Exit, Number 7 in the NNFX algorithm)
(additional module types will added in future releases)
Each module interacts with every module by passing data between modules. Data is passed between each module as described below:
GKD-B => GKD-V => GKD-C(1) => GKD-C(2) => GKD-C(Continuation) => GKD-E => GKD-BT
That is, the Baseline indicator passes its data to Volatility/Volume. The Volatility/Volume indicator passes its values to the Confirmation 1 indicator. The Confirmation 1 indicator passes its values to the Confirmation 2 indicator. The Confirmation 2 indicator passes its values to the Continuation indicator. The Continuation indicator passes its values to the Exit indicator, and finally, the Exit indicator passes its values to the Backtest strategy.
This chaining of indicators requires that each module conform to Loxx's GKD protocol, therefore allowing for the testing of every possible combination of technical indicators that make up the six components of the NNFX algorithm.
What does the application of the GKD trading system look like?
Example trading system:
Backtest: Strategy with 1-3 take profits, trailing stop loss, multiple types of PnL volatility, and 2 backtesting styles
Baseline: Hull Moving Average
Volatility/Volume: Hurst Exponent
Confirmation 1: Blau Candlestick Momentum Index as shown on the chart above
Confirmation 2: Williams Percent Range
Continuation: Fisher Transform
Exit: Rex Oscillator
Each GKD indicator is denoted with a module identifier of either: GKD-BT, GKD-B, GKD-C, GKD-V, or GKD-E. This allows traders to understand to which module each indicator belongs and where each indicator fits into the GKD protocol chain.
Giga Kaleidoscope Modularized Trading System Signals (based on the NNFX algorithm)
Standard Entry
1. GKD-C Confirmation 1 Signal
2. GKD-B Baseline agrees
3. Price is within a range of 0.2x Volatility and 1.0x Volatility of the Goldie Locks Mean
4. GKD-C Confirmation 2 agrees
5. GKD-V Volatility/Volume agrees
Baseline Entry
1. GKD-B Baseline signal
2. GKD-C Confirmation 1 agrees
3. Price is within a range of 0.2x Volatility and 1.0x Volatility of the Goldie Locks Mean
4. GKD-C Confirmation 2 agrees
5. GKD-V Volatility/Volume agrees
6. GKD-C Confirmation 1 signal was less than 7 candles prior
Continuation Entry
1. Standard Entry, Baseline Entry, or Pullback; entry triggered previously
2. GKD-B Baseline hasn't crossed since entry signal trigger
3. GKD-C Confirmation Continuation Indicator signals
4. GKD-C Confirmation 1 agrees
5. GKD-B Baseline agrees
6. GKD-C Confirmation 2 agrees
1-Candle Rule Standard Entry
1. GKD-C Confirmation 1 signal
2. GKD-B Baseline agrees
3. Price is within a range of 0.2x Volatility and 1.0x Volatility of the Goldie Locks Mean
Next Candle:
1. Price retraced (Long: close < close or Short: close > close )
2. GKD-B Baseline agrees
3. GKD-C Confirmation 1 agrees
4. GKD-C Confirmation 2 agrees
5. GKD-V Volatility/Volume agrees
1-Candle Rule Baseline Entry
1. GKD-B Baseline signal
2. GKD-C Confirmation 1 agrees
3. Price is within a range of 0.2x Volatility and 1.0x Volatility of the Goldie Locks Mean
4. GKD-C Confirmation 1 signal was less than 7 candles prior
Next Candle:
1. Price retraced (Long: close < close or Short: close > close )
2. GKD-B Baseline agrees
3. GKD-C Confirmation 1 agrees
4. GKD-C Confirmation 2 agrees
5. GKD-V Volatility/Volume Agrees
PullBack Entry
1. GKD-B Baseline signal
2. GKD-C Confirmation 1 agrees
3. Price is beyond 1.0x Volatility of Baseline
Next Candle:
1. Price is within a range of 0.2x Volatility and 1.0x Volatility of the Goldie Locks Mean
3. GKD-C Confirmation 1 agrees
4. GKD-C Confirmation 2 agrees
5. GKD-V Volatility/Volume Agrees
█ GKD-C Blau Candlestick Momentum Index
What is Blau Candlestick Momentum Index?
The Blau Candlestick Momentum Index (CMI) is a technical analysis indicator developed by William Blau and described in his book “Momentum, Direction, and Divergence: Applying the Latest Momentum Indicators for Technical Analysis”. It is based on the Candlestick Momentum Indicator, which measures the difference between the current close price and the open price of a certain number of bars ago. The values of the CMI are normalized by the price range and mapped into the interval.
The CMI is calculated using the following formula:
CMI(price1,price2,q,r,s,u) = 100 * CMtm(price1,price2,q,r,s,u) / EMA(EMA(EMA(|cmtm(price1,price2,q)|,r),s),u)
where:
- price1: close price
- price2: open price q bars ago
- q: number of bars used in calculation of Candlestick Momentum
- cmtm(price1,price2,q): Candlestick Momentum
- CMtm(price1,price2,q,r,s,u): Triple smoothed Candlestick Momentum
- EMA(...,r): first smoothing - exponentially smoothed moving average with period r, applied to Candlestick Momentum and absolute value of Candlestick Momentum
- EMA(EMA(...,r),s): second smoothing - EMA of period s, applied to result of the first smoothing
- EMA(EMA(EMA(...,r),s),u): third smoothing - EMA of period u, applied to result of the second smoothing ³.
The input parameters for this indicator are:
- q: number of bars used in calculation of Candlestick Momentum (default value is 1)
- r: period of the first EMA applied to Candlestick Momentum (default value is 20)
- s: period of the second EMA applied to result of the first smoothing (default value is 5)
- u: period of the third EMA applied to result of the second smoothing (default value is 3)
- AppliedPrice1: price type (default value is PRICE_CLOSE)
- AppliedPrice2: price type (default value is PRICE_OPEN) ³.
(2) www.mql5.com ]Candlestick Momentum Index Blau_CMI - indicator for MetaTrader 5 - MQL5. Accessed 4/6/2023.
(3) True Strength Index (TSI) - StockCharts.com. school.stockcharts.com Accessed 4/6/2023.
(4) Candlestick Momentum Index Blau_CMI – indicator for MetaTrader 5. www.forexmt4indicators.com Accessed 4/6/2023.
(5) Candlestick Index Blau_CSI – indicator for MetaTrader 5. Accessed 4/6/2023.
Requirements
Inputs
Confirmation 1 and Solo Confirmation: GKD-V Volatility / Volume indicator
Confirmation 2: GKD-C Confirmation indicator
Outputs
Confirmation 2 and Solo Confirmation Complex: GKD-E Exit indicator
Confirmation 1: GKD-C Confirmation indicator
Continuation: GKD-E Exit indicator
Solo Confirmation Simple: GKD-BT Backtest strategy
Additional features will be added in future releases.

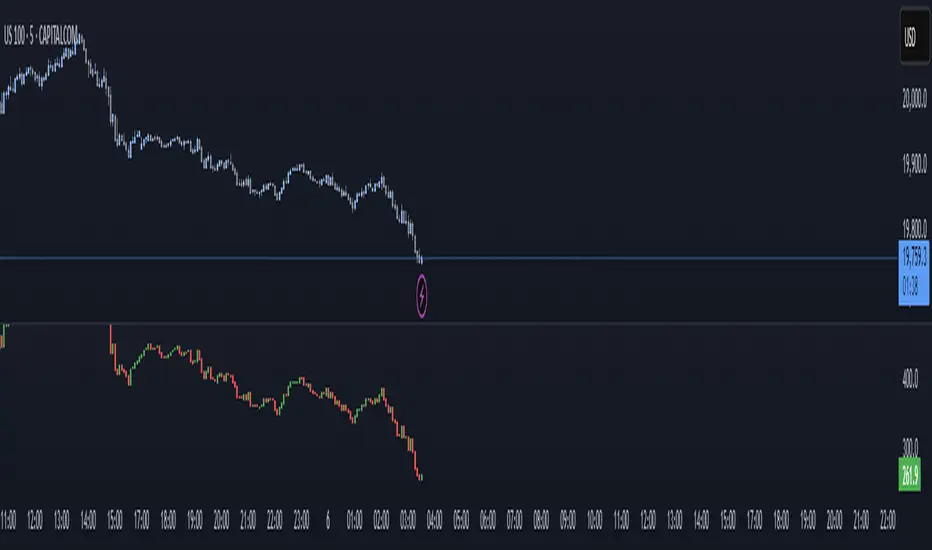
CVD Candlestick - Milana TradesThe CVD Candlestick indicator visualizes Cumulative Volume Delta (CVD) in the form of candlesticks, providing a deeper insight into intrabar buying and selling pressure.
Instead of plotting CVD as a simple line, this indicator displays it as a candle chart, allowing traders to analyze the momentum of volume delta just like price action.
How it Works
Delta is calculated as the difference between the bar’s close and open: delta = close - open.
Divergence + ICT-Based Confirmation
This indicator can be used effectively to detect CVD-price divergences, which may signal early signs of weakness in the current trend. When integrated with ICT (Inner Circle Trader) concepts, it becomes a powerful tool for precision-based trading setups.
CVD Divergence Logic:
A bearish divergence occurs when price makes a higher high while CVD makes a lower high — suggesting weakening buyer aggression.
A bullish divergence occurs when price makes a lower low while CVD makes a higher low — signaling potential seller exhaustion.
ICT Confirmation Methods:
After identifying divergence on CVD, traders may look for confirmation using ICT techniques, such as:
1) Liquidity sweeps (e.g. price takes out a prior high/low into a divergence zone)
2) Breaker blocks or order blocks aligning with the divergence area
3) Market structure shifts following divergence
4) Optimal Trade Entry (OTE) levels confluencing with CVD-based signals
Example Setup:
Identify divergence between price and CVD.
Wait for liquidity sweep or market structure break in the same zone.
Confirm entry with lower time frame precision, if needed.
Data Candle
CVD is computed as the cumulative sum of delta over time.
For each bar, a synthetic candlestick is generated based on:
CVD Open = previous CVD value
CVD Close = current CVD value
High/Low = relative range based on Open/Close
Candlestick color indicates whether buyers (green) or sellers (red) dominated the bar.
Note : This implementation uses price-based delta for simplicity and works universally across assets. For bid/ask-based delta, a feed with order book data is required, which is not accessible in Pine Script.
Use Cases
Identify divergences between price and volume delta
Confirm or question breakouts and trend strength
Use in combination with VWAP, volume profile, or liquidity zones
Analyze intrabar sentiment in a candlestick format
Features
CVD represented as full candlesticks
Clear color distinction for delta direction
Works on all symbols and timeframes
Lightweight and responsive
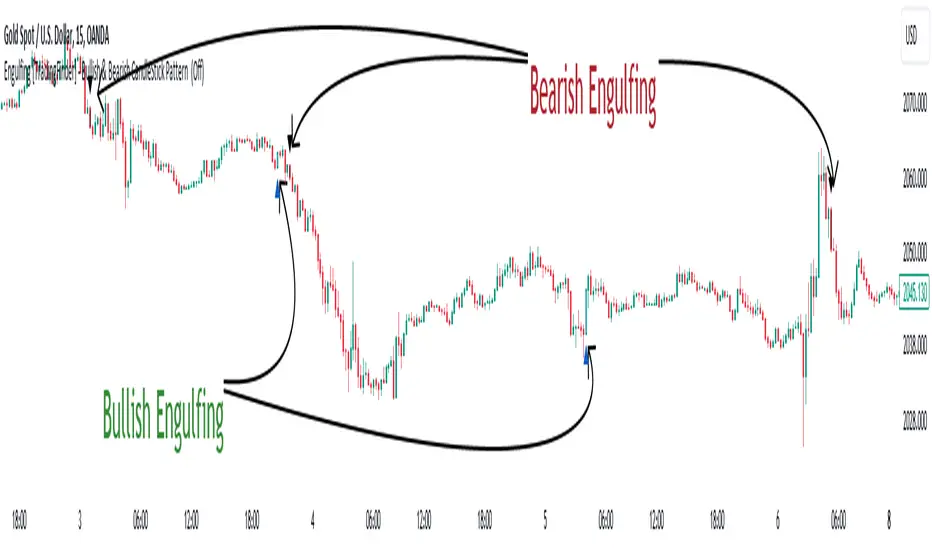
Engulfing [TradingFinder] Bullish & Bearish CandleStick Pattern🔵 Introduction
The candlestick engulfing pattern is important pattern in technical analysis that can be observed in candlestick charts. This pattern occurs when a complete candle engulfs or "engulfs" the body of a previous candle, meaning that the body of the new candle completely covers the body of the previous candle.
The candlestick engulfing pattern has two types: the bullish engulfing pattern and the bearish engulfing pattern.
• Bullish Engulfing Pattern: This pattern occurs when a market candle opens with a larger and higher body than the previous market candle and completely covers the body of the previous candle. This pattern may indicate the presence of strong buying pressure and a potential change in price direction upwards.
• Bearish Engulfing Pattern: This pattern occurs when a market candle opens with a larger and lower body than the previous market candle and completely covers the body of the previous candle. This pattern may indicate the presence of strong selling pressure and a potential change in price direction downwards.
The candlestick engulfing pattern is usually used as a valid signal for a change in price direction in the market and can enhance a combination of crossover investments and technical analysis. However, it should always be evaluated alongside other indicators and market factors, and counter decisions should be made accordingly.
🔵 Recognition Method
Correct, the candlestick engulfing pattern is one of the important patterns in technical analysis that is typically used as a strong signal for a valid change in price direction in the market. This pattern occurs when a candle (usually in the market) opens with a larger and higher (for bullish engulfing pattern) or lower (for bearish engulfing pattern) body than a previous market candle and completely covers the body of the previous candle.
Example of Bullish Engulfing Pattern:
• First Candle: A bearish (downward) candle with a small red body.
• Second Candle: A bullish (upward) candle with a larger body that completely covers the body of the previous candle.
This pattern may indicate a change in price direction from downward to upward.
Example of Bearish Engulfing Pattern:
• First Candle: A bullish (upward) candle with a small green body.
• Second Candle: A bearish (downward) candle with a larger body that completely covers the body of the previous candle.
This pattern may indicate a change in price direction from upward to downward.
The most important point is that the candlestick engulfing pattern should be carefully considered and always evaluated alongside other market indicators and overall conditions. For example, the engulfing pattern near important support or resistance levels, during significant market command changes, or accompanied by other technical signals can have greater signaling power.
🟣 "Bullish Engulfing" Candle
• The first candle is bullish and the second candle is bearish.
• At the end of a downtrend.
• The closing of the first candle is above the opening of the second candle.
• The high of the first candle is higher than the high of the second candle.
Optimal Condition:
• The closing of the first candle is higher than the high of the second candle.
• More than 80% of the first candle is bullish.
🟣 "Bearish Engulfing" Candle
• The first candle is bearish and the second candle is bullish.
• At the end of an uptrend.
• The closing of the first candle is below the opening of the second candle.
• The low of the first candle is lower than the low of the second candle.
Optimal Condition:
• The closing of the first candle is below the opening of the second candle.
• More than 80% of the first candle is bearish.
🔵 Settings
The "Engulf Filter" option allows the "Optimal Condition" to be executed and will show fewer candlesticks.
🔵 Status
Off: Default mode, showing more identifications.
• Green color indicates optimal "Bullish Engulfing" candles.
• Red color indicates optimal "Bearish Engulfing" candles.
On: By changing the default to "On," the number of identifications decreases and the optimal condition is applied.
• Blue color indicates "Bullish Engulfing" candles.
• Black color indicates "Bearish Engulfing" candles.
🟣 Important Note
"Engulfing" candles are very useful signals in the direction of the overall trend, but we do not expect a suitable movement from "Engulfing" candles against the trend.
Crypto Candlestick Patterns - CN VersionIntroduction:
The candlestick chart has been used for centuries since the Japanese applications. Based on the candlestick charting, people developed candle pattern analysis. Now we have tons of books or articles illustrating the usage of reversal patterns and continuation patterns, and computers provide a faster and preciser way to recognize these pattern.
Originally we have a common *All Candlestick Patterns* indicator to use. This indicator works well for most of the markets or commodities including stocks and futures. However, for cryptocurrency market, quite a few patterns are not suitable anymore. For example, crypto markets are continuously running 7x24hrs and the big coins with good volume tend to have almost continuous price in commonly used time periods. Hence, original patterns with "window" or "jump" concepts are usually not applied to crypto.
For these issues, I modified the original *All Candlestick Patterns* indicator and introduced the Chinese version for people speaking such language.
Like most of the other indicators, I personally do not recommend anyone to simply follow the patterns it shows to enter the market. You may take these recognized patterns as a reference, and further actions on trading should be done with several other tools, such as MACD, RSI, Stochastic and etc.
Usage:
The application of this indicator is basically the same as the original *All Candlestick Patterns* and you will get an automatically generated pattern recognition by your computer system.
There are a few parameters to adjust for the indicator:
Trending Detection Settings: Here you can choose SMA-Fast, SMA-Fast/Slow or None detecting options to recognize the current market trend. This is a minor improvement from the original indicator and you can choose your preferred trending detecting settings by changing the length of SMA.
Candlestick Settings: You may adjust the rules to recognize the properties of candlesticks. I add a "perturbation" parameter here, which actually is an error tolerance for pattern recognition. Some seemingly pattern may not fulfill the strict rules of classic candlestick patterns, but we may recognize them by watch the charting on our own. Hence this error tolerance may show more potential patterns from the charting.
Plot Settings: It is the usually colour choice and providing options for bullish/bearish.
Pattern Settings: Here you can select the patterns that you would like to see from the charting. You can pick the preferred reversal patterns or choose to show all the patterns. It's all up to you!
Features:
Language Translation: Since this is a Chinese language version. I have replaced all the English explanation of patterns to Chinese ones. Move your mouse to the label, you will find a brief intro of the pattern and a notice about bullish or bearish signals it indicates.
Alerts: As the same as the original one, we will have the alert options from this indicator. All the alerts and their messages are Chinese. You can activate alerts based on this indicator from the alert management section, as the same as many other indicators you have used before.
Future Improvements:
For now I am satisfied with the work I have done, and I may apply it to several charts. It's welcome for any users to take a look at the codes and put modifications or improvements towards it. Currently most of the comments in the code are in Chinese language, since basically it's for Chinese speaking users, while the code itself and the parameter names should be pretty easy to understand in English. (I have been using English for writing in the past 8 years, hence this introduction is in English as well.)

Pure Morning 2.0 - Candlestick Pattern Doji StrategyThe new "Pure Morning 2.0 - Candlestick Pattern Doji Strategy" is a trend-following, intraday cryptocurrency trading system authored by devil_machine.
The system identifies Doji and Morning Doji Star candlestick formations above the EMA60 as entry points for long trades.
For best results we recommend to use on 15-minute, 30-minute, or 1-hour timeframes, and are ideal for high-volatility markets.
The strategy also utilizes a profit target or trailing stop for exits, with stop loss set at the lowest low of the last 100 candles. The strategy's configuration details, such as Doji tolerance, and exit configurations are adjustable.
In this new version 2.0, we've incorporated a new selectable filter. Since the stop loss is set at the lowest low, this filter ensures that this value isn't too far from the entry price, thereby optimizing the Risk-Reward ratio.
In the specific case of ALPINE, a 9% Take-Profit and and Stop-Loss at Lowest Low of the last 100 candles were set, with an activated trailing-stop percentage, Max Loss Filter is not active.
Name : Pure Morning 2.0 - Candlestick Pattern Doji Strategy
Author : @devil_machine
Category : Trend Follower based on candlestick patterns.
Operating mode : Spot or Futures (only long).
Trades duration : Intraday
Timeframe : 15m, 30m, 1H
Market : Crypto
Suggested usage : Short-term trading, when the market is in trend and it is showing high volatility .
Entry : When a Doji or Morning Doji Star formation occurs above the EMA60.
Exit : Profit target or Trailing stop, Stop loss on the lowest low of the last 100 candles.
Configuration :
- Doji Settings (tolerances) for Entry Condition
- Max Loss Filter (Lowest Low filter)
- Exit Long configuration
- Trailing stop
Backtesting :
⁃ Exchange: BINANCE
⁃ Pair: ALPINEUSDT
⁃ Timeframe: 30m
⁃ Fee: 0.075%
⁃ Slippage: 1
- Initial Capital: 10000 USDT
- Position sizing: 10% of Equity
- Start: 2022-02-28 (Out Of Sample from 2022-12-23)
- Bar magnifier: on
Disclaimer : Risk Management is crucial, so adjust stop loss to your comfort level. A tight stop loss can help minimise potential losses. Use at your own risk.
How you or we can improve? Source code is open so share your ideas!
Leave a comment and smash the boost button!
Thanks for your attention, happy to support the TradingView community.

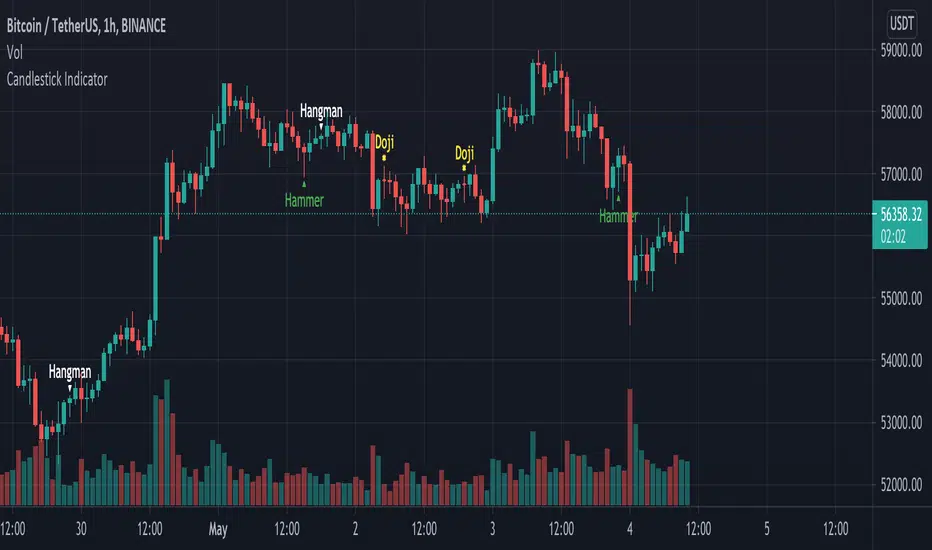
Candlestick Indicator by Crypto_AdhyetaA script to identify possible trend reversal based on Candlesticks. The correct candlestick type is identified by the relative position to Exponential Moving Average.
It detects:
- Hammer - if emerges during a downtrend (close below EMA(5)), the downtrend should end.
- Hanging Man - if comes after a advance (close above EMA(5)), the uptrend should end.
Confirmation:
- for aHammer not required
- a Hanging Man should be confirmed by lower close by the next candle
HTF Candlestick Patterns [TradingView] vX by DGTCandlesticks are graphical representations of price movements for a given period of time. They are commonly formed by the opening, high, low, and closing prices of a financial instrument. They have their origins in the centuries-old Japanese rice trade and have made their way into modern day price charting.
It’s important to note that candlestick patterns aren’t necessarily a buy or sell signal by themselves. They are instead a way to look at market structure and a potential indication of an upcoming opportunity. It is always useful to look at candlestick patterns in context like any other market analysis tool and candlestick patterns are most useful when used in combination with other techniques. There are countless candlestick patterns that traders can use to identify areas of interest on a chart, where some candlestick patterns may provide insights into the balance between buyers and sellers, others may indicate a reversal, continuation, or indecision.
Reversal patterns are quite useful when used in context. Reversal patterns should form at the bottom of a downtrend or at the top of an uptrend. Otherwise, they are not a reversal patterns, but continuation patterns. Most reversal patterns require confirmation such as price move in the direction of reversal accompanied by appropriate trading volume. The reversal patterns can further be confirmed through other means of traditional technical analysis—like trend lines, momentum, oscillators, or volume indicators—to reaffirm buying or selling pressure. The patterns themselves do not guarantee that the trend will reverse. Investors should always confirm reversal by the subsequent price action before initiating a trade.
This study implements some of the most commonly used candlestick patterns in a context with directional movement indicator. On request users can adjust the strong trend threshold from dialog box, eighter can disabled correlation with directional movement indicator. To add additional sight to analysis the simple moving averages of 20, 50, 100 and 200 periods are added (configurable)
You may add additional indicators of your choice. Colored DMI, BB Cloud or Price Distance to its MAs may help
Enjoy it!
Disclaimer: The script is for informational and educational purposes only. Use of the script does not constitutes professional and/or financial advice. You alone the sole responsibility of evaluating the script output and risks associated with the use of the script. In exchange for using the script, you agree not to hold dgtrd tradingview user liable for any possible claim for damages arising from any decision you make based on use of the script

Advanced Candlestick Pattern DetectorWhat Does This Indicator Do?
This indicator looks at the way price moves in the market using candlesticks (those red and green bars you see on charts). It tries to find special patterns like Bullish Engulfing, Hammer, Doji, and others. When one of these patterns shows up, the indicator checks a bunch of filters to decide if the pattern is strong enough to be a signal to buy or sell.
The Main Parts of the Indicator
1. Candlestick Pattern Detection
Bullish Engulfing:
Imagine you see a small down candle (red) and then a big up candle (green) that completely “covers” the red one. That’s a bullish engulfing pattern. It can signal that buyers are taking over.
Bearish Engulfing:
The opposite of bullish engulfing. A small up candle (green) is followed by a big down candle (red) that covers the previous candle. This suggests sellers might be in control.
Hammer & Shooting Star:
Hammer: A candle with a very short body and a long shadow at the bottom. It shows that buyers stepped in after a drop.
Shooting Star:
Similar to the hammer but with a long shadow on top. It can indicate that sellers are starting to push the price down.
Doji:
A candle with almost no body. This means the opening and closing prices are very close. It shows indecision in the market.
Harami Patterns (Bullish & Bearish):
These are two-candle patterns where the second candle is completely inside the body of the first candle. They signal that the previous trend might be about to change.
Morning Star & Evening Star:
These are three-candle patterns.
Morning Star:
Often seen at the bottom of a downtrend, it can signal a reversal to an uptrend.
Evening Star:
Seen at the top of an uptrend, it can signal that the price may soon go down.
2. Filters: Making the Signals Smarter
The indicator doesn’t just rely on patterns. It uses several “filters” to decide if a pattern is strong enough to trade on. Here’s what each filter does:
a. Adaptive Thresholds (ATR-Based)
What It Is:
The indicator uses something called ATR (Average True Range) to see how much the price is moving (volatility).
How It Works:
Instead of using fixed numbers to decide if a candle is a Hammer or a Doji, it adjusts these numbers based on current market activity.
User Settings:
Use Adaptive Thresholds: Turn this on to let the indicator adjust automatically.
Body Factor, Shadow Factor, Doji Factor: These numbers are multipliers that decide how small or big the body and shadows of the candle should be. You can change them if you want the indicator to be more or less sensitive.
b. Volume Filter
What It Is:
Volume shows how many trades are happening.
How It Works:
The filter checks if the current volume is higher than the average volume (multiplied by a set factor). This helps ensure that the signal isn’t coming from a very quiet market.
User Settings:
Use Volume Filter: Turn this on if you want to ignore signals when there’s not much trading.
Volume MA Period & Volume Multiplier: These settings determine what “normal” volume is and how much higher the current volume must be to count.
c. Multi-Timeframe Trend Filter
What It Is:
This filter looks at a bigger picture by using a moving average (MA) from a higher timeframe (for example, daily charts).
How It Works:
For a bullish (buy) signal, the indicator checks if the price is above this MA.
For a bearish (sell) signal, the price must be below the MA.
User Settings:
Use Multi-Timeframe Trend Filter: Enable or disable this filter.
Higher Timeframe for Trend: Choose which timeframe (like Daily) to use.
Trend MA Type (SMA or EMA) & Trend MA Period: Choose the type of moving average and how many candles to average.
d. Additional Trend Filters (ADX & RSI)
ADX Filter:
What It Is:
ADX stands for Average Directional Index. It measures how strong a trend is.
How It Works:
If the ADX is above a certain threshold, it means the trend is strong.
User Setting:
ADX Threshold: Set the minimum strength the trend should have.
RSI Filter:
What It Is:
RSI (Relative Strength Index) tells you if the price is overbought (too high) or oversold (too low).
How It Works:
For a buy signal, RSI should be low (under a set threshold).
For a sell signal, RSI should be high (above a set threshold).
User Settings:
RSI Buy Threshold & RSI Sell Threshold: These set the levels for buying or selling.
3. How the Final Signal Is Determined
For a signal (buy or sell) to be generated, the indicator first checks if one of the candlestick patterns is present. Then it goes through all these filters (trend, volume, ADX, RSI). Only if everything is in line will it show:
A BUY signal when all bullish conditions are met.
A SELL signal when all bearish conditions are met.
4. Visual Elements on the Chart
Trend MA Line:
A blue line is drawn on your chart showing the moving average from the higher timeframe (if you enable the trend filter). This helps you see the overall direction of the market.
Labels on the Chart:
When a signal is detected, you’ll see:
A BUY label below the candle (green).
A SELL label above the candle (red).
Background Colors:
The chart background might change slightly (green for bullish and red for bearish) to give you a quick visual cue.
Histogram:
At the bottom, there is a histogram that shows +1 for bullish signals, -1 for bearish signals, and 0 when there’s no clear signal.
5. Alerts
Alerts are built into the indicator so you can get a notification when a signal appears. The alert messages are fixed strings, meaning they always say something like “BUY signal on at price .” You can set up these alerts in TradingView to be notified via sound, email, or pop-up.
How to Use and Adjust the Filters
Deciding on Patterns:
You can choose which candlestick patterns you want to detect by toggling the options (e.g., Bullish Engulfing, Hammer, etc.).
Adjusting Adaptive Thresholds:
If you feel that the indicator is too sensitive (or not sensitive enough) during volatile times, adjust the Body Factor, Shadow Factor, and Doji Factor. These change how the indicator recognizes different candle shapes based on market movement.
Volume Filter Settings:
Use Volume Filter:
Turn this on if you want to ignore signals when there’s not enough trading activity.
Adjust the Volume MA Period and Volume Multiplier to change what “normal” volume is for your chart.
Multi-Timeframe Trend Filter Settings:
Choose a higher timeframe (like Daily) to see the bigger picture trend. Select the type of moving average (SMA or EMA) and its period. This filter ensures you only trade in the direction of the overall trend.
ADX & RSI Filters:
ADX:
Adjust the ADX Threshold if you want to change the minimum strength of the trend needed for a signal.
RSI:
Set the RSI Buy Threshold (for oversold conditions) and RSI Sell Threshold (for overbought conditions) to refine when a signal is valid.
Summary
This indicator is like having a smart assistant that not only looks for specific price patterns (candlesticks) but also checks if the overall market conditions are right using several filters. By combining:
Pattern Detection
Adaptive thresholds (based on ATR)
Volume Checks
Multi-Timeframe Trend Analysis
Additional Trend Strength and Overbought/Oversold Indicators (ADX & RSI)
...it helps you decide if it might be a good time to buy or sell. You can customize each part to fit your trading style, and with the built-in alerts, you can be notified when everything lines up.
Feel free to adjust the settings to see how each filter changes the signals on your chart. Experimenting with these will help you learn how the market behaves and how you can best use the indicator for your own strategy!

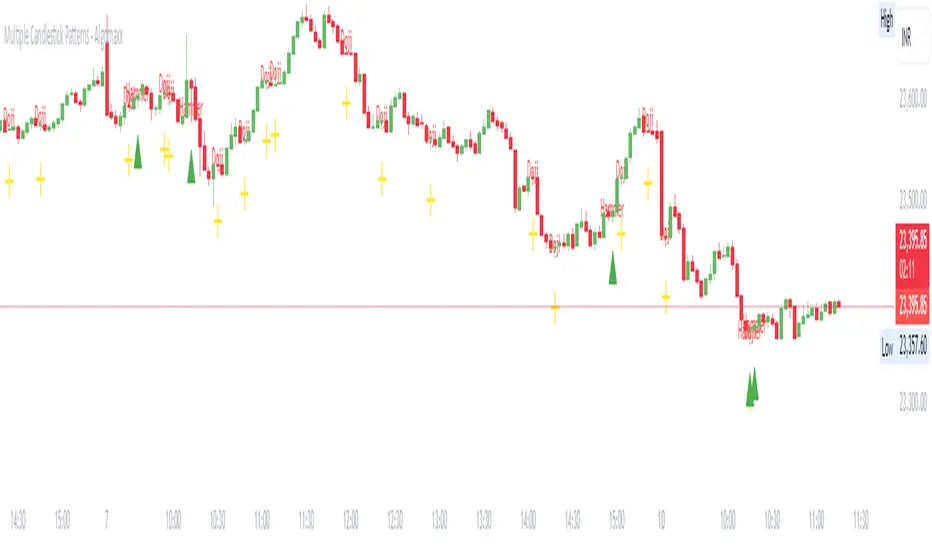
Multiple Candlestick Patterns - AlgomaxxA comprehensive candlestick pattern detection indicator that identifies seven major Japanese candlestick patterns in real-time. This indicator helps traders identify potential reversal and continuation patterns with customizable visual alerts and labels.
Features
Detects 7 major candlestick patterns:
Doji
Hammer
Shooting Star
Bullish Engulfing
Bearish Engulfing
Morning Star
Evening Star
Color-coded candlesticks for easy pattern identification
Customizable pattern indicators above/below candles
Optional pattern labels with adjustable position
Alert conditions for each pattern
Grouped settings for easy customization
Settings
General Settings
Lookback Period: Number of candles to analyze (default: 20)
Body Size Threshold: Minimum relative size for candle body (default: 0.6)
Pattern Settings
Toggle visibility for each pattern type:
Doji Pattern
Hammer Pattern
Shooting Star Pattern
Bullish Engulfing Pattern
Bearish Engulfing Pattern
Morning Star Pattern
Evening Star Pattern
Label Settings
Show Labels: Toggle pattern labels on/off
Label Text Color: Customize label color
Label Position: Choose between Left/Center/Right alignment
Label Offset: Adjust distance of labels from candles
Pattern Descriptions
Doji: Shows indecision when open and close prices are very close
Yellow color
Cross symbol below candle
Hammer: Potential bullish reversal with long lower shadow
Green color
Triangle up symbol below candle
Shooting Star: Potential bearish reversal with long upper shadow
Red color
Triangle down symbol above candle
Bullish Engulfing: Bullish reversal pattern where current green candle completely engulfs previous red candle
Light green color
Triangle up symbol below candle
Bearish Engulfing: Bearish reversal pattern where current red candle completely engulfs previous green candle
Light red color
Triangle down symbol above candle
Morning Star: Three-candle bullish reversal pattern
Seafoam green color
Triangle up symbol below candle
Evening Star: Three-candle bearish reversal pattern
Pink red color
Triangle down symbol above candle
How to Use
Add the indicator to your chart
Customize the settings based on your preferences:
Enable/disable specific patterns you want to monitor
Adjust label settings for better visibility
Set up alerts for patterns you want to be notified about
Pattern Recognition:
Watch for color changes in candlesticks indicating pattern formation
Look for shape indicators above/below candles
Read pattern labels for quick pattern identification
Trading Suggestions:
Use in conjunction with other technical indicators
Consider overall trend and support/resistance levels
Confirm patterns with volume and price action
Wait for pattern completion before making trading decisions
Tips
Patterns work best when used with multiple timeframes
Combine with trend lines and support/resistance levels
Use volume to confirm pattern strength
Consider market context and overall trend
Larger timeframes typically produce more reliable signals
Use alerts to avoid missing important pattern formations
Disclaimer
This indicator is for informational and educational purposes only. No guarantee is made regarding the accuracy of pattern detection or potential future price movements. Always use proper risk management and consider multiple factors before making trading decisions.
[GrandAlgo] Candlestick ThemesTransform your TradingView charts with Candlestick Themes, an indicator that customizes candlestick colors using a variety of stunning themes. Whether you’re seeking improved clarity, enhanced personalization, or a fresh visual appeal, this indicator has something for everyone.
Key Features
This indicator offers a wide selection of pre-defined themes:
TradingView Default: The classic, familiar look of TradingView charts.
GrandAlgo: Our exclusive brand theme, blending vibrancy and professionalism for an exceptional charting experience.
MetaTrader-Inspired Themes: Green on Black, Yellow on Black, and Black on White, designed to replicate the iconic MetaTrader aesthetics.
Green Black: A calming and balanced theme for focused trading.
Darkblue Red: A bold and impactful combination with rich tones.
Darkblue Black: A subtle, sleek palette perfect for minimalists.
Lightblue Red: A mix of warm and cool tones for balanced visuals.
Lightblue Red (Gradient): Adds smooth transitions for a modern feel.
Lightblue Black: Crisp and clean for improved readability.
Crimson to Calm: A gradient theme transitioning from bold to tranquil tones.
Robinhood: Inspired by the clean and vibrant look of the popular trading platform.
Warm & Cool Harmony: A seamless blend of warm and cool tones.
Valentine: Passionate reds and pinks for a romantic visual.
Christmas: Festive greens and reds to match the holiday spirit.
Grapes: A playful mix of purples and greens.
Desert: Warm, sandy hues inspired by desert landscapes.
Real Madrid: A sporty theme with iconic colors for fans.
This indicator ensures seamless integration with TradingView charts, offering personalized trading experience. Whether you're a seasoned trader or just starting, these themes will make your charts both functional and visually appealing.

Candlestick Percentile RankCANDLESTICK PERCENTILE RANK
█ OVERVIEW
This script is designed to sample all available candles within a chosen time frame and provide a candlestick percentile rank to each candle. This script works by measuring a candle's body or its low to high value to the upside, or to the downside in percentage or in dollar value. Once the candle is measured its given a value based on all the previous measurements. You will be able to know if a body ( or a full candle/bar ) is above, or below a certain percentile level. By doing this you're effectively going to know if a candle is under performing or under-performing compared to the chart's history.
Example : A candle that did a 30% move vs another did a 10% and a third did a 5%. Here we 3 candles. The one that did a 30% is going to be ranked at 100 because it's the highest while the 5% candle ranks at 0 and the 10% candles ranks at 50. you see how this works. Having a candle in the 90th percentile means at that time it scored better than 90% of the preceding candles based on its move ( in dollar or percentage ).
So imagine you have an organic move of an up trend, ideally and what you want to see is this ; a candle with a low rank followed by one that's higher, followed by one that's also higher until the trend stops and you see a pin bar or whatever topping candle. You expect to see a rank going from low value to high value to suddenly sharply decrease to low value.
Constant low values may indicate lower volatility or time to change. For example, a doji candle will create a very low percentile rank value ( body-wise ). A high percentile rank value means high volatility on body and full candle calculations.
^ This is only one use of it.
A trendline may also form with a breakout points and information about the trend of the volatility of recent candles. Moving averages when applied to these calculations and to the percentile ranks can absolutely help in making these trends a bit smoother which is why you can add them to the graph. if you wish.
This script can be used in multiple ways including as a measure of volatility. or for statistical purposes. If I know the 50th percentile of a candle value I can know a very critical information about an asset's behavior and how volatile it is compared to another. There are many questions that can be answered using this script. How many times has this asset printed a candle of x% in the past y amount of time and how often does that happen. Is this candle or that truly rare ?
This script also has an option to highlight a specific percentile level showing its value. You can also see the number of sampled candles for clarity on the reliability of the data.
In conclusion, candlesticks effect each others. The whole candlestick/bars patterns is based on this. The percentile Rank is an effective way to observe and study these effects. The percentile rank shows you how on a measuring stick from 0 to 100 how a candle ( body or full low-high ) ranks compared to other candles in the past based on dollar value or percentage value. There are many untapped usages of the percentile rank when applied to candlesticks calculations and I hope this script can help you with this. If one can study the behavior of an asset and its bars percentile ranks they can unlock some probabilistic advantages.
█ Future Plans and upgrades to this script may include :
1. Count the times a percentile level is hit.
2. Display details about the highest/lowest levels.
and more! feel free to let me know what you'd like to see!
█ How to use :
1. Put the script on your chart
2. Navigate to the settings
give the script a few seconds and you should be set.
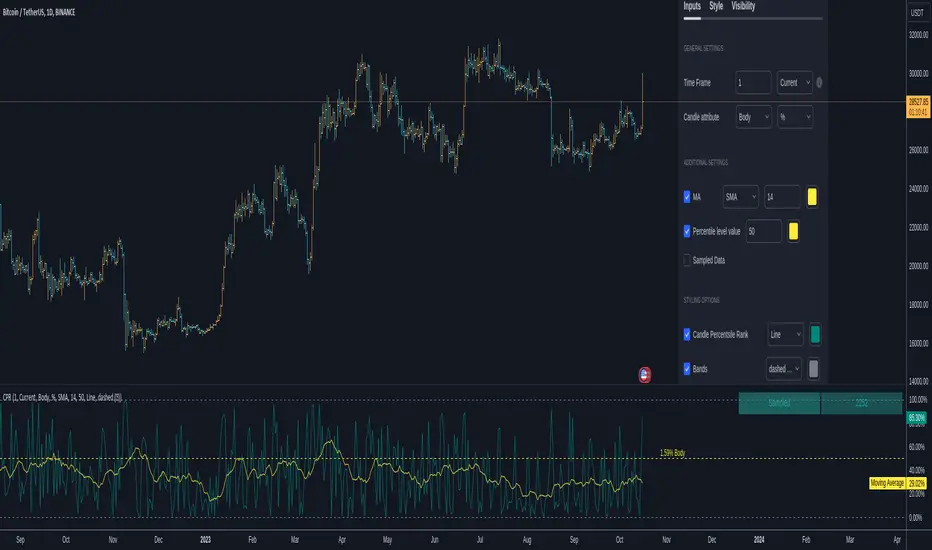
All Candlestick Patterns on Backtest [By MUQWISHI]▋ INTRODUCTION :
The “All Candlestick Patterns on Backtest” indicator generates a table that offers a clear visualization of the historical return percentages for each candlestick pattern strategy over a specified time period. This table serves as an organized resource, serving as a launching point for in-depth research into candle formations. It may help to rectify any misconceptions surrounding candlestick patterns, refine trading approaches, and it could be foundation to make informed decisions in trading journey.
_______________________
▋ OVERVIEW:
_______________________
▋ CREDIT:
Credit to public technical “*All Candlestick Patterns*” indicator.
_______________________
▋ TABLE:
_______________________
▋ CHART:
_______________________
▋ INDICATOR SETTINGS:
#Section One: Table Setting
#Section Two: Backtest Setting
(1) Backtest Starting Period.
Note: If the datetime of the first candle on the chart is after the entreated datetime, the calculation will start from the first candle on the chart.
(2) Initial Equity ($).
(3) Leverage: Current Equity x Leverage Value.
(4) Entry Mode:
- “At Close”: Execute entry order as soon as the candle confirmed.
- “Breakout High (Low for Short)”: Stop limit buy order, entry order will be executed as soon as the next candle breakout the high of last pattern’s candle (low for short)
(5) Cancel Entry Within Bars: This option is applicable with {Entry Mode = Breakout High (Low for Short)}, to cancel the Entry Order if it's not executed within certain selected number of bars.
(6) Stoploss Range: the range refers to high of pattern - low of pattern.
(7) Risk:Reward: the calculation of risk:reward range start from entry price level. For example: A pattern triggered with range 10 points, and entry price is 100.
- For 1:1~risk:reward would the stoploss at 90 and takeprofit at 110.
- For 1:3~risk:reward would the stoploss at 90 and takeprofit at 130.
#Section Three: Technical & Candle Patterns
_______________________
▋ Comments:
This table was developed for research and educational purposes.
Candlestick patterns are almost similar as seen in “*All Candlestick Patterns*” indicator.
The table results should not be taken as a major concept to build a trading decision.
Personally, I see candlestick patterns as a means to comprehend the psychology of the market, and help to follow the price action.
Please let me know if you have any questions.
Thank you.

All Candlestick Patterns Screener [By MUQWISHI]▋ INTRODUCTION :
The Candlestick Patterns Screener has been designed to offer an advanced monitoring solution for up to 40 symbols. Utilizing a log screener style, it efficiently gathers information on confirmed candlestick pattern occurrences and presents it in an organized table. This table includes essential details such as the symbol name, signal price, and the corresponding candlestick pattern name.
_______________________
▋ OVERVIEW:
_______________________
▋ CREDIT:
Credit to public technical “*All Candlestick Patterns*” indicator.
_______________________
▋ USAGE:
_______________________
▋ Final Comments:
For best performance, add the Candlestick Patterns Screener on active symbol chart like QQQ, SPY, AAPL, BTCUSDT, ES, EURUSD or …etc.
Candlestick patterns are not a major concept to build a trading decision.
Personally, I see candlestick patterns as a means to comprehend the psychology of the market, and help to follow the price action.
Please let me know if you have any questions.
Thank you.

Candlestick PatternsCandlestick Patterns
- Candlesticks are graphical representations of price movements for a given period of time.
- There are candlestick patterns that try to predict the final direction, caused by pressure between buyers and sellers.
As a general recommendation, use the candlestick patterns in the same direction of the current trend (continuations),
for reverse patterns we must expect the price to be over extended, for example,
that it is the highest or lowest value of (20-50) periods,
or that the RSI is overbought or oversold (14-50),
or that the price is far from its standard deviation.
- This indicator allows you to view more than 20 different patterns, some of them:
Doji
Engulfing
Hammer
Shooting Star
Inverted Hammer
Hanging Man
Morning Star
Evening Star
etc...
- The indicator allows displaying the full name of the pattern
- It allows you to view the labels at the top of the chart, to avoid this affecting the technical analysis

Bullish Candlestick Pattern Tracker (21 Patterns)Script Title: Bullish Candlestick Pattern Tracker (21 Patterns)
Overview
This script is a comprehensive tool designed to automatically detect and track the lifecycle of 21 distinct bullish candlestick patterns.
It identifies a pattern upon the close of a bar and then monitors its status over a user-defined period. The primary goal is to provide traders with clear, automated signals for potential bullish reversals, complete with pre-calculated confirmation and stop-loss levels based on established technical analysis definitions.
This indicator is built in Pine Script v6 and uses a stateful tracking system to manage each detected pattern.
Key Features
21 Bullish Patterns: Detects a wide array of patterns, from single-bar formations (e.g., Bullish Hammer) to complex three-bar formations (e.g., Bullish Morning Star, Bullish Three White Soldiers).
Stateful Lifecycle Tracking: This is not just a pattern detector. It monitors each pattern's status in real-time after detection:
Not Confirmed: The pattern has formed, but the price has not yet closed above the confirmation level.
Confirmed: The price has successfully closed above the confirmation level.
Failed: The price has closed below the stop-loss level (either before or after confirmation).
Customizable Confirmation Period: Users can define how many bars the script should wait for a pattern to be confirmed or to fail (via the confBarCount input).
Clear Visual Labels: Displays a detailed label under each unconfirmed pattern, showing:
Pattern Name (e.g., "Bullish Engulfing")
Status: "Not Confirmed"
Confirmation Level (Teyit): The price that must be breached (on close) for the pattern to be considered valid.
Stop-Loss Level (S/L): The price level that invalidates the pattern.
Modular Inputs: Each of the 21 patterns can be individually toggled on or off from the settings menu, allowing you to focus only on the patterns you trust.
Methodology & Logic
The logic for pattern detection, as well as the specific rules for each pattern's Confirmation Level and Stop-Loss Level, is strictly based on the definitions provided in the "Mum Formasyonları (Kasım 2015 Versiyon 7.1.4)" guide by Matriks Bilgi Dağıtım Hizmetleri A.Ş.
This script serves as a Pine Script v6 implementation of those specific rules, designed for stock market analysis (Bullish signals only).
How to Use (Parameters Explained)
Teyit Bar Sayısı (Conf. Bar Count): This is the most important input. It defines the "expiration" for a pattern. For example, if set to 3, the script will monitor a new pattern for 3 bars. If it is not confirmed or failed within those 3 bars, the label will disappear.
Status Toggles (e.g., showNotConfirmed): Allows you to filter which pattern statuses are visible on the chart. It is recommended to keep all three active.
Pattern Toggles (e.g., 1. Bullish Hammer Göster): Use these 21 checkboxes to activate or deactivate the detection for specific patterns.
Disclaimer
This indicator is provided for educational and informational purposes only. It does not constitute financial advice or a recommendation to buy or sell any asset. All trading involves significant risk, and past performance is not indicative of future results. Please conduct your own research and backtesting before making any trading decisions.

[TehThomas] - CandleStick PatternsScript Overview
This script is designed to identify and highlight various candlestick patterns on a trading chart. It detects bullish, bearish, indecisive, and continuation patterns and visually represents them with color-coded bars. Additionally, it displays a table summarizing the detected patterns.
Key Features
Candlestick Pattern Detection
Identifies multiple candlestick patterns, including:
Bullish Patterns: Bullish Engulfing, Hammer, Inverse Hammer, Morning Star, Piercing Line.
Bearish Patterns: Bearish Engulfing, Hanging Man, Shooting Star, Evening Star, Dark Cloud Cover.
Indecisive Patterns: Doji, Dragonfly Doji, Gravestone Doji.
Each pattern is assigned a distinct color for easy visualization.
Customizable Visibility & Colors
Users can enable or disable the detection of specific patterns.
Custom colors can be assigned to each pattern for better chart clarity.
Trend Identification
Uses the Simple Moving Average (SMA) to determine whether the market is in an uptrend or downtrend.
Helps in filtering patterns based on the prevailing trend.
Pattern Highlighting
Changes the color of the candlesticks whenever a pattern is detected.
Uses barcolor() to color the candles accordingly.
Pattern Dashboard (Table Display)
A static table in the top-right corner of the chart summarizes the detected patterns.
Ensures the table is only created once per chart load to avoid performance issues.
Function Breakdown
1. Input Parameters
Uses input.bool() to allow traders to toggle specific patterns on or off.
Uses input.color() to let users customize the colors for different patterns.
2. Candlestick Measurements
bodySize(index): Measures the absolute size of the candle body.
upperWick(index): Measures the upper wick size.
lowerWick(index): Measures the lower wick size.
3. Trend Determination
isUptrend(length): Checks if the price is above its SMA (indicating an uptrend).
isDowntrend(length): Checks if the price is below its SMA (indicating a downtrend).
4. Candlestick Pattern Identification
Engulfing Patterns
Bullish Engulfing: A large green candle fully engulfs the previous red candle, occurring in a downtrend.
Bearish Engulfing: A large red candle fully engulfs the previous green candle, occurring in an uptrend.
Hammer & Related Patterns
Hammer: A candle with a small body and a long lower wick, appearing after a downtrend.
Inverse Hammer: A candle with a small body and a long upper wick, appearing after a downtrend.
Hanging Man: A Hammer-like pattern that appears in an uptrend.
Shooting Star: An Inverse Hammer-like pattern that appears in an uptrend.
Doji Patterns
Doji: A candle with a small body (open and close prices nearly equal).
Dragonfly Doji: A Doji with a long lower wick.
Gravestone Doji: A Doji with a long upper wick.
Star Patterns
Morning Star: A bullish reversal pattern consisting of three candles.
Evening Star: A bearish reversal pattern consisting of three candles.
Continuation Patterns
Piercing Line: A two-candle bullish continuation pattern.
Dark Cloud Cover: A two-candle bearish continuation pattern.
5. Candlestick Coloring
Uses barcolor() to color the candles based on the detected pattern.
The color is determined using a conditional statement, ensuring only one pattern applies per candle.
6. Pattern Dashboard
Uses tables (table.new()) to display a static dashboard with all enabled patterns.
Calls updateTableCell() to add rows for each active pattern.
How This Script is Useful for Trading
1. Identifying Trade Opportunities
Helps traders spot potential reversal points (e.g., Bullish Engulfing, Hammer, Morning Star).
Highlights trend continuation signals (e.g., Piercing Line, Dark Cloud Cover).
2. Confirming Trend Strength
Engulfing patterns in the direction of the trend confirm trend strength.
Doji and indecisive patterns warn traders of potential reversals or trend slowdowns.
3. Enhancing Trade Entries & Exits
Enter long positions after spotting bullish patterns like Morning Star, Hammer.
Exit long positions when bearish patterns like Evening Star, Shooting Star appear.
Enter short positions upon seeing bearish engulfing, Hanging Man, or Dark Cloud Cover.
4. Improving Risk Management
Traders can set stop-loss orders based on the pattern structure.
Example: Placing stop-loss below the low of a Hammer confirms bullish strength.
5. Works with Other Indicators
Can be combined with RSI, MACD, Bollinger Bands for more reliable signals.
Limitations
False Signals: Candlestick patterns alone are not 100% reliable; traders should confirm signals with volume and trend analysis.
No Automatic Alerts: This script does not send trading alerts; manual observation is required.
No Multi-Timeframe Analysis: It only considers the timeframe it is applied to.
Final Thoughts
This script is a powerful visual tool for traders who rely on candlestick patterns. It helps identify potential reversals, continuations, and indecision zones in the market. While it’s highly useful for discretionary trading, it’s best used alongside other technical indicators to confirm trade setups.

Fibonacci Candlestick - AYNETHow It Works
Inputs:
ltf_timeframe: Specify the timeframe for candlestick data (e.g., 1H, 4H).
Fibonacci Levels:
Toggle Fibonacci level visibility (show_fib_levels).
Customize Fibonacci line color (fib_color) and width (fib_width).
Candlestick Data:
Fetches open, high, low, and close prices for the specified timeframe using request.security.
Fibonacci Levels:
Calculates standard Fibonacci retracement levels (0.0, 23.6%, 38.2%, 50%, 61.8%, 78.6%, 100%) for each candle's high-low range.
Draws horizontal lines for each level using line.new.
Candlestick Visualization:
Plots lower timeframe candles with customizable bullish and bearish colors.
Key Features
Dynamic Fibonacci Levels:
Fibonacci levels are recalculated for each candlestick's high-low range.
Levels update dynamically with new candles.
Candlestick Overlay:
Visualizes candlestick data from the specified timeframe directly on the current chart.
Customizable Appearance:
Configure colors for Fibonacci levels, candlestick bodies, and wicks.
Use Cases
Microstructure Analysis:
Analyze individual candlesticks with their Fibonacci retracements for potential support/resistance zones.
Multi-Timeframe Trading:
Overlay candlestick and Fibonacci data from a lower timeframe onto a higher timeframe chart.
Let me know if you'd like further enhancements or explanations! 😊
