Pin Bar, Inside Bars and Engulfing Candle SticksIntroducing the Candlestick Pattern Plotter, a comprehensive TradingView indicator designed to elevate your technical analysis by automatically identifying and plotting three essential candlestick patterns – Pin Bars, Engulfing Candles, and Inside Bars. This powerful tool equips traders with a holistic view of market dynamics, enabling them to make informed decisions based on key price action signals.
Pin Bar Identification:
The indicator adeptly recognizes Pin Bars, a pivotal candlestick pattern characterized by a small body and a long wick in the opposite direction of the prevailing trend.
Pin Bars are instrumental in signaling potential trend reversals or continuations, providing crucial insights for strategic decision-making.
Engulfing Candle Detection:
Identify Engulfing Candles effortlessly with this indicator, showcasing instances where the body of one candle fully engulfs the body of the previous candle.
Engulfing Candles serve as powerful reversal indicators, offering valuable insights into shifts in market sentiment and potential trend reversals.
Inside Bar Recognition:
The indicator goes beyond traditional patterns by identifying Inside Bars, where the range of a candle is entirely within the previous candle's high and low.
Inside Bars often signify consolidation or a period of indecision in the market, providing traders with crucial information about potential breakouts or reversals.
Seamlessly integrate the Candlestick Pattern Plotter into your TradingView chart, enjoying a user-friendly interface for swift interpretation of candlestick patterns.
Toggle the display of Pin Bars, Engulfing Candles, and Inside Bars on and off with ease, allowing you to focus on the specific patterns most relevant to your analysis.
Real-Time Alerts:
Stay ahead of the market with real-time alerts that notify you when a Pin Bar, Engulfing Candle, or Inside Bar is identified on the chart.
Timely notifications keep you informed, ensuring you never miss a potential trading opportunity based on these crucial candlestick patterns.
Enhance your trading strategy with the precision of Pin Bars, Engulfing Candles, and Inside Bars, seamlessly integrated into your analysis through the Candlestick Pattern Plotter. Gain a comprehensive understanding of market movements and make well-informed decisions in real-time.
Search in scripts for "Candlestick"
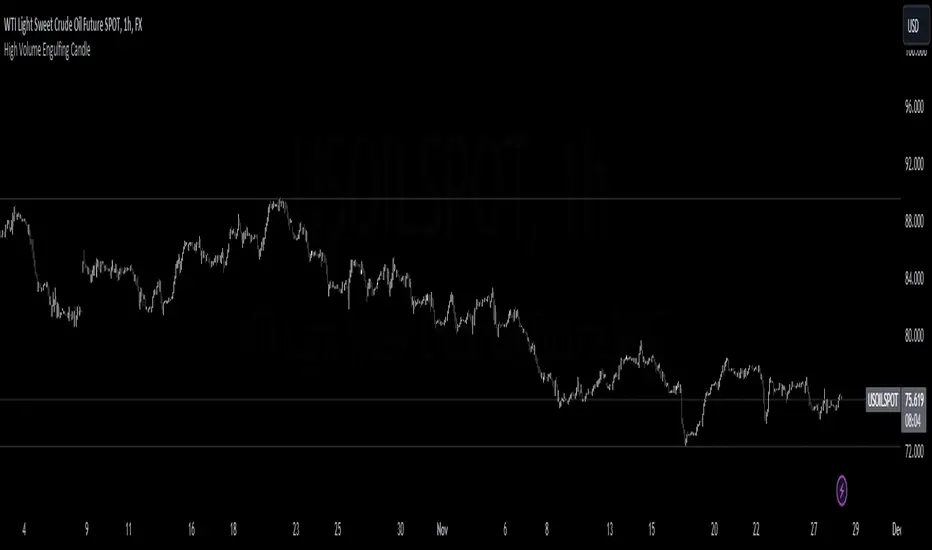
High Volume Engulfing Candle_bullHornThe "High Volume Engulfing Candle" indicator is a technical analysis tool used in trading to identify specific candlestick patterns that suggest potential reversals or significant price movements in a financial instrument. It focuses on two key criteria: the engulfing candlestick pattern and high trading volume. Here's a brief description of the indicator:
Engulfing Candlestick Pattern: The indicator looks for bullish and bearish engulfing candlestick patterns.
Bullish Engulfing: This pattern occurs when the current candlestick completely engulfs the previous one. In other words, the current candlestick's body (the open and close prices) is larger than the previous candlestick's body, and it closes higher than the previous candle's close. It suggests a potential bullish reversal.
Bearish Engulfing: This pattern occurs when the current candlestick's body completely engulfs the previous one, but in the opposite direction. The current candlestick's body is larger than the previous candlestick's body, and it closes lower than the previous candle's close. It suggests a potential bearish reversal.
High Volume Confirmation: In addition to the engulfing pattern, the indicator considers trading volume. It looks for instances where the volume accompanying the engulfing candle is significantly higher than a moving average of the volume. This indicates strong market participation and validates the importance of the engulfing candle pattern.
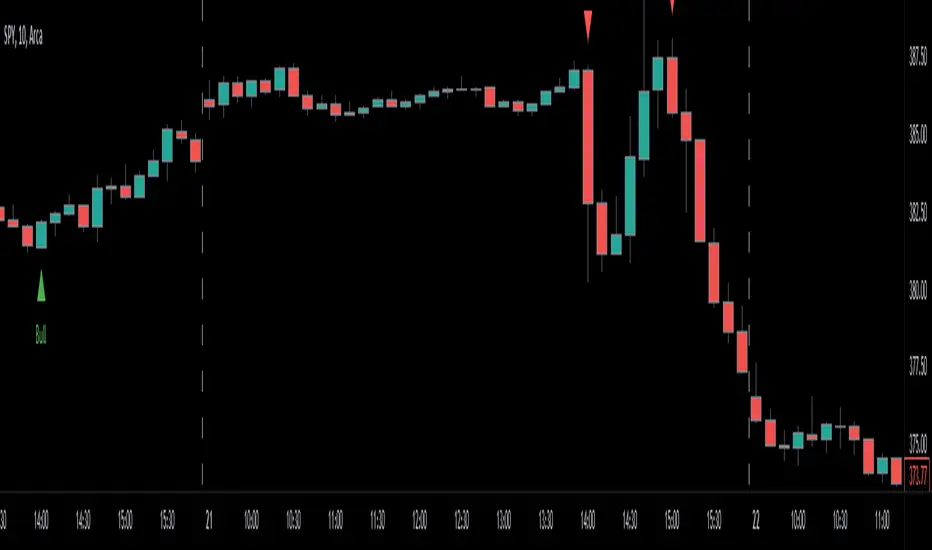
Arrows on the Chart: When a high volume engulfing candle pattern is detected, the indicator plots arrows on the price chart. A green triangle pointing up is used for bullish engulfing patterns, while a red triangle pointing down is used for bearish engulfing patterns. These arrows help traders quickly identify potential reversal points.
Overall, the "High Volume Engulfing Candle" indicator combines the visual recognition of candlestick patterns with volume analysis to provide traders with potential signals for trend reversals or significant price moves in the market. Traders can use these signals as part of their technical analysis and trading strategies.
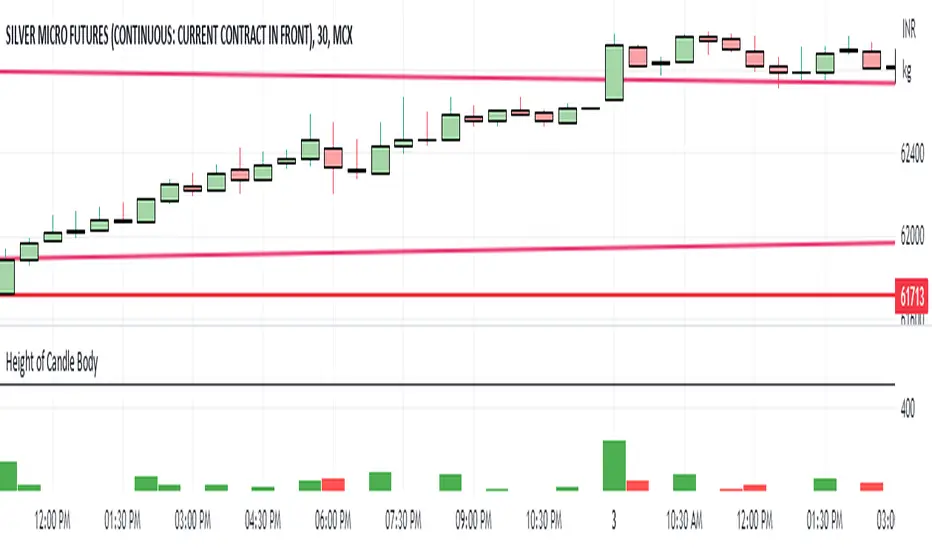
Height of Candle BodyUnderstanding the Height of Candlestick Body
Candlestick charts are a popular method of displaying price data in financial markets. They provide a visual representation of price movements and are used by traders to make informed decisions about buying and selling assets. Understanding the height of a candlestick body is an important aspect of technical analysis and can help traders identify trends and make profitable trades.
The height of a candlestick body is the distance between the opening and closing price of an asset over a given time period. When the closing price is higher than the opening price, the candlestick body is typically colored green or white and is considered bullish. Conversely, when the closing price is lower than the opening price, the candlestick body is typically colored red or black and is considered bearish.
The height of the candlestick body is important because it can provide valuable information about market sentiment. If the candlestick body is relatively small, it suggests that there is indecision in the market and that buyers and sellers are evenly matched. Conversely, if the candlestick body is relatively large, it suggests that there is a significant amount of buying or selling pressure in the market.
Engulfing Candles (Bullish and Bearish) + Trend | by Octopu$⛳ Engulfing Candles (Bullish and Bearish ) with Trend Recognition | by Octopu$
This Indicator identifies and plots Engulfing Candlestick Patterns.
Engulfing Candles are a combination of two bars on a price chart.
They are used to indicate/anticipate a market reversal.
The second candlestick must be bigger than the first, so it 'engulfs' the previous bar.
This indicator identifies both Price Movements:
Bullish stands for Upside
Bearish stands for Downside
These are NOT entry/exit signals to buy or sell securities*
(*The combination of your understanding and analysis as well as other Indicators and Factors as Confluence, you can improve your Charting Analysis.)
www.tradingview.com
SPY
ANY Ticker. ANY Timeframe.
( SPY 5m as an example only.)
Features:
• Engulfing Candles
• Bullish Setups
• Bearish Setups
• Symbol Signals
Options:
• Color Picker
• Symbol Selector
• Toggle On/Off
• Show name
• Trend Direction
Notes:
v1.0
Indicator release.
Changes and updates can come in the future for additional functionalities or per requests. Follow and Stay Tuned!
Did you like it? Please Support and Shoot me a message! I'd appreciate if you dropped by to say thanks! Thank you.
- Octopu$
🐙
3LS | 3 Line Strike Strategy [Kintsugi Trading]What is the 3LS | 3 Line Strike Strategy?
Incorporating the 3 Line Strike candlestick pattern into our strategy was inspired by Arty at The Moving Average and the amazing traders at TheTrdFloor .
The Three Line Strike is a trend continuation candlestick pattern consisting of four candles. Depending on their heights and collocation, a bullish or a bearish trend continuation can be predicted.
In a symphony of trend analysis, price action, and volume we can find and place high-probability trades with the 3LS Strategy.
How to use it!
----- First, start by choosing a Stop-Loss Strategy, Stop PIP Size, and Risk/Reward Ratio -----
- Stop-Loss Strategy
Fixed PIP Size – This uses the top/bottom of the indicator candle and places a TP based on the chosen Risk:Reward ratio.
ATR Trail (No set Target Profit, only uses ATR Stop)
ATR Trail-Stop (Has set Target Profit, however, stop is based on ATR inputs)
**If you choose an ATR Stop-Loss Strategy - input the desired ATR period and Multiple you would like the stop to be calculated at**
**ATR Stop-Loss Strategies have a unique alert setup for Auto-Trading. See Auto-Trading Section**
- Risk/Reward Ratio = If you have a .5 risk/reward, it means you are risking $100 to make $50.
- Additional Stop PIP Size = Number of PIPs over the default stop location of the top or bottom of the indicator candle.
----- Next, we set the Session Filter -----
Set the Timezone and Trade Session you desire. If no specific session is desired, simply set the Trade Session to 00:00 - 00:00.
----- Next, we set the Moving Average Cloud Fill -----
Enter the Fast and Slow Moving Average Length used to calculate trend direction:
MA Period Fast
MA Period Slow
These inputs will determine whether the strategy looks for Long or Short positions.
----- Next, we set the VSA – Volume Spread Analysis Settings -----
Check the box to show the indicator at the bottom of the chart if desired.
This is just a different visual output of the VSA | Volume Spread Analysis indicator available for free under the community indicators tab. You can add that indicator to your chart and see the same output in candle format.
In combination with the Moving Average Cloud, the Volume Spread Analysis will help us determine when to take a trade and in what direction.
The strategy is essentially looking for small reversals going against the overall trend and placing a trade once that reversal ends and the price moves back in the direction of the overall trend.
The 3LS Strategy utilizes confirmation between trend, volume, and price action to place high probability trades.
The VSA is completely customizable by:
Moving Average Length
MA-1 Multiplier
MA-2 Multiplier
MA-3 Multiplier
Check out the VSA | Volume Spread Analysis indicator in the community scripts section under the indicators tab to use this awesome resource on other strategies.
----- Next, we have the option to view the automated KT Bull/Bear Signals -----
Check the boxes to show the buy-sell signal on the chart if desired.
----- Next, we set the risk we want to use if Auto Trading the strategy -----
I always suggest using no more than 1-3% of your total account balance per trade. Remember, if you have multiple strategies triggering per day with each using 1%, the total percent at risk will be much larger.
For Example – if you have 10 strategies each risking 1% your total risk is 10% of your account, not 1%! Be mindful to only use 1-3% of your total account balance across all strategies, not just each individual one.
----- Finally, we backtest our ideas -----
After using the 'Strategy Tester' tab on TradingView to thoroughly backtest your predictions you are ready to take it to the next level - Automated Trading!
This was my whole reason for creating the script. If you work a full-time job, live in a time zone that is hard to trade, or just don't have the patience, this will be a game-changer for you as it was for me.
Auto-Trading
When it comes to auto-trading this strategy I have included two options in the script that utilize the alert messages generated by TradingView.
*Note: Please trade on a demo account until you feel comfortable enough to use real money, and then please stick to 1%-2% of your total account value in risk per trade.*
AutoView
PineConnector
**ATR Auto-Trading Alert Setup**
How to create alerts on 3 Line Strike Strategy
For Trailing Stops:
1) Adjust autoview/pineconnector settings
2) Click "add alert"
3) Select "Condition" = Strategy Name
4) Select "Order Fills Only" from the drop-down
3) Remove template message text from "message" box and place the exact text. '{{strategy.order.alert_message}}'
4) Click "create"
For Fixed Pip Stop:
1) Adjust autoview/pineconnector settings
2) Click "add alert"
3) Select "Condition" = Strategy Name
4) Select "alert() function calls only"
5) I like to title my Alert Name the same thing I named it as an Indicator Template to keep track
Good luck with your trading!

Easy Scalping by JayKasunBINANCE:BTCUSDTPERP
This indicator can show stochastic RSI K and D line crosses and some candlestick patterns on chart.
You can use this indicator to scalping, check usage for more info. Always backtest before trading with your real money.
This indicator will also help mobile TradingView users to get an idea when getting stochastic RSI signals, they can use this indicator to check if stochastic RSI K and D crossed or not. ( Because they have limited area to view chart ) .
4 Exponential moving averages are there in the indicator with easy enable disable option. 9 , 21 , 55 , 100 is suggested as default values.
Meanings of signs in chart
Blue triangle bellow candle means it's a stochastic RSI K and D line cross in oversold level
Red triangle above candle means it's a stochastic RSI K and D line cross in overbought level
Green plus sign shows when EMA 50 crossover EMA 100
Red plus sign shows when EMA 50 cross bellow EMA 100
Features
You can enable candlestick pattern displaying when stochastic RSI K and D cross happen. Check indicator settings.
You can enable displaying ATR Trailing Stops in indicator settings.
Indicator will only show blue triangle after Green plus sign and Red triangles after Red plus sign
After you enable candlestick pattern option, stochastic RSI crosses with candlestick patterns will show in deferent colors. Blue triangle will turn into green and Red triangle into pink.
Usage
Use lower time frames like 5m or 15m
After green plus sign, if price retouched 21 EMA or 55 EMA and blue triangle appeared , you can enter a long position.
After red plus sign, if price retouched 21 EMA or 55 EMA and red triangle appeared , you can enter a short position.
Always wait for candle close . signs of chart can be changed when candle closing. ( Does repaint until candle close )
Use ATR trailing to get a stop loss price.
Use 1:1 or 1:0.5 Risk Reward ratio. Because it's scalping and lower time frame.
Use more indicators like RSI to get more confirmations ( like divergences ) before entering a trade. Its more reliable.
Candlestick Patterns Short names
H - Hammer
IH -Inverted Hammer
BE - Bullish Engulfing ( green triangle )
BE - Bearish Engulfing ( pink triangle )
BH - Bullish Harami ( green triangle )
BH - Bearish Harami ( pink triangle )
I have included ATR + Trailing Stops by SimpleCryptoLife and Candlestick Patterns Identified (updated 3/11/15) by repo32
this is a combination of multiple indicators
credit goes to original creators of above indicators

Q-Bar SignalsHello Traders & Q Zoners
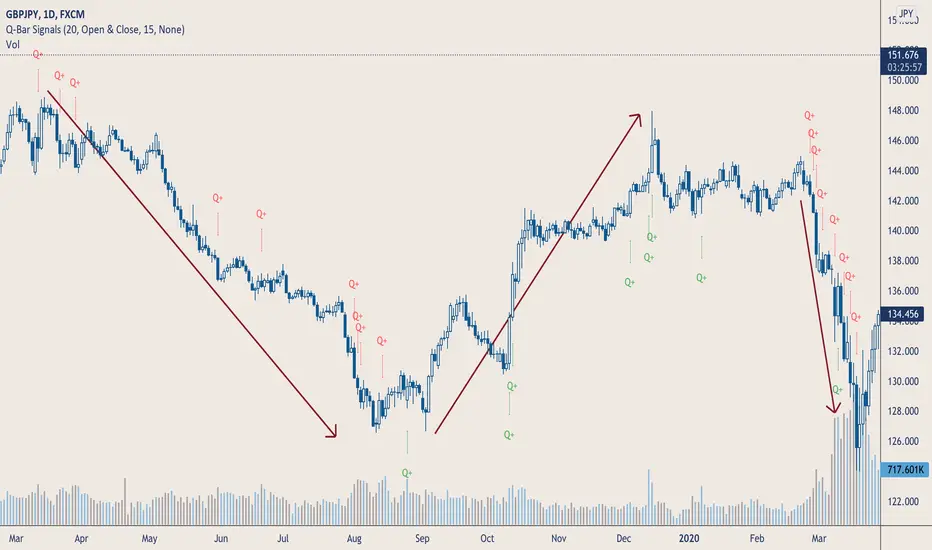
I introduce to you my latest indicator “Q-Bar Signals”. This indicator compares candlestick sizes as well as volume levels to check if latest candle is greater in both size and volume to a user-defined set of bars back.
Condition 1: For bullish candles, the indicator will measure the candlestick size of x number of bearish candles back and take the average size. It then takes the size of the bullish candle and if it is bigger than the average of x number of bearish candles, then it will display a green “Q” below that bullish candle. The opposite signal is true for bearish candles, displaying a red “Q” above the candlestick when the bearish candle is larger in size than the average number of bullish candles back.
Condition 2: The second part of this indicator compares volume. If a candlestick has met the first condition, it will also measure the volume of that candlestick and compare it to the volumes of a user-defined number of bars back. If the candlestick is bullish, it will look at the last x number of bearish volume bars and check if the bullish volume is higher than the highest volume of the bearish candles. If the condition is met, a green “Q+” will appear below the candle for bullish candles, and a red “Q+” will appear above the candle for bearish candles.
The user has a few different input options as well as alerts:
- Number of bars back to measure candlestick size from and take its average
- The candlestick measurement method: Between high to low, between open to close, or between the high/low to close (bullish candles measured between low to close, bearish candles measured between high to close)
- Number of bars back to check highest volume from and compare to current candlestick volume.
- Option to show only Q signals or both Q+ signals.
- Alerts for when signal first appears.
The signal waits for the candle to close and will then display signal and/or alert on the very opening of the next bar.
Tooltips have been added to the Q and Q+ labels which will display information containing the candlestick sizes and volume sizes to show you how the calculation is being performed and how big the differences are.
This indicator is meant to be used in conjunction with other tools and methods to help traders spot significant changes in price action and volume spikes.
Enjoy!
Bar█ OVERVIEW
This indicator demonstrates how we can use Pine script for collecting data to study the market.
By building a statistical report based on the chart candlestick analysis, discover if there is an edge or not, when and where?
Compare it with a specific candlestick pattern and know how its behavior diverges. I have already covered some here .
I hope it can bring you ideas for researching new edges, testing, and trying new things.
█ FEATURES
Sections
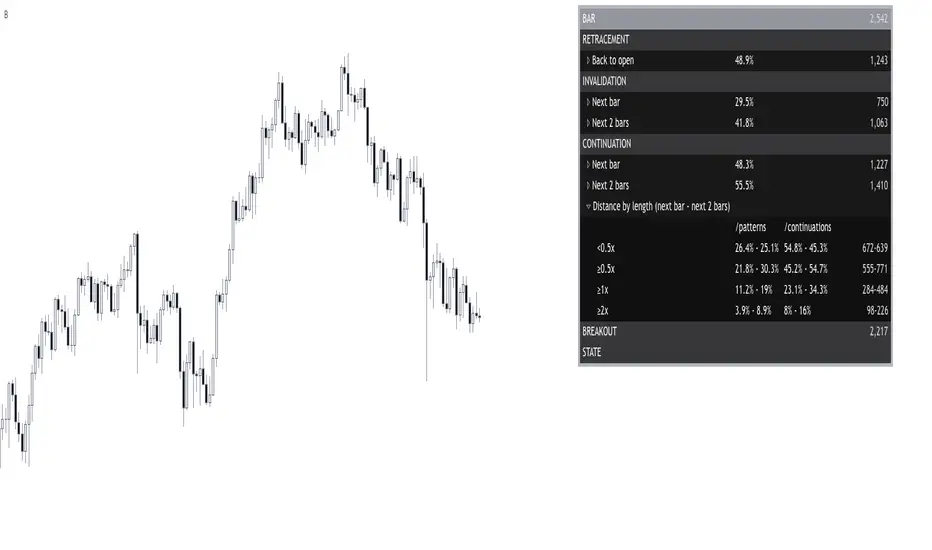
The report organizes the data into the following sections: retracement , invalidation , continuation , breakout , and state . Each of them provides insights into the price behavior and answers to questions such as: How often does price retrace? Does the pattern often invalidate? If it does not, does it break in the pattern's direction? How far does the price go? What are the odds of a false breakout? What is the likelihood of the next bar being a down candle?
Highlighter
The indicator highlights flat bars (open and close at the same price). It also highlights bullish and bearish bars once a filter is applied.
Settings
Filtering of bars closing beyond their prior bar’s high and low;
Filtering of reversal bars (two modes available);
Displaying distances relative to the bars length or Average True Range;
Collapsing/expanding each section;
Changing the report’s coloring and positioning;
█ NOTES
Computation
The script computation occurs on bar close.
Distances in ATR
When using a period of 20, for example, the first 19 candles are ignored because the ATR is not defined yet.
Multiple Candle Stick PatternsMultiple Candle Patterns (added multiple indicators regarding candle stick patterns)
1. Ichimoku cloud and candle
2. Candlestick Patterns Identified (updated 3/11/15) by repo32
3. Candlestick Patterns With EMA and Stochastic by rmwaddelljr
4. TUX Candles
Please note me when the signals are overlapped or unrecognizable, then they will be fixed.
- Korean -
캔들 스틱 패턴에 관한 여러가지 지표를 합쳐서 하나로 만들었습니다.
시각적으로 시그널이 곂치거나, 잘 안보이는 부분은 코멘트 남겨주시면 수정하겠습니다.

DisruptNEX Edge SystemDisruptNEX Edge System is an analytical overlay indicator designed to visualize market direction, trend maturity, exhaustion conditions, and impulse activity within a single, coherent framework.
The system is built as a structured analytical model rather than a collection of independent tools.
All visual elements are derived from a shared internal reference, ensuring consistency between trend context, exhaustion states, impulse activity, and higher-timeframe structure.
1. Market Regime & Trend Visualization
Illustration 1: Market regime visualization through candle coloring.
At the foundation of the system lies a price-centered baseline, computed as a windowed mid-range estimator with optional adaptive smoothing.
This baseline defines the current market regime:
Price above the baseline represents bullish directional pressure.
Price below the baseline represents bearish directional pressure.
The regime is expressed directly through candle coloring, allowing traders to visually identify the active trend without relying on additional overlays or separate panels.
This regime context acts as the primary reference for all subsequent components of the system.
2. Exhaustion Zones on the Price Chart
Illustration 2: Overbought / Oversold ribbons visualized directly on price.
DisruptNEX Edge System identifies potential exhaustion using a persistence-based evaluation of how consistently price holds above or below a volatility-adjusted reference.
Unlike oscillators displayed in a separate pane, exhaustion is visualized directly on the price chart using bounded ribbons.
Key characteristics of the exhaustion logic:
Overbought and Oversold states are detected as discrete state transitions.
Zones are marked at their initial appearance.
Visual persistence reflects state continuity rather than momentary fluctuations.
This approach helps traders assess when price reaches statistically stretched conditions relative to the active regime, often corresponding to areas where pullbacks or pauses may develop.
3. Candlestick Pattern Context
Illustration 3: Candlestick patterns displayed within the active trend context.
The system includes optional candlestick pattern detection displayed directly on the price chart as contextual information.
Patterns are evaluated relative to the active market regime and are commonly associated with short-term pauses, pullbacks, or localized price reactions within an existing trend.
Patterns are not interpreted as standalone reversal signals and do not provide trade instructions.
Their role is to complement trend context by highlighting moments where traders may choose to observe price behavior more closely.
4. Spark Impulses & Structural Reference Zones
Illustration 4: Spark impulses and dynamic structural reference zones.
Spark impulses highlight moments when directional pressure increases within the active market regime.
They are derived from a volatility-normalized measure of price displacement relative to the internal baseline and evaluated across multiple smoothing horizons.
This allows the system to identify shifts in directional activity rather than isolated price fluctuations.
Spark impulses commonly appear after consolidation, pullbacks, or localized hesitation and act as analytical confirmation that market activity is resuming in a given direction.
Alongside impulse visualization, the system derives dynamic structural reference levels based on recent price behavior and volatility.
These levels are updated only on the most recent bar and represent contextual support and resistance zones.
Structural reference levels are not predictive targets.
They serve as spatial guides, helping traders evaluate price positioning relative to recent structure and impulse activity.
5. Trend Power & Multi-Timeframe HUD
Illustration 5: Right-side HUD summarizing multiple timeframes.
The indicator includes a compact HUD panel that aggregates key structural information across multiple timeframes:
Overbought / Oversold state
Trend Power level
Trend direction
Trend Power quantifies how extended the current regime is by measuring price progression since the last confirmed regime change, normalized by volatility and mapped to a bounded scale.
This allows traders to distinguish between developing, established, and extended trends, while the multi-timeframe layout helps assess alignment between the current chart and higher-level market structure.
How to Read the Indicator
Start by observing candle coloring to identify the active market regime.
Use exhaustion ribbons to recognize areas where price may pause or pull back relative to the regime.
Treat candlestick patterns as contextual signals highlighting potential short-term reactions.
Look for Spark impulses as confirmation of renewed directional activity.
Use structural reference zones as orientation points when evaluating price location.
Consult the HUD to check trend direction, maturity, and exhaustion across higher timeframes.
Alerts & Usage Notes
Alerts are event-based and triggered only on confirmed state changes, including:
Regime transitions
Exhaustion state entries
Candlestick pattern detection
Spark impulse events
Important Notes
DisruptNEX Edge System is not an automated trading system.
It does not execute trades or provide trade instructions.
All outputs are analytical and visual in nature and are intended to support discretionary decision-making.

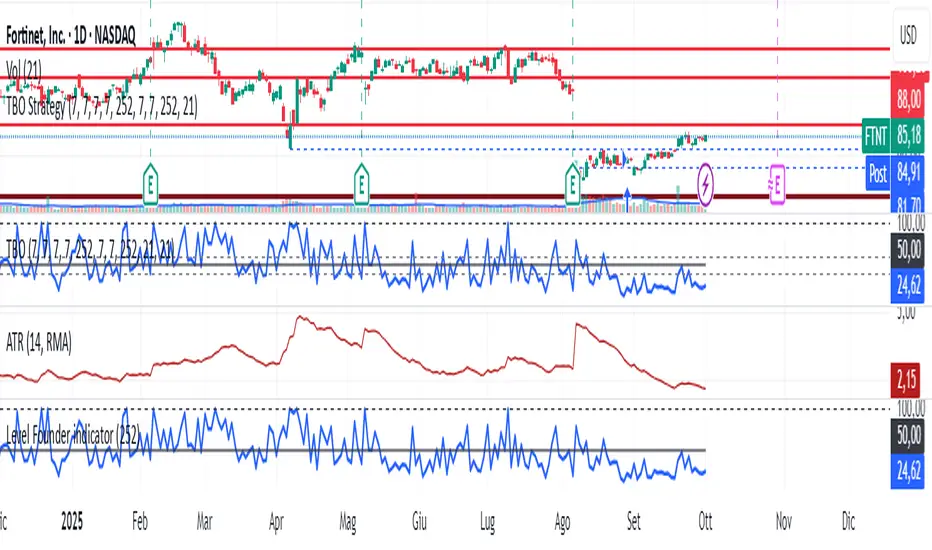
Level Founder indicatorQuesto strumento, ideato per l'individuazione dei livelli orizzontali sensibili si prepone l'obiettivo di semplificare la lettura tecnica dei grafici. Alla base di questo indicatore c'è il concetto di volatilità, inteso come scontro tra domanda ed offerta, come escursione delle forze nel campo di battaglia fino alla determinazione del prezzo finale di ogni candela. Di fatto, andando a cogliere quella che è la volatilità candela per candela, l'indicatore la calcola in termini assoluti rendendola un numericamente comparabile, in un range tra 0 e 100. Quando questo valore tocca i 100 si genera un picco di volatilità, il quale va ad identificare un punto di attenzione sul grafico di uno strumento. In corrispondenza di questi picchi si osserva dove la battaglia tra compratori e venditori si è conclusa, ovvero dove domanda ed offerta si sono incontrati per definire un prezzo: la chiusura di candela. In corrispondenza di tale prezzo si ha, quindi, un accordo certo tra domanda ed offerta dopo un periodo di contrattazione volatile, andando a certificare quello che è un livello di prezzo "sudato" per un determinato sottostante. Tale soglia si traduce in un livello orizzontale sensibile, che in futuro (avendo il mercato memoria degli scontri passati) potrà comportarsi da supporto o da resistenza, a seconda della situazione. In breve quindi, si traccia una linea orizzontale in corrispondenza delle chiusure di candela che condividono un picco sull'indicatore "Level Founder Indicator". Funziona su ogni time-frame e sottostante.
N.B. A ridosso di questi livelli si possono cercare pattern per l'operatività oppure cercare delle rotture di questi livelli per delle conferme/inversioni, spaziando dal trading intraday all'investimento di lungo periodo.
ENGLISH VERSION:
This tool, designed to identify sensitive horizontal levels, aims to simplify the technical reading of charts. This indicator is based on the concept of volatility, understood as the clash between supply and demand, the oscillation of forces on the battlefield until the final price of each candlestick is determined. By capturing the volatility candlestick by candlestick, the indicator calculates it in absolute terms, making it numerically comparable, within a range between 0 and 100. When this value reaches 100, a volatility spike is generated, which identifies a point of focus on an instrument's chart. At these peaks, we observe where the battle between buyers and sellers has concluded, that is, where supply and demand have met to define a price: the candlestick's close. At this price, therefore, a definite agreement between supply and demand occurs after a period of volatile trading, certifying what is a "hard-earned" price level for a given underlying asset. This threshold translates into a sensitive horizontal level, which in the future (given the market's memory of past clashes) could act as support or resistance, depending on the situation. In short, a horizontal line is drawn at the candlestick closes that share a peak on the "Level Founder Indicator." It works on any timeframe and underlying asset.
N.B.: Near these levels, you can look for trading patterns or look for breakouts of these levels for confirmations/reversals, ranging from intraday trading to long-term investing.
Script_Algo - Fibo Correction Strategy🔹 Core Concept
The strategy is built on combining Fibonacci retracement levels, candlestick pattern confirmation, and trend filtering for trade selection. It performs well on the 1-hour timeframe across many cryptocurrency pairs. Particularly on LINKUSDT over the past year and a half, despite the not very optimal 1:1 risk/reward ratio.
The logic is simple: after a strong impulse move, the price often retraces to key Fibonacci levels (specifically, the 61.8% level). If a confirming candlestick (pattern) appears at this moment, the strategy looks for an entry in the direction of the main trend.
🔹 Indicators Used in the Strategy
ATR (Average True Range) — Used to calculate the stop-loss and take-profit levels.
EMA (9 and 21) — Additional moving averages for assessing the direction of movement (not directly used in entry conditions, but the logic can be expanded to include them).
SMA (Trend Filter, 20 by default) — The trend direction filter. Trades are only opened in its direction.
Fibonacci Levels — The 61.8% retracement level is calculated based on the high and low of the previous candle.
🔹 Entry Conditions
🟢 Long (Buy):
Previous Candle:
Must be green (close higher than open).
Must have a body not smaller than a specified minimum.
The upper wick must not exceed 30% of the body size.
→ This filters out "weak" or "indecisive" candles.
Current Candle:
Price touches or breaches the Fibonacci 61.8% retracement level from the previous range.
Closes above this level.
Closes above the Trend Filter (SMA) line.
A position is opened only if there are no other open trades at the moment.
🔴 Short (Sell):
Previous Candle:
Must be red (close lower than open).
Must have a body not smaller than a specified minimum.
The lower wick must not exceed 30% of the body size.
Current Candle:
Price touches or breaches the Fibonacci 61.8% retracement level from the previous range.
Closes below this level.
Closes below the Trend Filter (SMA) line.
A trade is opened only if there are no other open positions.
🔹 Risk Management
Stop-Loss = ATR × multiplier (default is 5).
Take-Profit = ATR × the same multiplier.
Thus, the default risk/reward ratio is 1:1, but it can be easily adjusted by changing the coefficient. Although, strangely enough, this ratio has shown the best results on some assets on the 1-hour timeframe.
🔹 Chart Visualization
Fibonacci level for Long — Green line with circles.
Fibonacci level for Short — Red line with circles.
Trend Filter line (SMA) — Blue.
🔹 Strengths of the Strategy
✅ Utilizes a proven market pattern — retracement to the 61.8% level.
✅ Further filters entries using trend and candlestick patterns.
✅ Simple, transparent logic that is easy to expand (e.g., adding other Fib levels, an EMA filter, etc.).
🔹 Limitations
⚠️ Performs better in trending markets; can generate false signals during ranging (sideways) conditions.
⚠️ The fixed 1:1 risk/reward ratio is not always optimal and could be refined.
⚠️ Performance depends on the selected timeframe and ATR parameters.
📌 Summary:
The strategy seeks corrective entries in the direction of the trend, confirmed by candlestick patterns. It is versatile and can be applied to forex pairs, cryptocurrencies, and stocks.
⚠️ Not financial advice. Pay close attention to risk management to avoid blowing your account. The strategy is not repainting — I have personally verified it through real testing — but it may not necessarily replicate the same results in the future, as the market is constantly changing. Test it, profit, and good luck to everyone!

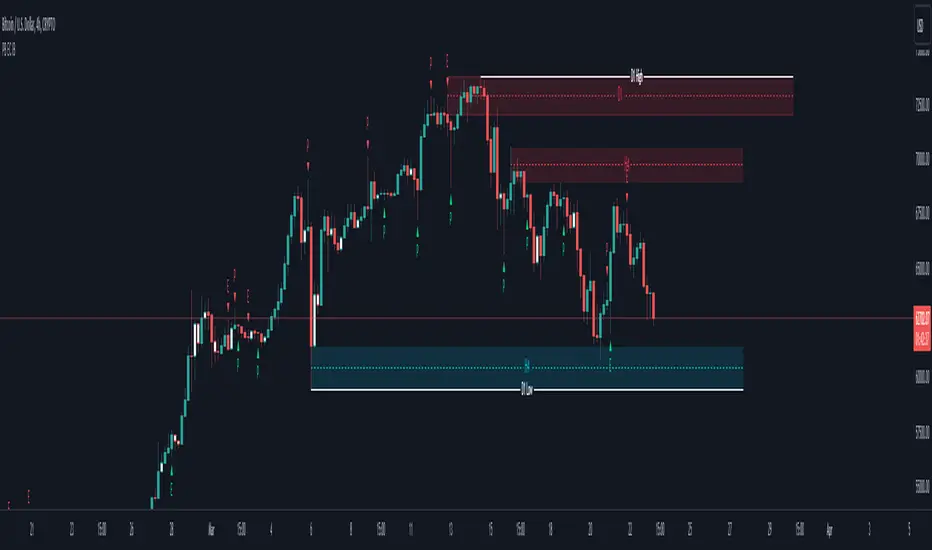
IB with Range PercentageThis Pine Script indicator for TradingView combines several powerful technical analysis tools to give traders a comprehensive view of market action:
Inside Bar Detection: Identifies the classic inside bar candlestick pattern.
Moving Averages: Provides multiple moving averages to help determine trend and potential support/resistance levels.
Information Table: Displays key market data in a concise table format.
1. Inside Bar Detection and Range
The indicator marks inside bars on the chart. An inside bar is a candlestick where its entire range (high and low) falls within the range of the preceding candlestick (often called the "mother bar"). This pattern often signifies market consolidation or indecision.
Customizable Marking: Users can choose the shape and color used to mark the inside bars, such as triangles, squares, or circles.
Range Percentage: A label shows the range of the inside bar as a percentage of the previous bar's low, providing a quantitative measure of its size.
Time Restriction: A setting allows displaying inside bars only for a specified number of past days, focusing analysis on recent price action.
Customizable Label Size: Users can choose the size of the range percentage label for optimal visibility.
2. Moving Averages for Trend Analysis
The indicator can plot up to four moving averages (MAs) on the chart. Moving averages smooth out price data to help identify trends and potential support and resistance levels.
User-Selectable MA Type: For each MA, traders can choose between Simple Moving Average (SMA) or Exponential Moving Average (EMA).
Customizable Length: Users can specify the length (number of periods) for each MA, such as 20, 50, 100, or 200.
Customizable Color: Each MA's line color can be chosen to suit personal preferences.
Trend Identification: When the price is above an MA, it suggests an uptrend, while prices below suggest a downtrend. The slope of the MA also indicates trend momentum.
3. Information Table for Key Data
A customizable information table is displayed on the chart, providing a quick overview of important market data.
Average Daily Range (ADR) Percentage: Shows the average daily range of the asset as a percentage, reflecting its historical volatility.
Distance from EMAs: Displays how far the current price is from the 10, 20, and 50 period Exponential Moving Averages. A positive percentage indicates the price is above the MA, while a negative percentage means it's below.
Customizable Table Elements: Users can choose the table's background color, text color, and text size for optimal readability.
How to Use This Indicator:
This indicator can be a valuable tool for traders using technical analysis:
Inside Bar Breakouts: Inside bars often precede breakouts. Traders can use the inside bar markings and range percentage to identify potential breakout opportunities.
Confirmation of Trends: Moving averages help confirm the direction of the trend, enabling traders to align their inside bar strategies with the prevailing market direction.
Support and Resistance: Moving averages can act as dynamic support and resistance levels. Traders can look for inside bars forming near these levels as potential entry or exit points.
Volatility and Range Analysis: The ADR percentage helps assess the normal daily range of an asset, which can be useful for setting realistic price targets and managing risk.
Risk Management: The distance from EMAs can alert traders to potential overextended moves, providing information for setting stop-loss or take-profit levels.
By combining these elements, this indicator provides a layered approach to market analysis, allowing traders to identify potential trading opportunities and manage risk effectively based on both candlestick patterns and trend-following indicators. Remember that no indicator guarantees success, and it's essential to use this tool in conjunction with other analysis techniques and proper risk management practices.

Pinbar signal 顶/底分型 指标Top/Bottom Fractal Indicator is a technical analysis tool used to identify potential reversal points in a market trend. It is based on the concept of fractal patterns, which consist of specific candlestick formations that signal local highs (top fractals) or lows (bottom fractals).
A top fractal typically occurs when the high of a middle candlestick is higher than the highs of the two candles on either side. This formation suggests that upward momentum may be weakening and a downward reversal could follow. Conversely, a bottom fractal forms when the low of a middle candlestick is lower than the lows of the two adjacent candles, indicating a potential shift from a downtrend to an uptrend.
This indicator is commonly used to spot market turning points, determine entry or exit signals, and enhance the reliability of other indicators such as Bollinger Bands or MACD. Because of its clear structure and reliable reversal signals, the Top/Bottom Fractal Indicator is also widely applied in wave theory and price action strategies.
A Pin Bar is a powerful candlestick pattern used in technical analysis to identify potential price reversals or continuations in the market. It is characterized by a small body located at one end of the candle and a long tail or wick on the opposite side, which indicates a strong rejection of price in that direction. A bullish Pin Bar has a long lower wick, showing that sellers pushed the price down but buyers regained control, suggesting a potential upward move. Conversely, a bearish Pin Bar has a long upper wick, indicating that buyers attempted to drive prices higher but were overpowered by sellers, hinting at a possible downward move. For high-probability setups, traders typically look for Pin Bars that form at key support or resistance levels, trendlines, or Fibonacci zones, and they often use them in combination with overall trend direction. Entry strategies include entering at the close of the Pin Bar, on a retracement, or above/below the wick with stop-losses placed beyond the wick’s extreme. When used correctly in the right context, the Pin Bar can be a highly effective signal in a trader’s toolkit.

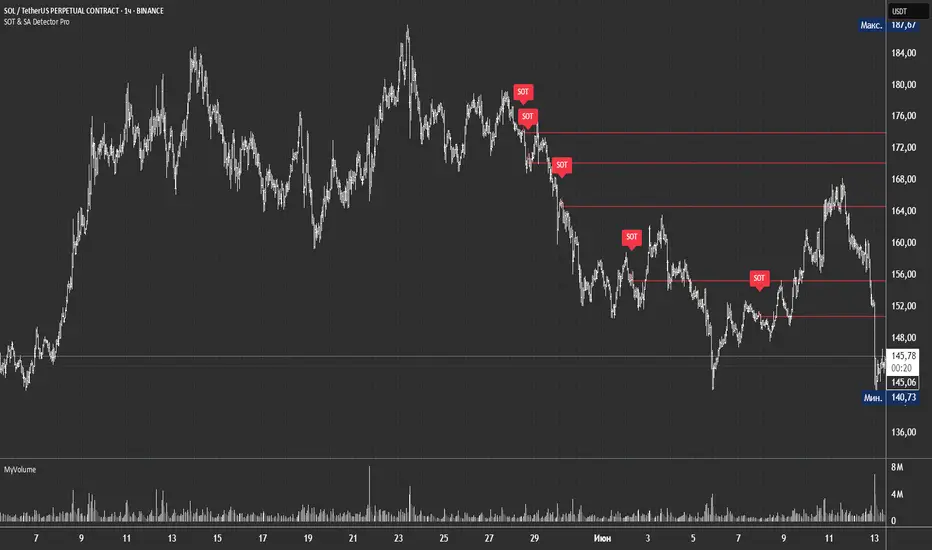
SOT & SA Detector ProSOT & SA Detector Pro- Advanced Reversal Pattern Recognition
OVERVIEW
The SOT & SA Detector is an educational indicator designed to identify potential market reversal points through systematic analysis of candlestick patterns, volume confirmation, and price wave structures. SOT (Shorting of Thrust) signals suggest potential bearish reversals after upward price movements, while SA (Selling Accumulation) signals indicate possible bullish reversals following downward trends. This tool helps traders recognize key market transition points by combining multiple technical criteria for enhanced signal reliability.
═══════════════════════════════════════════════════════════════
HOW IT WORKS
Technical Methodology
The indicator employs a multi-factor analysis approach that evaluates:
Wave Structure Analysis: Identifies minimum 2-bar directional waves (upward for SOT, downward for SA)
Price Delta Validation: Ensures closing price changes remain within specified percentage thresholds (default 0.3%) best 0.1.
Candlestick Tail Analysis: Measures rejection wicks using configurable tail multipliers
Volume Confirmation: Requires increased volume compared to previous periods
Pattern Confirmation: Validates signals through subsequent price action
Signal Generation Process
Pattern Recognition: Scans for qualifying candlestick formations with appropriate tail characteristics
Volume Verification: Confirms patterns with volume expansion using adjustable multiplier
Price Confirmation: Validates signals when price breaks and closes beyond pattern extremes
Signal Display: Places labeled markers and draws horizontal reference levels
Mathematical Foundation
Delta calculation: math.abs(close - close ) / close <= deltaPercent / 100
Tail analysis: (high - close ) >= tailMultiplier * (close - low ) for SOT
Volume filter: volume >= volume * volumeFactor
═══════════════════════════════════════════════════════════════
KEY FEATURES
Dual Pattern Recognition: Identifies both bullish (SA) and bearish (SOT) reversal candidates
Volume Integration: Incorporates volume analysis for enhanced signal validation
Customizable Parameters: Adjustable wave length, delta percentage, tail multiplier, and volume factor
Visual Clarity: Color-coded bar highlighting, labeled signals, and horizontal reference levels
Time-Based Filtering: Configurable analysis period to focus on recent market activity
Non-Repainting Signals: Confirmed signals remain stable and do not change with new price data
Alert System: Built-in notifications for both initial signals and subsequent confirmations
═══════════════════════════════════════════════════════════════
HOW TO USE
Signal Interpretation
Red SOT Labels: Appear above potential bearish reversal candles with downward-pointing markers
Green SA Labels: Display below potential bullish reversal candles with upward-pointing markers
Horizontal Lines: Extend from signal levels to provide ongoing reference points
Bar Coloring: Highlights qualifying pattern candles for visual emphasis
Trading Application
This indicator serves as an educational tool for pattern recognition and should be used in conjunction with additional analysis methods. Consider SOT signals as potential areas of selling pressure following upward moves, while SA signals may indicate buying interest after downward price action.
Best Practices
Combine with trend analysis and support/resistance levels
Consider overall market context and timeframe alignment
Use proper risk management techniques
Validate signals with additional technical indicators
═══════════════════════════════════════════════════════════════
SETTINGS
Analysis Days (Default: 20)
Controls the lookback period for signal detection. Higher values extend historical analysis while lower values focus on recent activity.
Minimum Bars in Wave (Default: 2)
Sets the minimum consecutive bars required to establish directional wave patterns. Increase for stronger trend confirmation.
Max Close Change % (Default: 0.3) best 0.1.
Defines acceptable closing price variation between consecutive bars. Lower values require tighter price consolidation.
Tail Multiplier (Default: 1.0) best 1.5 or more.
Adjusts sensitivity for candlestick tail analysis. Higher values require more pronounced rejection wicks.
Volume Factor (Default: 1.0)
Sets volume expansion threshold compared to previous period. Values above 1.0 require volume increases.
═══════════════════════════════════════════════════════════════
LIMITATIONS
Market Conditions
May produce false signals in highly volatile or low-volume conditions
Effectiveness varies across different market environments and timeframes
Requires sufficient volume data for optimal performance
Signal Timing
Signals appear after pattern completion, not in real-time during formation
Confirmation signals depend on subsequent price action
Historical signals do not guarantee future market behavior
Technical Constraints
Limited to analyzing price and volume data only
Does not incorporate fundamental analysis or external market factors
Performance may vary significantly across different trading instruments
═══════════════════════════════════════════════════════════════
IMPORTANT DISCLAIMERS
This indicator is designed for educational purposes and technical analysis learning. It does not constitute financial advice, investment recommendations, or trading signals. Past performance does not guarantee future results. Trading involves substantial risk of loss, and this tool should be used alongside proper risk management techniques and additional analysis methods.
Always conduct thorough analysis using multiple indicators and consider market context before making trading decisions. The SOT & SA patterns represent potential reversal points but do not guarantee price direction changes.
═══════════════════════════════════════════════════════════════
Credits: Original concept and Pine Script implementation by Everyday_Trader_X
Version: Pine Script v6 compatible
Category: Technical Analysis / Reversal Detection
Overlay: Yes (displays on price chart)
Malama's Heikin CountMalama's Heikin Count is a Pine Script indicator designed to enhance price action analysis by combining Heikin Ashi candlestick calculations with a normalized measurement of upper and lower shadow sizes. The indicator overlays Heikin Ashi candles on the chart and displays the relative sizes of upper and lower shadows as numerical labels (scaled from 1 to 10) for candles within the last two days, starting from 9:00 AM each day. This tool aims to help traders identify the strength of price movements and potential reversals by quantifying the significance of candlestick shadows in the context of Heikin Ashi’s smoothed price data. It is particularly useful for day traders and swing traders who rely on candlestick patterns to gauge market sentiment and momentum.
The indicator solves the problem of interpreting raw candlestick data by providing a smoothed visualization through Heikin Ashi candles and a simplified, numerical representation of shadow sizes. This allows traders to quickly assess whether a candle’s upper or lower shadow indicates strong buying or selling pressure, aiding in decision-making for entries, exits, or reversals.
Originality and Usefulness
Originality: While Heikin Ashi candles are a well-known technique for smoothing price data and reducing noise, Malama's Heikin Count introduces a novel feature by calculating and normalizing the sizes of upper and lower shadows relative to the total candle height. Unlike standard Heikin Ashi implementations, which focus solely on candle body trends, this indicator quantifies shadow proportions and presents them on a standardized 1–10 scale. This normalization makes it easier for traders to compare shadow significance across different timeframes and assets without needing to manually interpret raw measurements. The restriction of shadow size labels to the last two days from 9:00 AM ensures relevance for active trading sessions, avoiding clutter from older data.
Usefulness: The indicator is particularly valuable for traders who combine candlestick pattern analysis with trend-following strategies. By integrating Heikin Ashi’s trend-smoothing capabilities with shadow size metrics, it provides a unique perspective on market dynamics. For example, large upper shadows (high normalized values) may indicate rejection at resistance levels, while large lower shadows may suggest support or buying pressure. Unlike other open-source Heikin Ashi indicators, which typically focus only on candle plotting, this script’s shadow size normalization and time-based filtering offer a distinctive tool for intraday and short-term trading strategies.
Detailed Methodology ("How It Works")
The core logic of Malama's Heikin Count revolves around three main components: Heikin Ashi candle calculations, shadow size analysis, and time-based filtering for label display. Below is a breakdown of how these components work together:
Heikin Ashi Candle Calculations:
The script calculates Heikin Ashi candles to smooth price data and reduce market noise, making trends easier to identify.
Formulas:
haClose = (open + high + low + close) / 4: The Heikin Ashi close is the average of the current bar’s open, high, low, and close prices.
haOpen = na(haOpen ) ? (open + close) / 2 : (haOpen + haClose ) / 2: The Heikin Ashi open is either the average of the current bar’s open and close (for the first bar) or the average of the previous Heikin Ashi open and close.
haHigh = max(high, max(haOpen, haClose)): The Heikin Ashi high is the maximum of the current bar’s high, Heikin Ashi open, and Heikin Ashi close.
haLow = min(low, min(haOpen, haClose)): The Heikin Ashi low is the minimum of the current bar’s low, Heikin Ashi open, and Heikin Ashi close.
These calculations produce smoothed candles that emphasize trend direction and reduce the impact of short-term price fluctuations.
Shadow Size Analysis:
The script calculates the upper and lower shadows of each Heikin Ashi candle to assess market sentiment.
Formulas:
upperShadow = haHigh - max(haClose, haOpen): Measures the length of the upper shadow (distance from the top of the candle body to the high).
lowerShadow = min(haClose, haOpen) - haLow: Measures the length of the lower shadow (distance from the bottom of the candle body to the low).
totalHeight = haHigh - haLow: Calculates the total height of the candle (from high to low).
upperShadowPercentage = (upperShadow / totalHeight) * 100: Converts the upper shadow length to a percentage of the total candle height.
lowerShadowPercentage = (lowerShadow / totalHeight) * 100: Converts the lower shadow length to a percentage of the total candle height.
Normalization: The normalizeShadowSize function scales the shadow percentages to a 1–10 range using math.round(value / 10). This ensures that shadow sizes are presented in an easily interpretable format, where 1 represents a very small shadow (less than 10% of the candle height) and 10 represents a very large shadow (90–100% of the candle height). The normalization caps values between 1 and 10 for consistency.
Time-Based Filtering:
The script only displays shadow size labels for candles within the last two days, starting from 9:00 AM each day. This is achieved by calculating a start timestamp using timestamp(year(timenow), month(timenow), dayofmonth(timenow) - daysBack, startHour, startMinute), where daysBack = 2, startHour = 9, and startMinute = 0.
The condition time >= startTime ensures that labels are only plotted for candles within this time window, keeping the chart relevant for recent trading activity and avoiding clutter from older data.
Signal Generation:
The script does not generate explicit buy or sell signals but provides visual cues through shadow size labels. Large upper shadow sizes (e.g., 8–10) may indicate selling pressure or resistance, while large lower shadow sizes may suggest buying pressure or support. Traders can use these metrics in conjunction with the Heikin Ashi candle colors (green for bullish, red for bearish) to make trading decisions.
Strategy Results and Risk Management
Backtesting: The script is an indicator and does not include built-in backtesting or strategy logic for generating buy/sell signals. As such, it does not assume specific commission, slippage, or account sizing parameters. Traders using this indicator should incorporate it into their existing strategies, applying their own risk management rules.
Risk Management Guidance:
Traders can use the shadow size labels to inform risk management decisions. For example, a large upper shadow (e.g., 8–10) at a resistance level may prompt a trader to set a tighter stop-loss above the candle’s high, anticipating a potential reversal. Conversely, a large lower shadow at a support level may suggest a wider stop-loss below the low to account for volatility.
Default settings (e.g., 2-day lookback, 9:00 AM start) are designed to focus on recent price action, which is suitable for intraday and short-term swing trading. Traders should combine the indicator with other tools (e.g., support/resistance levels, trendlines) to define risk limits, such as risking 5–10% of equity per trade.
The indicator does not enforce specific risk management settings, allowing traders to customize their approach based on their risk tolerance and trading style.
User Settings and Customization
The script includes the following user-customizable inputs:
Days Back (daysBack = 2):
Description: Controls the lookback period for displaying shadow size labels. The default value of 2 means labels are shown for candles within the last two days.
Impact: Increasing daysBack extends the time window for label display, which may be useful for longer-term analysis but could clutter the chart. Decreasing it focuses on more recent data, ideal for intraday trading.
Start Hour (startHour = 9) and Start Minute (startMinute = 0):
Description: Defines the start time of the trading day (default is 9:00 AM). Labels are only shown for candles after this time each day within the lookback period.
Impact: Traders can adjust these settings to align with their preferred trading session (e.g., 9:30 AM for U.S. market open). Changing the start time shifts the time window for label display, affecting which candles are analyzed.
These settings allow traders to tailor the indicator to their trading timeframe and session preferences, ensuring that the shadow size labels remain relevant to their analysis.
Visualizations and Chart Setup
The indicator plots the following elements on the chart:
Heikin Ashi Candles:
Plotted using plotcandle(haOpen, haClose, haHigh, haLow), these candles overlay the standard price chart.
Color Coding: Green candles indicate bullish momentum (Heikin Ashi close ≥ open), while red candles indicate bearish momentum (Heikin Ashi close < open).
These candles provide a smoothed view of price trends, making it easier to identify trend direction and continuations.
Shadow Size Labels:
Upper Shadow Labels: Displayed above each candle at the Heikin Ashi high, showing the normalized upper shadow size (1–10). These labels are green with white text and use the label.style_label_down style for clear visibility.
Lower Shadow Labels: Displayed below each candle at the Heikin Ashi low, showing the normalized lower shadow size (1–10). These labels are red with white text and use the label.style_label_up style.
Labels are only shown for candles within the last two days from 9:00 AM, ensuring that only recent and relevant data is visualized.
Debugging Labels (Optional):
A blue label at the bottom of the chart displays the text "Upper: Lower: " for each candle, showing both shadow sizes for debugging purposes. This can be removed or commented out if not needed, as it is primarily for development use.
The visualizations are designed to be minimal and focused, ensuring that traders can quickly interpret the Heikin Ashi trend and shadow size metrics without unnecessary clutter. The use of color-coded candles and labels enhances readability, while the time-based filtering keeps the chart clean and relevant.

Canuck Trading IndicatorOverview
The Canuck Trading Indicator is a versatile, overlay-based technical analysis tool designed to assist traders in identifying potential trading opportunities across various timeframes and market conditions. By combining multiple technical indicators—such as RSI, Bollinger Bands, EMAs, VWAP, MACD, Stochastic RSI, ADX, HMA, and candlestick patterns—the indicator provides clear visual signals for bullish and bearish entries, breakouts, long-term trends, and options strategies like cash-secured puts, straddles/strangles, iron condors, and short squeezes. It also incorporates 20-day and 200-day SMAs to detect Golden/Death Crosses and price positioning relative to these moving averages. A dynamic table displays key metrics, and customizable alerts help traders stay informed of market conditions.
Key Features
Multi-Timeframe Adaptability: Automatically adjusts parameters (e.g., ATR multiplier, ADX period, HMA length) based on the chart's timeframe (minute, hourly, daily, weekly, monthly) for optimal performance.
Comprehensive Signal Generation: Identifies short-term entries, breakouts, long-term bullish trends, and options strategies using a combination of momentum, trend, volatility, and candlestick patterns.
Candlestick Pattern Detection: Recognizes bullish/bearish engulfing, hammer, shooting star, doji, and strong candles for precise entry/exit signals.
Moving Average Analysis: Plots 20-day and 200-day SMAs, detects Golden/Death Crosses, and evaluates price position relative to these averages.
Dynamic Table: Displays real-time metrics, including zone status (bullish, bearish, neutral), RSI, MACD, Stochastic RSI, short/long-term trends, candlestick patterns, ADX, ROC, VWAP slope, and MA positioning.
Customizable Alerts: Over 20 alert conditions for entries, exits, overbought/oversold warnings, and MA crosses, with actionable messages including ticker, price, and suggested strategies.
Visual Clarity: Uses distinct shapes, colors, and sizes to plot signals (e.g., green triangles for bullish entries, red triangles for bearish entries) and overlays key levels like EMA, VWAP, Bollinger Bands, support/resistance, and HMA.
Options Strategy Signals: Suggests opportunities for selling cash-secured puts, straddles/strangles, iron condors, and capitalizing on short squeezes.
How to Use
Add to Chart: Apply the indicator to any TradingView chart by selecting "Canuck Trading Indicator" from the Pine Script library.
Interpret Signals:
Bullish Signals: Green triangles (short-term entry), lime diamonds (breakout), blue circles (long-term entry).
Bearish Signals: Red triangles (short-term entry), maroon diamonds (breakout).
Options Strategies: Purple squares (cash-secured puts), yellow circles (straddles/strangles), orange crosses (iron condors), white arrows (short squeezes).
Exits: X-cross shapes in corresponding colors indicate exit signals.
Monitor: Gray circles suggest holding cash or monitoring for setups.
Review Table: Check the top-right table for real-time metrics, including zone status, RSI, MACD, trends, and MA positioning.
Set Alerts: Configure alerts for specific signals (e.g., "Short-Term Bullish Entry" or "Golden Cross") to receive notifications via TradingView.
Adjust Inputs: Customize input parameters (e.g., RSI period, EMA length, ATR period) to suit your trading style or market conditions.
Input Parameters
The indicator offers a wide range of customizable inputs to fine-tune its behavior:
RSI Period (default: 14): Length for RSI calculation.
RSI Bullish Low/High (default: 35/70): RSI thresholds for bullish signals.
RSI Bearish High (default: 65): RSI threshold for bearish signals.
EMA Period (default: 15): Main EMA length (15 for day trading, 50 for swing).
Short/Long EMA Length (default: 3/20): For momentum oscillator.
T3 Smoothing Length (default: 5): Smooths momentum signals.
Long-Term EMA/RSI Length (default: 20/15): For long-term trend analysis.
Support/Resistance Lookback (default: 5): Periods for support/resistance levels.
MACD Fast/Slow/Signal (default: 12/26/9): MACD parameters.
Bollinger Bands Period/StdDev (default: 15/2): BB settings.
Stochastic RSI Period/Smoothing (default: 14/3/3): Stochastic RSI settings.
Uptrend/Short-Term/Long-Term Lookback (default: 2/2/5): Candles for trend detection.
ATR Period (default: 14): For volatility and price targets.
VWAP Sensitivity (default: 0.1%): Threshold for VWAP-based signals.
Volume Oscillator Period (default: 14): For volume surge detection.
Pattern Detection Threshold (default: 0.3%): Sensitivity for candlestick patterns.
ROC Period (default: 3): Rate of change for momentum.
VWAP Slope Period (default: 5): For VWAP trend analysis.
TradingView Publishing Compliance
Originality: The Canuck Trading Indicator is an original script, combining multiple technical indicators and custom logic to provide unique trading signals. It does not replicate existing public scripts.
No Guaranteed Profits: This indicator is a tool for technical analysis and does not guarantee profits. Trading involves risks, and users should conduct their own research and risk management.
Clear Instructions: The description and usage guide are detailed and accessible, ensuring users understand how to apply the indicator effectively.
No External Dependencies: The script uses only built-in Pine Script functions (e.g., ta.rsi, ta.ema, ta.vwap) and requires no external libraries or data sources.
Performance: The script is optimized for performance, using efficient calculations and adaptive parameters to minimize lag on various timeframes.
Visual Clarity: Signals are plotted with distinct shapes and colors, and the table provides a concise summary of market conditions, enhancing usability.
Limitations and Risks
Market Conditions: The indicator may generate false signals in choppy or low-liquidity markets. Always confirm signals with additional analysis.
Timeframe Sensitivity: Performance varies by timeframe; test settings on your preferred chart (e.g., 5-minute for day trading, daily for swing trading).
Risk Management: Use stop-losses and position sizing to manage risk, as suggested in alert messages (e.g., "Stop -20%").
Options Trading: Options strategies (e.g., straddles, iron condors) carry unique risks; consult a financial advisor before trading.
Feedback and Support
For questions, suggestions, or bug reports, please leave a comment on the TradingView script page or contact the author via TradingView. Your feedback helps improve the indicator for the community.
Disclaimer
The Canuck Trading Indicator is provided for educational and informational purposes only. It is not financial advice. Trading involves significant risks, and past performance is not indicative of future results. Always perform your own due diligence and consult a qualified financial advisor before making trading decisions.

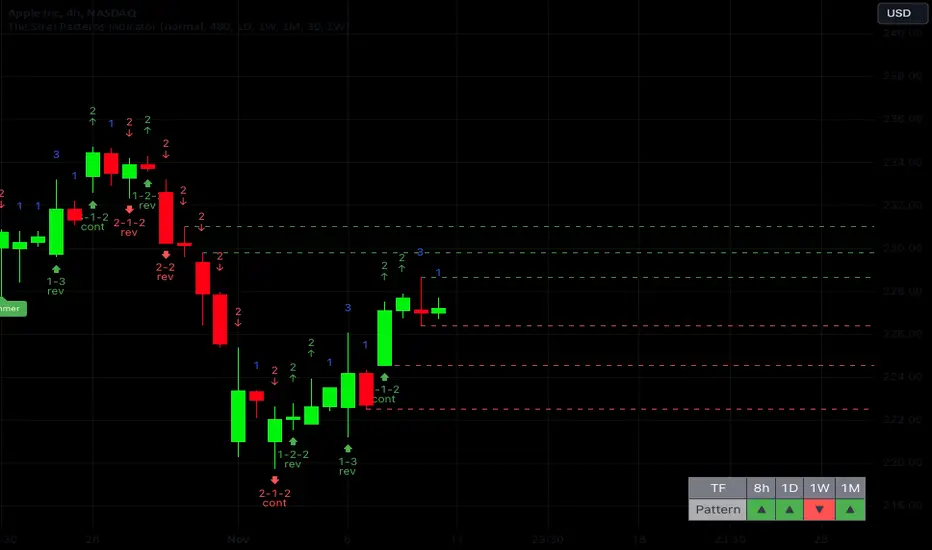
The Strat Patterns Indicator v1.0The Strat Patterns Indicator is a tool that draws Strat patterns in real-time, highlights Strat scenarios, key levels, and helps traders effectively apply the Strat trading strategy.
It combines features such as pattern recognition, timeframe continuity analysis, target level highlighting, and custom alerts to simplify trading decisions and maximize profit potential.
Display All Strat Patterns
The Strat Patterns Indicator shows all Strat patterns directly on your chart, making it easier to spot trading opportunities in real-time. You can choose to show or hide specific patterns based on your preferences. The patterns include:
2-2 Continuation
2-2 Reversal
3-2-2 Reversal
2-1-2 Continuation
2-1-2 Reversal
1-2-2 Reversal
3-1-2 Continuation
1-3 Reversal
3-1-2 Reversal
Highlight Major Candlestick Patterns
The indicator highlights important candlestick formations that are crucial for forecasting the major trend reversals in the market. These candlestick patterns include:
Hammer
Shooting Star
Doji
Gravestone Doji
Dragonfly Doji
Morning Doji Star
Evening Doji Star
By showcasing these patterns, the indicator helps traders quickly identify possible reversals or continuations, providing an extra layer of confirmation for trading decisions.
Timeframe Continuity Table
This indicator includes a customizable table that displays timeframe continuity, allowing you to align your trades with the overall market trend. You can select up to four higher timeframes to monitor, helping you ensure that your trades follow the broader trend direction.
This feature makes it easy to identify whether the market trend is aligned across multiple timeframes, enhancing your ability to make high-probability trades.
Show Target Levels (Previous Highs/Lows)
The indicator highlights target levels based on previous highs or lows, making it easier to set realistic profit targets and manage trades effectively.
By identifying these key levels, you can better gauge potential price movements and plan your trades with greater precision, ensuring that you maximize profit opportunities while minimizing risk.
Highlight Higher Timeframe Target Levels
This feature allows you to display target levels from a higher timeframe while trading on a lower timeframe.
For example, if you are trading on a 4-hour chart, you can choose to show daily target levels, including high/low levels and Fibonacci golden ratios. This helps you identify more significant profit targets and enhances your ability to capture larger moves while staying aligned with the overall trend.
Breakout Confirmation
The indicator provides an option to display the previous candlestick's high or low value, helping you confirm breakouts in Strat patterns. This feature is useful for validating whether a true breakout has occurred, giving you greater confidence in your trade entries and helping you avoid potential false breakouts.
Alerts for Strat Patterns
With this feature, you can set up alerts that trigger whenever a Strat pattern forms. This ensures you never miss a trading opportunity, keeping you informed and ready to act when key patterns emerge. The alerts provide real-time notifications, allowing you to stay on top of market movements without constantly monitoring your charts.
Engulfing BoxThe Engulfing Box indicator is a custom script designed to visually highlight and track bullish and bearish engulfing candlestick patterns on a price chart. These patterns are often used to identify potential reversal points, making them valuable for technical analysis. The script dynamically draws colored boxes around these patterns, helping users easily spot them in the price action.
Key Features:
Bullish Engulfing Pattern: When a candlestick fully engulfs the previous bearish candle (i.e., the close of the current candle is higher than the open of the previous candle, and the open is lower than the close of the previous candle), the script draws a green box around the bullish engulfing candle. This box is drawn from the open of the previous candle to the low of the previous candle.
Bearish Engulfing Pattern: When a candlestick fully engulfs the previous bullish candle (i.e., the close of the current candle is lower than the open of the previous candle, and the open is higher than the close of the previous candle), a red box is drawn around the bearish engulfing candle. This box is drawn from the open of the previous candle to the high of the previous candle.
Dynamic Box Management: Once an engulfing pattern is detected, a box is drawn with the following attributes:
Bullish Engulfing Box: Green, with a transparent background.
Bearish Engulfing Box: Red, with a transparent background.
The box will adjust its color to gray if the price moves past certain thresholds, indicating that the engulfing pattern may no longer be as relevant.
Max Pattern Tracking: The script limits the number of engulfing boxes tracked on the chart to prevent clutter. The maximum number of bullish and bearish engulfing patterns shown is customizable (set to 500 by default), and once this limit is exceeded, older boxes are deleted to maintain a clean chart.
Pattern Expiry: Boxes are deleted if price action moves beyond the pattern’s range, ensuring that outdated signals are removed. If the low price falls below the bottom of the bullish engulfing box, or the high price rises above the top of the bearish engulfing box, the respective box is removed. Additionally, if the low price moves below the top of the bullish box or the high price exceeds the bottom of the bearish box, the box's color is changed to a more neutral tone.
How it Works:
Pattern Detection: The script compares the current price data with the previous candlestick to detect the bullish or bearish engulfing patterns.
Box Creation: If a pattern is detected, a colored box is drawn around the candle to visually highlight the pattern.
Pattern Expiry and Cleanup: The script continuously monitors past boxes. If the price moves too far from the box’s range, the box is either deleted or altered to reflect the reduced significance of the pattern.
B ox Count Limit: To avoid clutter, the script ensures that no more than 500 bullish or bearish engulfing boxes are shown at any time.
Customization:
The number of previous bars to scan for engulfing patterns can be adjusted (maxBarsback).
The maximum number of patterns displayed at any time can be modified.

Price Action StrategyThe **Price Action Strategy** is a tool designed to capture potential market reversals by utilizing classic reversal candlestick patterns such as Hammer, Shooting Star, Doji, and Pin Bar near dinamic support and resistance levels.
***Note to moderators
- The moving average was removed from the strategy because it was not suitable for the strategy and not participating in the entry or exit criteria.
- The moving average length has been replaced/renamed by the support/resistance lenght.
- The bullish engulfing and bearish engulfing patterns were also removed because in practice they were not working as entry criteria, since the candle price invariably closes far from the support/resistance level even considering the sensitivity range. There was no change in the backtest results after removing these patterns.
### Key Elements of the Strategy
1. Support and Resistance Levels
- Support and resistance are pivotal price levels where the asset has previously struggled to move lower (support) or higher (resistance). These levels act as psychological barriers where buying interest (at support) or selling interest (at resistance) often increases, potentially causing price reversals.
- In this strategy, support is calculated as the lowest low and resistance as the highest high over a 16-period length. When the price nears these levels, it indicates possible zones for a reversal, and the strategy looks for specific candlestick patterns to confirm an entry.
2. Candlestick Patterns
- This strategy uses classic reversal patterns, including:
- **Hammer**: Indicates a buy signal, suggesting rejection of lower prices.
- **Shooting Star**: Suggests a sell signal, showing rejection of higher prices.
- **Doji**: Reflects indecision and potential reversal.
- **Pin Bar**: Represents price rejection with a long shadow, often signaling a reversal.
By combining these reversal patterns with the proximity to dinamic support or resistance levels, the strategy aims to capture potential reversal movements.
3. Sensitivity Level
- The sensitivity parameter adjusts the acceptable range (Default 0.018 = 1.8%) around support and resistance levels within which reversal patterns can trigger trades (i.e. the closing price of the candle must occur within the specified range defined by the sensitivity parameter). A higher sensitivity value expands this range, potentially leading to less accurate signals, as it may allow for more false positives.
4. Entry Criteria
- **Buy (Long)**: A Hammer, Doji, or Pin Bar pattern near support.
- **Sell (Short)**: A Shooting Star, Doji, or Pin Bar near resistance.
5. Exit criteria
- Take profit = 9.5%
- Stop loss = 16%
6. No Repainting
- The Price Action Strategy is not subject to repainting.
7. Position Sizing by Equity and risk management
- This strategy has a default configuration to operate with 35% of the equity. The stop loss is set to 16% from the entry price. This way, the strategy is putting at risk about 16% of 35% of equity, that is, around 5.6% of equity for each trade. The percentage of equity and stop loss can be adjusted by the user according to their risk management.
8. Backtest results
- This strategy was subjected to deep backtest and operations in replay mode on **1000000MOGUSDT.P**, with the inclusion of transaction fees at 0.12% and slipagge of 5 ticks, and the past results have shown consistent profitability. Past results are no guarantee of future results. The strategy's backtest results may even be due to overfitting with past data.
9. Chart Visualization
- Support and resistance levels are displayed as green (support) and red (resistance) lines.
- Only the candlestick pattern that generated the entry signal to triger the trade is identified and labeled on the chart. During the operation, the occurrence of new Doji, Pin Bar, Hammer and Shooting Star patterns will not be demonstrated on the chart, since the exit criteria are based on percentage take profit and stop loss.
Doji:
Pin Bar and Doji
Shooting Star and Doji
Hammer
10. Default settings
Chart timeframe: 20 min
Moving average lenght: 16
Sensitivity: 0.018
Stop loss (%): 16
Take Profit (%): 9.5
BYBIT:1000000MOGUSDT.P

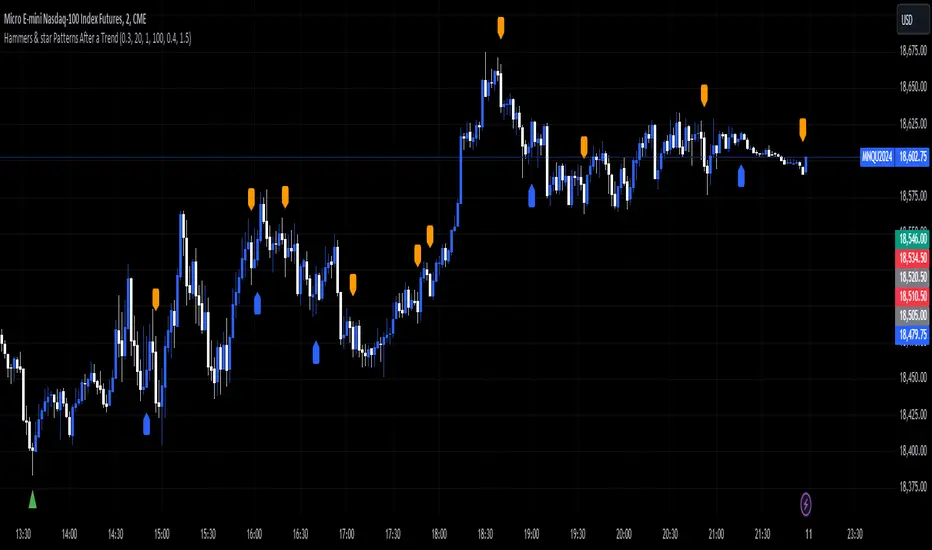
Hammers & star Patterns After a Trend
1. **Candlestick Patterns Detection:**
- **Hammers** and **Inverted Hammers** are specific candlestick patterns that can indicate potential reversals in the market.
- **Hammer**: A candle with a small body and a long lower wick, showing a possible reversal after a downtrend.
- **Inverted Hammer**: A candle with a small body and a long upper wick, indicating a possible reversal after an uptrend.
2. **Volume Consideration:**
- The script checks if these patterns occur with **high trading volume**. If the volume is significantly higher than the average volume over a certain period, the pattern is highlighted.
3. **Trend Detection:**
- The script looks for a significant trend before the pattern appears:
- **Downtrend**: A significant downward movement in price is required before a Hammer is considered.
- **Uptrend**: A significant upward movement is required before an Inverted Hammer is considered.
4. **Additional Patterns:**
- **Morning Star** and **Evening Star** patterns are also detected:
- **Morning Star**: A three-candle pattern where the first candle is a large bearish candle, followed by a small-bodied candle, and then a large bullish candle, indicating a potential reversal from downtrend to uptrend.
- **Evening Star**: The opposite pattern, signaling a potential reversal from uptrend to downtrend.
5. **Visual Indicators:**
- The script **plots arrows** and **labels** on the chart to show where these patterns occur:
- **Hammers** and **Inverted Hammers** are marked with triangle arrows.
- **Morning Stars** and **Evening Stars** are marked with labels.
In summary, this script helps traders identify key candlestick patterns that may signal potential reversals in price trends, with special emphasis on patterns that occur with high volume and after significant price movements.
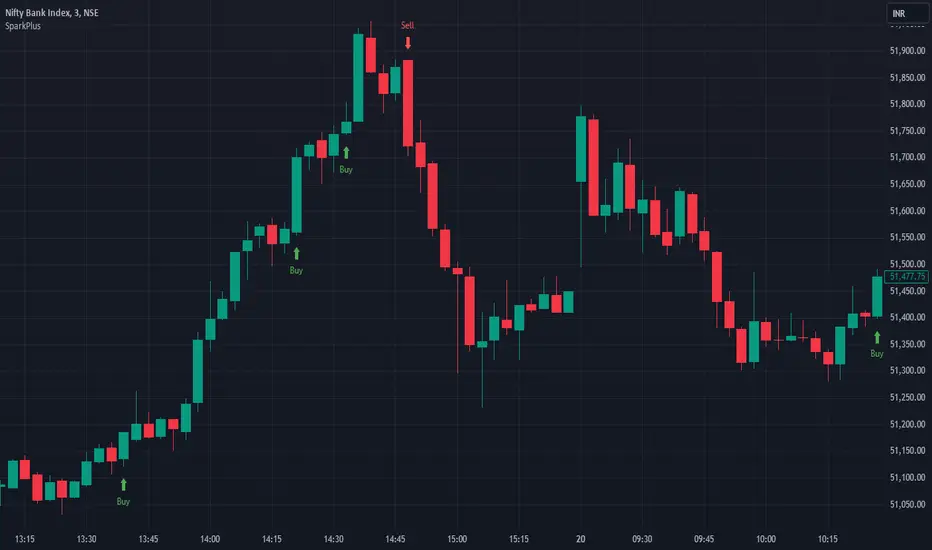
SparkPlusSparkPlus Indicator
The SparkPlus indicator is an advanced tool designed for real-time options trading, leveraging a unique combination of candlestick patterns and custom trade management logic. Unlike standard candlestick pattern indicators, SparkPlus integrates multiple layers of functionality to provide traders with actionable insights and comprehensive trade management. Here are the key features that set SparkPlus apart:
1. Unique Candlestick Patterns:
- Bullish Spark Pattern: Detects specific bullish candlestick formations over three bars, ensuring higher reliability in identifying upward trends.
- Bearish Spark Pattern: Identifies bearish formations over three bars, providing precise signals for potential downward movements.
2. Integrated Trade Management:
- The indicator not only signals potential trades but also manages them by setting entry points, stop loss, and multiple target levels.
- Dynamic Stop Loss and Target Calculation: The stop loss and target levels are dynamically calculated based on the volatility (using ATR), ensuring they adapt to market conditions.
3. Real-time Alerts:
- Provides real-time alerts for trade setups, entry points, stop loss hits, and target achievements, keeping traders informed and ready to act.
4. Detailed Trade Dashboard:
- A comprehensive dashboard is integrated into the chart to track the number of trades triggered, wins, losses, and points gained or lost for both long and short trades.
- This dashboard updates in real-time, providing an at-a-glance overview of the trading performance.
5. Visual Trade Representation:
- The script draws lines for entry, stop loss, and target levels on the chart, offering a clear visual representation of each trade.
- This feature helps traders easily track and manage active trades directly from the chart.
6. Enhanced User Control:
- Users can toggle specific features such as stop loss/target display and Spark alerts, allowing for a customizable trading experience.
By combining these elements, SparkPlus offers a robust and versatile tool for traders, enhancing their ability to make informed decisions and manage trades effectively.
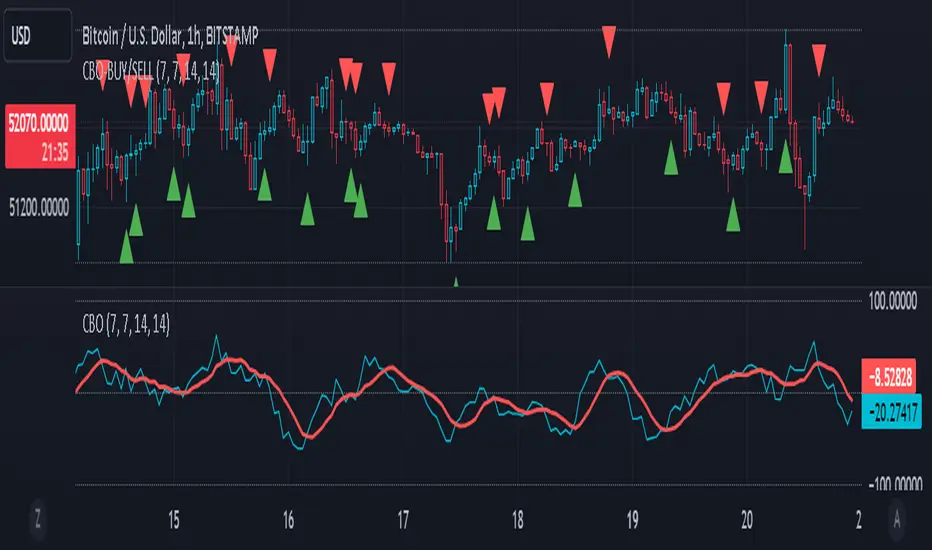
CBO (Candle Bias Oscillator)The Candle Bias Oscillator (CBO) with volume and ATR scaling is a unique technical analysis tool designed to capture market sentiment through the analysis of candlestick patterns, volume momentum, and market volatility. This indicator is built on the foundation of assessing the bias within a candlestick's body and wicks, adjusted for market volatility using the Average True Range (ATR), and further refined by comparing the Rate of Change (ROC) in volume and the adjusted bias. The culmination of these calculations results in the CBO, a smoothed oscillator that highlights potential market turning points through divergence analysis.
Key Features:
Bias Calculations: Utilizes the relationship between the candle's body and wicks to determine the market's immediate bias, offering a nuanced view beyond simple price action. Have you ever wanted to quantify exactly how bullish or bearish a particular candle or candlestick pattern is? Whether it's dojis, hammers, engulfing, gravestones, evening morning star, three soldiers etc. you don't have to memorize 50 candlestick patterns anymore.
Volatility Adjustment: Employs the ATR to adjust the bias calculation, ensuring the oscillator remains relevant across varying market conditions by accounting for volatility.
Momentum and Divergence: Measures the momentum in volume and bias through ROC calculations, identifying divergence that may signal reversals or significant price movements.
Signal Line: A smoothed version of the CBO, derived from its own values, serving as a benchmark for identifying potential crossovers and divergences.
Utility and Application:
The CBO with Divergence Scaling is developed for traders who seek a deeper understanding of market dynamics beyond price movements alone. It is particularly useful for identifying potential reversals or continuation patterns early, by highlighting divergence between market sentiment (as expressed through candlestick bias) and actual volume movements. In this way, it aligns us retail traders with institutional traders and smart money. This indicator is versatile and can be applied across various time frames and market instruments, offering value to both short-term traders and long-term investors.
How to Use:
Trend Identification: The direction and value of the CBO provide insights into the prevailing market trend. A positive oscillator value may indicate bullish sentiment, while a negative value suggests bearish sentiment.
Signal Line Crossovers: Crossovers between the CBO and its signal line can be used as potential buy or sell signals. A crossover above the signal line might indicate a buying opportunity, whereas a crossover below could suggest a selling point.
Divergence: Discrepancies between the CBO and price action (especially when confirmed by volume ROC) can highlight potential reversals.
Customization and Parameters: This script allows users to adjust several parameters, including oscillator periods, signal line periods, ATR periods, and ROC periods for divergence, to best fit their trading strategy and the characteristics of the market they are analyzing.
Conclusion:
The Custom Bias Oscillator with Divergence Scaling is a comprehensive tool designed to offer traders a multi-faceted view of market conditions, combining elements of price action, volatility, and momentum. By integrating these aspects into a single indicator, it aims to provide a more rounded and actionable insight into market trends and potential turning points.
To comply with best practices and ensure clarity regarding the informational nature of the Custom Bias Oscillator (CBO) tool, it's crucial to include a disclaimer about the non-advisory nature of the script. Here's a suitable disclaimer that you can add to the end of your script description or publication:
Disclaimer:
The Custom Bias Oscillator (CBO) with Divergence Scaling and its accompanying analysis are provided as tools for educational and informational purposes only and should not be construed as financial advice. The creator of this indicator does not guarantee any specific outcomes or profit, and all users should be aware of the risks involved in trading and investing. Users should conduct their own research and consult with a professional financial advisor before making any investment decisions. The use of this indicator is at the user's own risk, and the creator bears no responsibility for any direct or consequential loss arising from any use of this tool or the information provided herein.