Grand Master's Candlestick Dominance (ATR Enhanced)### Grand Master's Candlestick Dominance (ATR Enhanced)
**Overview**
Unleash the ancient wisdom of Japanese candlestick charting with a modern twist! This comprehensive Pine Script v5 strategy and indicator scans for over 75 classic and advanced candlestick patterns (bullish, bearish, and neutral), assigning dynamic strength scores (1-10) to each for precise signal filtering. Enhanced with Average True Range (ATR) for volatility-aware body size validation, it dominates the markets by combining timeless pattern recognition with robust confirmation layers. Whether used as a backtestable strategy or visual indicator, it empowers traders to spot high-probability reversals, continuations, and indecision setups with surgical accuracy.
Inspired by Steve Nison's *Japanese Candlestick Charting Techniques*, this tool elevates pattern analysis beyond basics—think Hammers, Engulfing patterns, Morning Stars, and rare gems like Abandoned Baby or Concealing Baby Swallow—all consolidated into intelligent arrays for real-time averaging and prioritization.
**Key Features**
- **Extensive Pattern Library**:
- **Bullish (25+ patterns)**: Hammer (8.0), Bullish Engulfing (10.0), Morning Star (7.0), Three White Soldiers (9.0), Dragonfly Doji (8.0), and more (e.g., Rising Three, Unique Three River Bottom).
- **Bearish (25+ patterns)**: Hanging Man (8.0), Bearish Engulfing (10.0), Evening Star (7.0), Three Black Crows (9.0), Gravestone Doji (8.0), and exotics like Upside Gap Two Crows or Stalled Pattern.
- **Neutral/Indecision (34+ patterns)**: Doji variants (Long-Legged, Four Price), Spinning Tops, Harami Crosses, and multi-bar setups like Upside Tasuki Gap or Advancing Block.
Each pattern includes duration tracking (1-5 bars) and ATR-adjusted body/shadow criteria for relevance in volatile conditions.
- **Smart Confirmation Filters** (All Toggleable):
- **Trend Alignment**: 20-period SMA (customizable) ensures entries align with the prevailing trend; optional higher timeframe (e.g., Daily) MA crossover for multi-timeframe confluence.
- **Support/Resistance (S/R)**: Pivot-based levels with 0.01% tolerance to confirm bounces or breaks.
- **Volume Surge**: 20-period volume MA with 1.5x spike multiplier to validate momentum.
- **ATR Body Sizing**: Filters small bodies (<0.3x ATR) and long bodies (>0.8x ATR) for context-aware pattern reliability.
- **Follow-Through**: Ensures post-pattern confirmation via bullish/bearish closes or closes beyond prior bars.
Minimum average strength (default 7.0) and individual pattern thresholds (5.0) prevent weak signals.
- **Entry & Exit Logic**:
- **Long Entry**: Bullish average strength ≥7.0 (outweighing bearish), uptrend, volume spike, near support, follow-through, and HTF alignment.
- **Short Entry**: Mirror for bearish dominance in downtrends near resistance.
- **Exits**: Bearish/neutral shift, or fixed TP (5%) / SL (2%)—pyramiding disabled, 10% equity sizing.
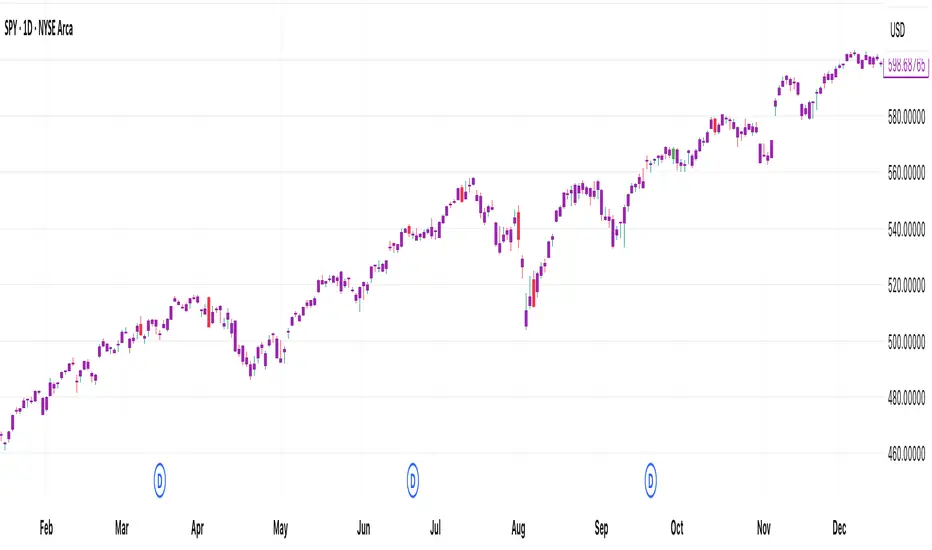
- Backtest range: Jan 1, 2020 – Dec 31, 2025 (editable). Initial capital: $10,000.
- **Interactive Dashboard** (Top-Right Panel):
Real-time insights including:
- Market phase (e.g., "Bullish Phase (Avg Str: 8.2)"), active pattern (e.g., "BULLISH: Bullish Engulfing (Str: 10.0, Bars: 2)"), and trend status.
- Strength breakdowns (Bull/Bear/Neutral counts & averages).
- Filter status (e.g., "Volume: ✔ Spike", "ATR: Enabled (L:0.8, S:0.3)").
- Backtest stats: Total trades, win rate, streak, and last entry/exit details (price & timestamp).
Toggle mode: Strategy (live trades) or Indicator (signals only).
- **Advanced Alerts** (15+ Toggleable Types):
Set up via TradingView's "Any alert() function call" for bar-close triggers:
- Entry/Exit signals with strength & pattern details.
- Strong patterns (≥2 bullish/bearish), neutral indecision, volume spikes.
- S/R breakouts, HTF reversals, high-confidence singles (≥8.0 strength).
- Conflicting signals, MA crossovers, ATR volatility bursts, multi-bar completions.
Example: "STRONG BULLISH PATTERN detected! Strength: 9.5 | Top Pattern: Three White Soldiers | Trend: Up".
**Customization & Usage Tips**
- **Inputs Groups**: Strategy toggles, confirmations, exits, backtest dates, and 15+ alert switches—all intuitively grouped.
- **Optimization**: Tune min strengths for aggressive (lower) or conservative (higher) trading; enable/disable filters to suit your style (e.g., disable S/R for scalping).
- **Best For**: Forex, stocks, crypto on 1H–Daily charts. Test on historical data to refine TP/SL.
- **Limitations**: No external data installs; relies on built-in TA functions. Patterns are probabilistic—combine with your risk management.
Master the candles like a grandmaster. Deploy on TradingView, backtest relentlessly, and let dominance begin! Questions? Drop a comment.
*Version: 1.0 | Updated: September 2025 | Credits: Built on Pine Script v5 with nods to Nison's timeless techniques.*
Search in scripts for "Candlestick"

[DEM] Engulfing Candlestick Identifier Engulfing Candlestick Identifier is designed to automatically detect and highlight bullish and bearish engulfing candlestick patterns by analyzing the relationship between consecutive candles and applying ATR-based size filters to ensure significant pattern validity. The indicator identifies bullish engulfing patterns when the current candle closes above the previous candle's open, opens below the previous candle's close, and both candles meet minimum size requirements based on ATR thresholds, while bearish engulfing patterns are detected under opposite conditions. The indicator colors bars green for bullish engulfing patterns, red for bearish engulfing patterns, and optionally purple for all other bars when the "Different Color" setting is enabled, helping traders quickly identify potential reversal signals where one candle completely engulfs the body of the previous candle with sufficient magnitude to suggest meaningful momentum shifts.
[DEM] Doji Candlestick Identifier Doji Candlestick Identifier is designed to automatically detect and highlight doji candlestick patterns on the price chart by identifying bars where the opening and closing prices are nearly identical, indicating market indecision. The indicator uses statistical analysis to determine what constitutes a "near identical" open-close relationship by calculating the standard deviation of close-open differences over a specified lookback period (default 200 bars) and setting tolerance bands at one-tenth of this deviation above and below zero. When a candlestick's open-close difference falls within these narrow tolerance bands, the indicator places a small gray triangle below the bar to mark the doji pattern, helping traders quickly identify potential reversal or continuation points where buying and selling pressure are balanced.

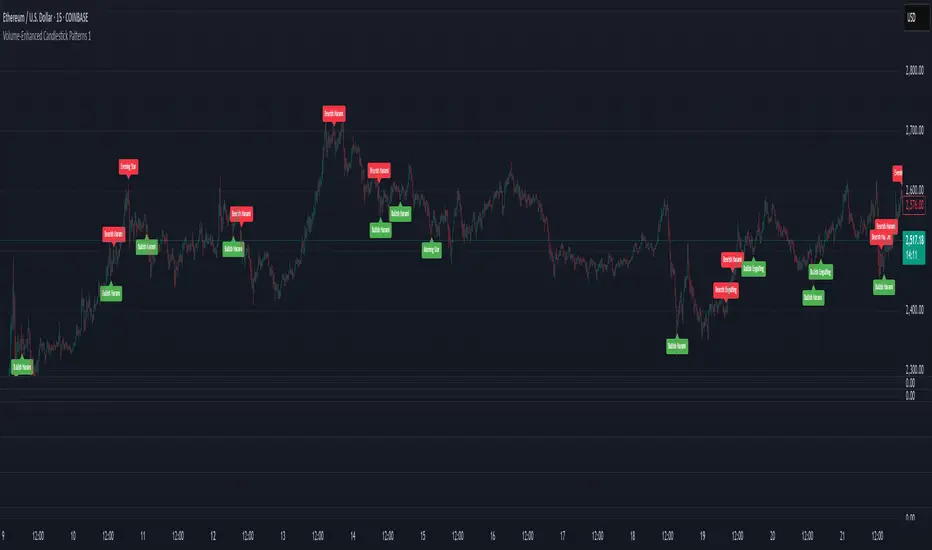
Volume-Enhanced Candlestick Patterns 1
Overview
Scans for four major candlestick reversal patterns:
Harami
Engulfing
Morning/Evening Star
Piercing Line/Dark Cloud Cover
Underlying logic assumes that, at a turning point, the dominant side (bulls or bears) often delivers a “final” push—either a last surge of buying or selling—before the reversal truly takes hold.
Pattern Toggles
Each individual pattern can be turned on or off in the inputs.
Enable only the patterns you want to monitor to reduce chart clutter and speed up performance.
Volume Filter Toggle
On: Requires volume-based exhaustion or climax to confirm each pattern.
Off: Relies purely on price-action candlestick logic (no volume checks).
Grouped Labels & Confluence
When one or more patterns trigger on the same bar close, a single label is drawn:
Grouping multiple confirmed patterns on one bar increases confluence and signal strength.
Climax Volume × Multiplier
Adjusting this input affects signal frequency and conviction:
Higher multiplier → fewer signals but with stronger volume confirmation
Lower multiplier → more signals, each with a looser volume requirement
Alerts
Built-in alert condition for each individual pattern (bullish/bearish Harami, Engulfing, Star, Piercing, Dark Cloud Cover), so you can receive real-time notifications whenever a confirmation occurs.
Follow for Weekly Scripts
If you find this helpful, please hit Follow and 🚀button —I release a new scripts every week.
Disclaimer
Not Financial Advice. This script is for educational and research purposes only.
Use as Part of a Larger System. It should not be used in isolation; combine it with your own risk management rules, additional indicators, and broader market analysis.
No Guarantees. Candlestick patterns and volume filters can improve signal quality, but they do not guarantee profitable trades. Always perform your own due diligence before entering any position.
IU Three Line Strike Candlestick PatternIU Three Line Strike Candlestick Pattern
This indicator identifies the Three Line Strike candlestick pattern — a rare yet powerful 4-bar reversal setup that captures exhaustion and momentum shifts at the end of strong trends.
Pattern Logic:
The Three Line Strike is a 4-candle pattern that typically signals a sharp reversal after a sustained directional move. This script detects both bullish and bearish variations using strict criteria to ensure accuracy.
Bullish Three Line Strike:
* Previous three candles must be bearish (red)
* Each of these candles must close progressively lower (indicating a strong downtrend)
* The current candle must:
* Be bullish (green)
* Open below the prior close
* Completely engulf the previous three candles by closing above the first candle's open
* And make a higher high than the last 3 bars — confirming a strong reversal
* Once confirmed, a green shaded box is drawn around the 4-bar zone to highlight the pattern
Bearish Three Line Strike:
* Previous three candles must be bullish (green)
* Each must close progressively higher (indicating a strong uptrend)
* The current candle must:
* Be bearish (red)
* Open above the prior close
* Completely engulf the prior three candles by closing below the first candle's open
* And make a lower low than the last 3 bars — confirming downside strength
* A red shaded box is plotted around the 4-bar formation to emphasize the reversal zone
Why this is unique:
Most candlestick tools focus on 1–2 bar patterns. The Three Line Strike goes a step further by combining trend exhaustion (3 same-colored candles) with a full reversal engulfing candle. This pattern is both rare and highly expressive of sentiment shift, making it a standout signal for discretionary and algorithmic traders alike.
How users can benefit:
* High-probability setups: Filters out weak signals using multi-bar confirmation logic
* Clear visual cues: Dynamic shaded boxes and labels make spotting reversals effortless
* Cross-timeframe compatible: Works on intraday and higher timeframes across all markets
* Real-time alerts: Get notified instantly when a bullish or bearish setup forms
This indicator is a valuable addition for traders who want to capture key reversals backed by strong multi-bar price action logic. Whether you are a price action purist or a pattern-based strategist, the IU Three Line Strike gives you a reliable edge.
Disclaimer:
This script is for educational purposes only and does not constitute financial advice. Trading involves risk, and past performance is not indicative of future results. Always do your own research and consult with a licensed financial advisor before making trading decisions.

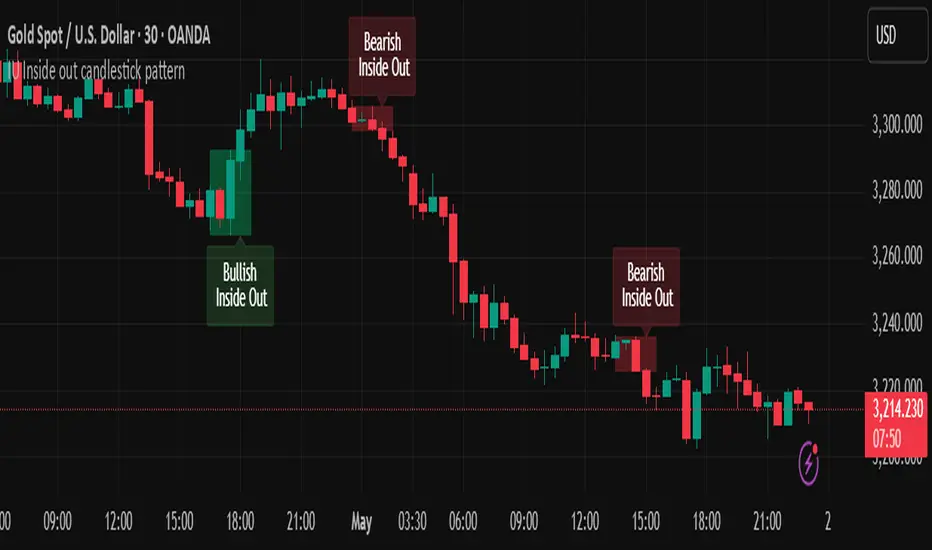
IU Inside out candlestick patternIU Inside Out Candlestick Pattern
This indicator identifies the Inside Out Candlestick Pattern — a unique 3-bar price action setup that captures strong market momentum and potential reversals with greater reliability than traditional patterns.
Pattern Logic:
The Inside Out pattern builds upon a classic engulfing setup by adding a breakout confirmation, making it a refined and filtered approach to candlestick analysis.
Bullish Inside Out Logic:
- Bar must be a bullish engulfing candle (engulfs previous bearish candle).
- Current bar must be bullish and must close above the high of the engulfing candle (a bullish breakout).
- When this setup is confirmed, a shaded green box is drawn around the range of the engulfing candle and its preceding bar.
Bearish Inside Out Logic:
- Bar must be a bearish engulfing candle (engulfs previous bullish candle).
- Current bar must be bearish and must close below the low of the engulfing candle (a bearish breakdown).
- When confirmed, a red box highlights the zone formed by the engulfing candle and its prior bar.
Why this is unique:
Unlike conventional candlestick indicators that trigger signals immediately after an engulfing pattern, this script adds a breakout condition to validate follow-through strength. This reduces false positives and gives traders a clearer edge. The pattern is also rare, which means it captures strong, decisive moves when it does appear.
How users can benefit:
- High-quality entries: Only shows patterns with proven follow-through, improving trade timing.
- Visual clarity: Boxes and labels highlight significant price zones for easy interpretation.
- Flexible use: Applicable across timeframes and instruments — ideal for both intraday and swing traders.
- Alerts included: Real-time alerts help traders stay updated without staring at charts all day.
This script is a powerful tool for price action traders looking to enhance pattern reliability and signal strength through structure-based breakout confirmation.
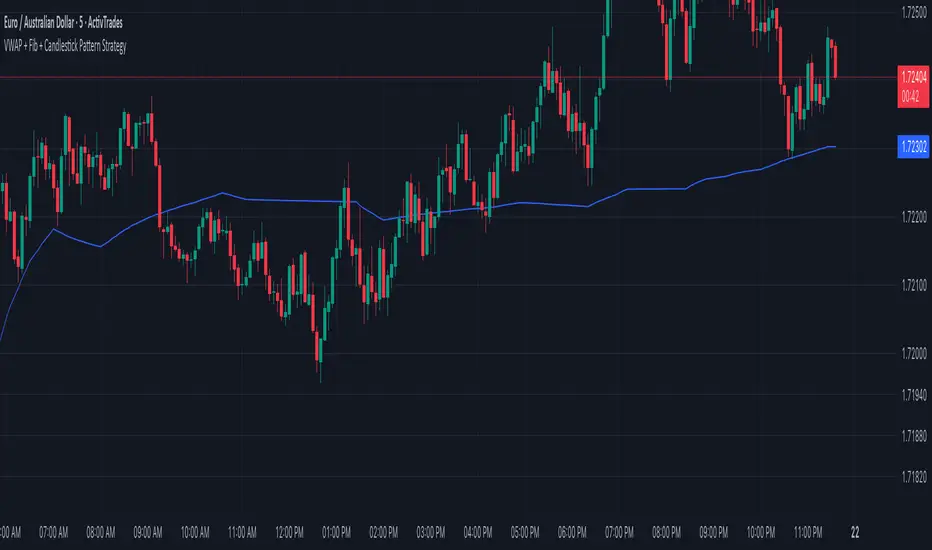
VWAP + Fib + Candlestick Pattern Strategy### **VWAP + Fibonacci + Candlestick Pattern Strategy (v6)**
This indicator is designed to identify high-quality trading setups using a combination of **Anchored VWAP, Fibonacci Retracement Levels, and Candlestick Patterns**. It helps traders find optimal entry points where multiple confluences align, enhancing trade accuracy.
### **Key Features:**
✅ **Anchored VWAP** – Starts from the last pivot low (bullish) or pivot high (bearish) to determine trend strength.
✅ **Fibonacci Levels** – Uses key retracement levels (0.382, 0.5, 0.618, 0.786) for added confluence.
✅ **Candlestick Patterns** – Detects Pin Bars, Engulfing Candles, and Hammer Candles for potential reversals.
✅ **High-Quality Setups** – Highlights strong signals where price aligns with VWAP & Fib zones.
✅ **Alerts** – Get notified when a bullish or bearish setup is detected.
✅ **Risk Management** – Includes Take Profit (TP1, TP2, Final TP) & Stop Loss based on ATR.
✅ **Position Sizing** – Calculates position size based on a fixed dollar risk per trade.
### **How to Use:**
1. Apply the indicator to your chart.
2. Look for signals near Fibonacci retracement levels and VWAP.
3. Use alerts for real-time trade notifications.
4. Manage risk with built-in TP/SL and position sizing.
Perfect for traders who use **Price Action & Smart Money Concepts** to refine their entries! 🚀
CHAKRA RISS ENGULFING CANDLESTICK STRATEGYChakra RISS Engulfing Candlestick Strategy
Type: Technical Indicator & Strategy
Platform: TradingView
Script Version: Pine Script v6
Overview:
The Chakra RISS Engulfing Candlestick Strategy combines a momentum-based approach using the Relative Strength Index (RSI) with Engulfing Candlestick Patterns to generate buy and sell signals. The strategy filters trades based on price movement relative to a 50-period Simple Moving Average (SMA), making it a trend-following strategy.
The indicator uses color-coded bars to visually represent market conditions, helping traders easily identify bullish and bearish trends. The strategy is designed to be dynamic, adapting to changing market conditions and filtering out noise using key technical indicators.
How It Works:
RSI-Based Color Conditions:
Green Bars: When the RSI crosses above a specified UpLevel (default: 50), indicating a bullish momentum and signaling potential buy conditions.
Red Bars: When the RSI crosses below a specified DownLevel (default: 50), indicating a bearish momentum and signaling potential sell conditions.
Buy Signal:
Triggered when the following conditions are met:
RSI crosses from below the UpLevel (default: 50) to above it, signaling increasing bullish momentum.
The close price is above the 50-period Simple Moving Average (SMA), confirming an uptrend.
The Buy Signal is plotted below the bar with a green arrow and a "BUY" label.
Sell Signal:
Triggered when the following conditions are met:
RSI crosses from above the DownLevel (default: 50) to below it, signaling increasing bearish momentum.
The close price is below the 50-period Simple Moving Average (SMA), confirming a downtrend.
The Sell Signal is plotted above the bar with a red arrow and a "SELL" label.
Stop Loss and Take Profit:
For long trades (buy signals), the stop loss is placed below the previous bar's low, and the take profit is set at 3% above the entry price.
For short trades (sell signals), the stop loss is placed above the previous bar's high, and the take profit is set at 3% below the entry price.
Dynamic Bar Coloring:
The bar colors change dynamically based on RSI levels:
Green Bars: Indicating a potential uptrend (bullish).
Red Bars: Indicating a potential downtrend (bearish).
These visual cues help traders quickly identify market trends and potential reversals.
Trend Filtering:
The 50-period Simple Moving Average (SMA) is used to filter trades based on the overall market trend:
Buy signals are only considered when the price is above the moving average, indicating an uptrend.
Sell signals are only considered when the price is below the moving average, indicating a downtrend.
Alerting System:
Alerts can be set for both buy and sell signals. These alerts notify traders in real-time when potential trades are generated, allowing them to act promptly.
Alerts can be configured to send notifications through email, SMS, or a webhook for integration with other services like IFTTT or Zapier.
Key Features:
RSI and Moving Average-Based Signals: Combines RSI with a moving average for more accurate trade signals.
Stop Loss and Take Profit: Dynamic risk management with custom stop loss and take profit levels based on previous high and low prices.
Buy and Sell Alerts: Provides real-time alerts when a buy or sell signal is triggered.
Trend Confirmation: Uses the 50-period Simple Moving Average to filter signals and confirm the direction of the trend.
Visual Bar Color Changes: Makes it easy to identify bullish or bearish trends with color-coded bars.
Usage:
This strategy is suitable for traders who prefer a trend-following approach and want to combine momentum indicators (RSI) with price action (Engulfing Candlestick patterns). It is particularly useful in volatile markets where quick identification of trend changes can lead to profitable trades.
Best Used For: Day trading, swing trading, and trend-following strategies.
Timeframes: Works well on various timeframes, from 1-minute charts for scalping to daily charts for swing trading.
Markets: Can be applied to any market with sufficient liquidity (stocks, forex, crypto, etc.).
Settings:
UpLevel: The RSI level above which the market is considered bullish (default: 50).
DownLevel: The RSI level below which the market is considered bearish (default: 50).
SMA Length: The period of the Simple Moving Average used to filter trades (default: 50).
Risk Management: Customizable stop loss and take profit settings based on price action (default: 3% above/below the entry price).

Custom Candlestick Pattern IndicatorCustom Candlestick Pattern Indicator - Buy Signal Based on Green Candles Breaking Previous Lows
Overview:
This custom candlestick pattern indicator is designed to highlight potential buy opportunities based on a simple yet powerful candlestick pattern. The indicator identifies green candles that break below the low of the previous candle. This combination may signal a potential market reversal or a bullish continuation after a pullback, depending on the market context. Traders can use this indicator to detect areas where prices may be bouncing from recent lows, indicating a potential buying opportunity.
Pattern Explanation:
The strategy underlying this indicator is a two-part condition that must be met before a buy signal is generated:
Green Candle: A green candle forms when the closing price of the current candle is higher than its opening price. This visually represents bullish momentum as buyers have taken control, closing the price higher than where it opened.
Breaking the Previous Low: The low of the current candle must be lower than the low of the previous candle. This suggests that, despite initial bearish pressure during the candle formation (which drove the price below the previous candle's low), buyers stepped in to push the price higher by the candle’s close. This pattern can signify a potential reversal or bullish continuation, as it demonstrates that buyers are overcoming initial selling pressure.
When the Pattern Occurs:
This pattern is particularly interesting to traders who look for potential reversal signals after a brief decline in price.
It may also work well in markets where pullbacks are common, as this pattern could mark the end of a retracement and the resumption of the bullish trend.
How the Indicator Works:
Green Candle: The indicator first identifies a green candle, where the close of the candle is greater than its open (close > open). This signals that the current period closed higher than it opened, which is generally a bullish sign.
Breaking Previous Low: The indicator checks if the current candle's low is below the low of the previous candle (low < low ). If this condition is met, it means the price dropped below the previous candle's low but was still able to close higher (green candle), signaling a potential reversal or buying opportunity.
Buy Signal: If both conditions are true (green candle + breaking previous low), the indicator plots a buy signal below the candle in the form of an upward-facing triangle labeled "Buy" in green. This serves as a visual cue for traders to consider entering a buy position.
Optional Previous Low Plot: For added reference, the indicator plots the previous candle's low as a red step-line on the chart. This helps traders visualize when the price has dipped below the prior candle's low, making it easier to spot instances where the pattern is forming.
How to Use:
This indicator can be used across multiple timeframes, whether you’re trading short-term intraday patterns or longer-term swing trades.
It works well in markets that experience pullbacks or minor retracements, as the pattern it identifies suggests a rejection of lower prices followed by a push higher.
Traders can combine this indicator with other technical analysis tools (such as moving averages, support/resistance levels, or momentum oscillators) to strengthen the buy signals and add more context to the trading decision.
Example Scenarios:
Reversal Signal: Suppose a market has been in a minor downtrend, and suddenly a green candle forms after a low that breaks the previous day’s low. This indicator would generate a buy signal, suggesting the downtrend may be losing strength and that buyers are taking control. This could be an early indication of a reversal.
Bullish Continuation After Pullback: Imagine a market in a steady uptrend experiences a temporary pullback. The price breaks the previous candle’s low, but the current candle closes higher (green candle). This buy signal could indicate that the pullback is over, and the uptrend is likely to continue.
Advantages:
Simplicity: This indicator relies on basic price action (green candles and lows) without requiring complicated indicators or oscillators, making it easy to understand and use.
Visual Alerts: The plotted buy signals and previous lows provide a clear, visual representation on the chart, simplifying decision-making for traders.
Versatility: It can be applied across different timeframes and asset classes (stocks, forex, crypto, etc.), making it a versatile tool for all kinds of traders.
Limitations:
As with any single indicator or pattern, this should not be used in isolation. It is important to incorporate broader market context, support/resistance levels, and other forms of analysis to avoid false signals.
The pattern tends to be more effective when there’s sufficient market liquidity and may perform better in trending or volatile markets compared to sideways or flat markets.

Smarter Pullback + Candlestick Pattern (Steven Hart)Built with love "Smarter Pullback + Candlestick Pattern"
This indiator will help you to find a Pullback + Candlestick Pattern, inspirated by Steven Hart
You can combine with your own strategy, or use this purely
DISCLAIMER :
Measure the risk first before use it in real market
Backtest The Strategy was very important, so you know the probability
Fundamentally Logical :
Pullback (Some Previous candle is Red for Bull Pullback vice versa)
the Entry candle must be a Candlestick Pattern
Features :
1. Engulfing
2. Hammer & Shooting Star
3. Doji
How to use it :
1. Adjust the Pullback Period
2. Check and Uncheck the Pattern you want to see
3. Adjust the style to your favourite
Regards,
Hanabil

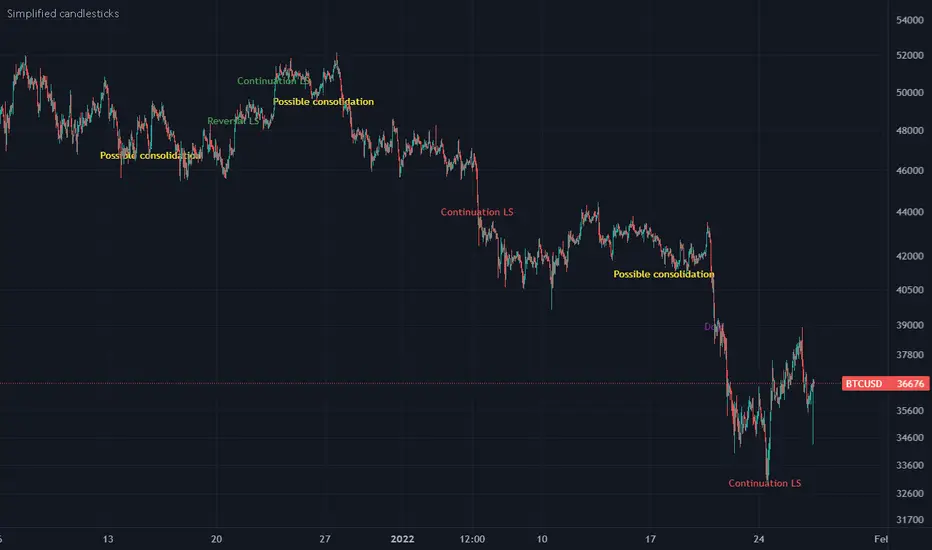
Simplified candlesticksSimplified candlesticks tracks sticks for their body and wick
- For Long bars sticks ( LS ) tracks and marks them on down trend as continuation and reversal if moves appositive direction.
- For largest wicks on ends marks as regular Doji
- For large wicks and medium body marks as possible consolidation
- For only bottom bigger wick as bears weakness if trend down and possible reversal if trend is up.
- For only upper bigger wick as bulls weakness if trend up and possible reversal if trend is down
Candlestick Reversal SystemHello Traders,
In the book "Secrets of a Pivot Boss: Revealing Proven Methods for Profiting in the Market" by Franklin Ochoa, Four different types of reversal systems were introduced and candlestick patterns are used to find reversals. I will not write a lot about the book, you should get/read it for yourself. There are many great ideas in the book, Candlesetick Reversal System, Following Trend, Time Price Opportunity, Advanced Camarilla Concepts and much more.
Reversal systems mentioned in the book are :
- Wick Reversal System
- Exteme Reversal System
- Outside Reversal System
- Doji Reversal System
I tried to add these four reversal systems to the script. If you need detailed info you better read the book ;)
Enjoy!

Ori Candlesticks Box Plot This script plots given first timeframe inputs candles with data from second timeframes candle closes. If you change inputs you should change also TF1/TF'2 so that it is equal to first time frames / second time frame. For example if first timeframe is Daily and second is 15. There is 96 times 15m candle in the Day so TF1/TF2 should be 96. Other inputs are percentiles that will be used in the calculating candlesticks wicks and body parts. Default values 98 75 50 25 2 percentiles. Last candle is wrong because script can't calculate until bar is closed.

Swing Reversal Candlestick PatternThis indicator identifies high-probability swing reversal points by combining a fixed 20-period swing structure with strict candlestick reversal conditions. It is designed for traders who want to detect liquidity sweeps, failed breakouts, and sharp turning points in price.
The tool first determines the most recent swing high and swing low by scanning the previous 20 bars. When the price touches or sweeps these levels, the indicator evaluates the current candle for strong reversal characteristics. These include wick dominance, body direction change, and structural validation against the previous bar. Only candles that meet all reversal criteria are marked.
Bullish signals appear when the price sweeps a swing low followed by a strong upward reversal candle.
Bearish signals appear when the price sweeps a swing high, followed by a strong downward reversal candle.
This tool is intended strictly for reversal setups, not for trend continuation trading. Traders may also use the candle wick as a natural stop-loss reference, aligning entries with liquidity sweep behavior.

RSI Crossover with Candlestick Patternsusing the RSI indicator levels 40 and 60, where the signal cuts above level 40 with a candlestick hammer or bull engulfing and cuts below level 60 with a candlestick inverter hammer or bearish engulfing.
1H Candlestick vs EMA Crossover# Description — 1H Candlestick vs EMA Crossover (Pine Script)
This indicator is built in **TradingView Pine Script v5** and is designed to track the relationship between the **1‑hour candlestick close** and the **1‑hour Exponential Moving Average (EMA)**. It works on any chart timeframe but always pulls in **1H data** using `request. security`.
### Core Features
* **Customizable EMA length** (default = 200)
* **Plots the 1H EMA** as an orange line on your chart
* Optionally shows the **1H close** as a faint gray line for reference
* Detects and highlights when the **1H candle close crosses above or below the 1H EMA**
* **Arrows**: Green triangles appear below the bar when a bullish crossover happens (1H close > EMA); red triangles appear above the bar when a bearish crossover happens (1H close < EMA)
* **Alerts**: Built‑in `alert condition` statements let you create TradingView alerts whenever a crossover occurs
### How to Use
1. Adjust the EMA length if you want a faster or slower moving average.
2. Enable alerts: Right‑click the chart → Add Alert → choose this indicator and select either “crossed ABOVE EMA” or “crossed BELOW EMA.”
### Trading Applications
* **Trend Confirmation**: Use the 1H EMA as a higher‑timeframe filter while trading on lower timeframes.
* **Entry/Exit Signals**: Crossovers can mark potential entry points for trend continuation or reversals.
* **Scalping/Intraday**: Even on a 5m or 15m chart, you can overlay the 1H EMA to align your trades with the bigger trend.
This makes the indicator a simple yet powerful tool for aligning trades with higher‑timeframe momentum and avoiding false signals from lower‑timeframe noise.

Liquidity Sweep Candlestick Pattern with MA Filter📌 Liquidity Sweep Candlestick Pattern with MA Filter
This custom indicator detects liquidity sweep candlestick patterns—price action events where the market briefly breaks a previous candle’s high or low to trap traders—paired with optional filters such as moving averages, color change candles, and strictness rules for better signal accuracy.
🔍 What is a Liquidity Sweep?
A liquidity sweep occurs when the price briefly breaks the high or low of a previous candle and then reverses direction. These events often occur around key support/resistance zones and are used by institutional traders to trap retail positions before moving the price in the intended direction.
🟢 Bullish Liquidity Sweep Criteria
The current candle is bullish (closes above its open).
The low of the current candle breaks the low of the previous candle.
The candle closes above the previous candle’s open.
Optionally, in Strict mode, it must also close above the previous candle’s high.
Optionally, it can be filtered to only show if the candle changed color from the previous one (e.g., red to green).
Can be filtered to only show when the price is above or below a moving average (if MA filter is enabled).
🔴 Bearish Liquidity Sweep Criteria
The current candle is bearish (closes below its open).
The high of the current candle breaks the high of the previous candle.
The candle closes below the previous candle’s open.
Optionally, in Strict mode, it must also close below the previous candle’s low.
Optionally, it can be filtered to only show if the candle changed color from the previous one (e.g., green to red).
Can be filtered to only show when the price is above or below a moving average (if MA filter is enabled).
⚙️ Features & Customization
✅ Signal Strictness
Choose between:
Less Strict (default): Basic wick break and close conditions.
Strict: Must close beyond the wick of the previous candle.
✅ Color Change Candles Only
Enable this to only show patterns when the candle color changes (e.g., from red to green or green to red). Helps filter fake-outs.
✅ Moving Average Filter (optional)
Supports several types of MAs: SMA, EMA, WMA, VWMA, RMA, HMA
Choose whether signals should only appear above or below the selected moving average.
✅ Custom Visuals
Show short (BS) or full (Bull Sweep / Bear Sweep) labels
Plot triangles or arrows to represent bullish and bearish sweeps
Customize label and shape colors
Optionally show/hide the moving average line
✅ Alerts
Includes alert options for:
Bullish sweep
Bearish sweep
Any sweep
📈 How to Use
Add the indicator to your chart.
Configure the strictness, color change, or MA filters based on your strategy.
Observe signals where price is likely to reverse after taking out liquidity.
Use with key support/resistance levels, order blocks, or volume zones for confluence.
⚠️ Note
This tool is for educational and strategy-building purposes. Always confirm signals with other indicators, context, and sound risk management.

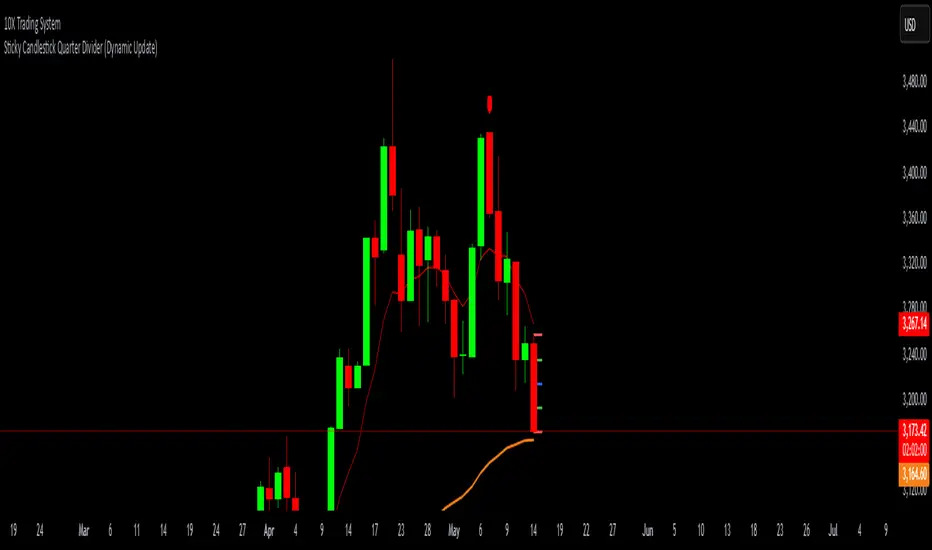
Sticky Candlestick Quarter Divider (Dynamic Update)This indicator divides the most recent candlestick into four equal parts and dynamically plots horizontal lines that move along with the latest candle.
Features:
Dynamic Sticky Lines:
The lines remain visually attached to the current candle, moving seamlessly as the chart updates, zooms, or pans.
Price Level Calculation:
Divides the candlestick into four distinct levels:
High Line (Red): Marks the highest point of the candle.
Low Line (Red): Marks the lowest point of the candle.
Midpoint Line (Blue): Marks the midpoint between high and low.
Upper Quarter Line (Green): Marks the 25% level between low and high.
Lower Quarter Line (Green): Marks the 75% level between low and high.
Real-Time Update:
The lines automatically adjust to the latest candle, maintaining accurate positioning.
Ideal for Candle Analysis:
Quickly identify key price levels and candle structure.
Suitable for analyzing trend strength and potential price reversals.
HTF CandlestickHTF Candlestick
This indicator that visualizes a specific candle from a user-defined timeframe (1D, 1H, etc.) and its associated properties on the chart. Below is a detailed explanation:
1 - Inputs and Initialization:
timeframeInput: Allows the user to select the desired timeframe (e.g., daily).
pos: Adjusts the horizontal position of the drawn candle on the chart.
2 - Custom Data Type (type bar):
The bar type stores data for the open, high, low, and close (OHLC) values, as well as the start time of the candle.
It also includes graphical elements like body, wick, and start lines.
3 - Logic:
A variable b is initialized to represent the custom candle.
The script checks for changes in the selected timeframe and creates a new bar when the timeframe changes.
4 - Methods:
update(): Updates the OHLC values of the bar if a new high or low occurs.
display(): Draws the candle on the chart, including:
The candle body.
The wick (shadow).
Labels showing the open, high, and low values.
Horizontal and vertical dotted lines for visual aid.
5 - Candle Redrawing:
The script clears all graphical elements (lines, labels, boxes) for the current candle on the last bar of the chart (barstate.islast) and redraws them using the display() method.
6 - Table Display:
A small table is displayed at the right-hand side of the chart showing:
The selected timeframe.
The opening value of the candle.
The difference between the close and open prices, highlighted with the appropriate color.
Kod Açıklaması
Bu Pine Script, kullanıcı tarafından seçilen bir zaman dilimine (1D, 1H vb.) ait bir mum çubuğunu ve onun özelliklerini grafik üzerinde görselleştiren özel bir indikatördür. İşte detaylı açıklaması:
1- Girdiler ve Başlangıç:
timeframeInput: Kullanıcının istediği zaman dilimini seçmesine olanak tanır (ör. günlük).
pos: Çizilen mumun grafikte yatay pozisyonunu ayarlamak için kullanılır.
2 - Özel Veri Tipi (type bar):
bar türü, açılış, yüksek, düşük ve kapanış (OHLC) değerlerini ve mumun başlangıç zamanını saklar.
Ayrıca, grafik öğeleri için body, wick ve start gibi alanlar içerir.
3- Mantık:
b değişkeni, seçilen mum çubuğunu temsil etmek için tanımlanmıştır.
Seçilen zaman diliminde bir değişiklik olup olmadığını kontrol eder ve değişiklik olduğunda yeni bir bar oluşturur.
4 - Metotlar:
update(): Daha yüksek bir zirve veya daha düşük bir dip meydana gelirse, mumun OHLC değerlerini günceller.
display(): Grafik üzerinde mum çubuğunu çizer. Bu işlem şunları içerir:
Mum gövdesi.
Fitil (gölge).
Açılış, yüksek ve düşük değerlerini gösteren etiketler.
Görsel yardım için yatay ve dikey kesik çizgiler.
5- Mum Yeniden Çizimi:
Grafik üzerindeki tüm grafiksel elemanları (çizgiler, etiketler, kutular) temizler ve mevcut mumun son çubuğunda (barstate.islast) bunları yeniden çizer.
6 - Tablo Görüntüsü:
Grafik üzerinde sağ tarafta küçük bir tablo gösterilir. Bu tabloda:
Seçilen zaman dilimi.
Mumun açılış değeri.
Kapanış ve açılış fiyatları arasındaki fark, uygun renkte vurgulanarak gösterilir.
Bu kod, kullanıcıya belirli bir zaman dilimindeki mum çubuğunun görsel bir analizini ve temel bilgilerini sağlar.

Momentum Flow Module 1 (Bar/Candlestick Classification)Every candlestick on the chart can be categorized as either a trend bar or a trading range bar. Trend bars are further classified as significant or insignificant, while trading range bars are divided into inside, outside, overlap, reversal, and implied reversal types. This indicator automatically identifies and labels each category to help traders make more informed decisions. For instance, a sequence of significant bearish trend bars within an ongoing bull trend indicates weakening bullish momentum. Similarly, if a bull trend lacks strong bull trend bars, it suggests diminishing buying pressure or the early signs of a potential reversal

AI Candlestick Pattern Identifier — Arrows & AlertsAI shows you high confidence candlestick patterns so that you can identify them quickly. Buy/Sell arrows will be placed alongside the pattern to alert you of which direction the indicator believes the market will go, as well as showing you the confidence in that indicator.

Candlestick toolkit (Candle Over Candle)Candlestick pattern toolkit focused on reading price action via candle anatomy, body dynamics, and a specific 2-bar continuation/reversal pattern.
This indicator highlights:
Long upper and lower wicks (“topping” and “bottoming” tails) that can signal exhaustion or potential reversal.
Large bullish bodies relative to Average True Range (ATR), showing strong momentum.
Sequences of large green candles.
Runs of green candles with strictly increasing or strictly decreasing body size, to visualize acceleration vs. momentum fade.
A two-candle pattern:
“Candle over Candle” (CoC) for long bias: two bullish bars where the first has a small upper wick and the second has a modest lower wick (a brief dip then push higher).
Optional mirrored “Candle under Candle” (CuC) for short bias.
The script labels:
Topping/Bottoming tails (TT/BT).
Large-green sequences and increasing/decreasing bodies (N×LG, ↑B, ↓B).
CoC/CuC pattern bars as “PRE” and the actual breakout bars as “GO”.
While a pattern is “live,” a reference line marks the trigger level (pattern high for longs, pattern low for shorts).
Inputs let you:
Tune wick and body percentage thresholds for tail detection.
Adjust ATR length and the multiplier that defines a “large” body.
Change how many candles are required for large-green sequences and body size trends.
Configure the two-candle pattern (maximum wick sizes, whether a small dip is required, confirmation within N bars).
Choose confirmation mode: close-through the trigger or intrabar wick break.
Enable or disable the short (CuC) side.
Control visual features (tail markers, sequence markers, pattern labels, and background shading on pattern bars).
Typical use:
Apply on intraday or swing timeframes.
Use tails and body behavior to read strength/weakness and potential exhaustion.
Treat CoC/CuC PRE labels as pattern formation, and GO labels as potential trade triggers above/below the pattern.
Combine with your own filters (trend, volume, higher-timeframe levels) rather than using it as a standalone signal generator.

IU Inside/Harami candlestick patternDESCRIPTION
The IU Inside/Harami Candlestick Pattern indicator is designed to detect bullish and bearish inside bar formations, also known as Harami patterns. This tool gives users flexibility by allowing pattern detection based on candle wicks, bodies, or a combination of both. It highlights detected patterns using colored boxes and optional text labels on the chart, helping traders quickly identify areas of consolidation and potential reversals.
USER INPUTS :
Pattern Recognition Based on =
Choose between "Wicks", "Body", or "Both" to determine how the inside candle pattern is identified.
Show Box =
Toggle the appearance of colored boxes that highlight the pattern zone.
Show Text =
Toggle on-screen labels for "Bullish Inside" or "Bearish Inside" when patterns are detected.
INDICATOR LOGIC :
Bullish Inside Bar (Harami) is detected when:
* The current candle's high is lower and low is higher than the previous candle (wick-based),
* or the current candle’s open and close are inside the previous candle’s body (body-based),
* and the current candle is bullish while the previous is bearish.
Bearish Inside Bar (Harami) is detected when:
* The current candle's high is lower and low is higher than the previous candle (wick-based),
* or the current candle’s open and close are inside the previous candle’s body (body-based),
* and the current candle is bearish while the previous is bullish.
The user can choose wick-based, body-based, or both logics for pattern confirmation.
Boxes are drawn between the highs and lows of the pattern, and alert messages are generated upon confirmation.
Optional labels show the pattern name for quick visual identification.
WHY IT IS UNIQUE :
Offers three different logic modes: wick-based, body-based, or combined.
Highlights patterns visually with customizable boxes and labels.
Includes built-in alerts for immediate notifications.
Uses clean and transparent plotting without repainting.
HOW USER CAN BENEFIT FROM IT :
Receive real-time alerts when Inside/Harami patterns are formed.
Use the boxes and text labels to spot price compression zones and breakout potential.
Combine it with other tools like trendlines or support/resistance for enhanced accuracy.
Suitable for scalpers, swing traders, and price action traders looking to trade inside bar breakouts or reversals.
DISCLAIMER :
This indicator is not financial advice, it's for educational purposes only highlighting the power of coding( pine script) in TradingView, I am not a SEBI-registered advisor. Trading and investing involve risk, and you should consult with a qualified financial advisor before making any trading decisions. I do not guarantee profits or take responsibility for any losses you may incur.
