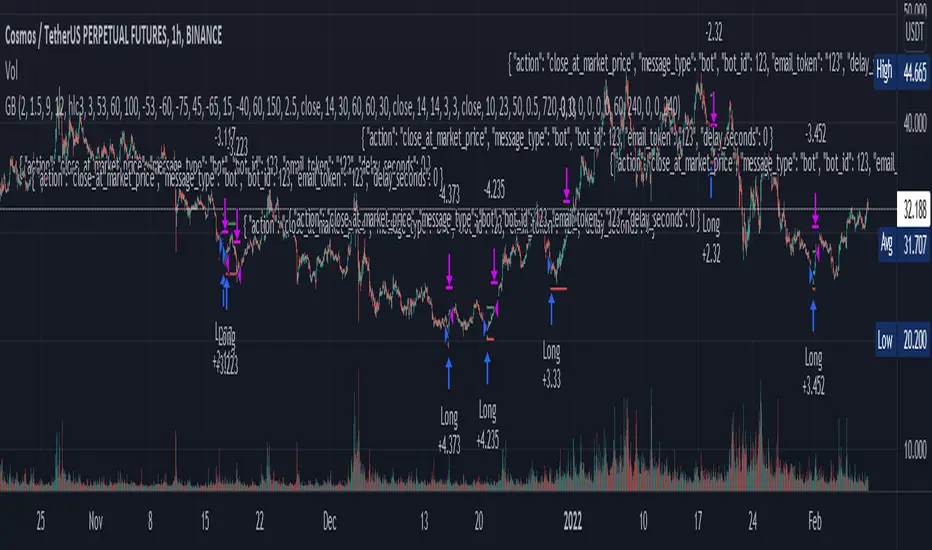
"Golden buy" for cryptofutures (alerts for 3 commas/finandy)This script is a blend of open source cipher B indicator by VuManChu and Hammers & Stars strategy made by ZenAndTheArtOfTrading.
"Golden buy" is based on divergencies and was considered as one of the top strategies for cryptotrading. So I used it for entrance point in this script.
You can turn on opening short positions which are based on divergencies as well.
SL/TP, based on ATR 14, can be tuned, so does Risk/reward ratio.
VuManChu's parameters can be tuned too, but honestly, I don't know how it can help you.
And, finally, you can fully automate your trading with alerts templates presented in the script. (strategy.entry (...//comments= ) - for 3commas and 'alert' function under if conditions for finandy)
Thank you for your attention.
Search in scripts for "GOLD"
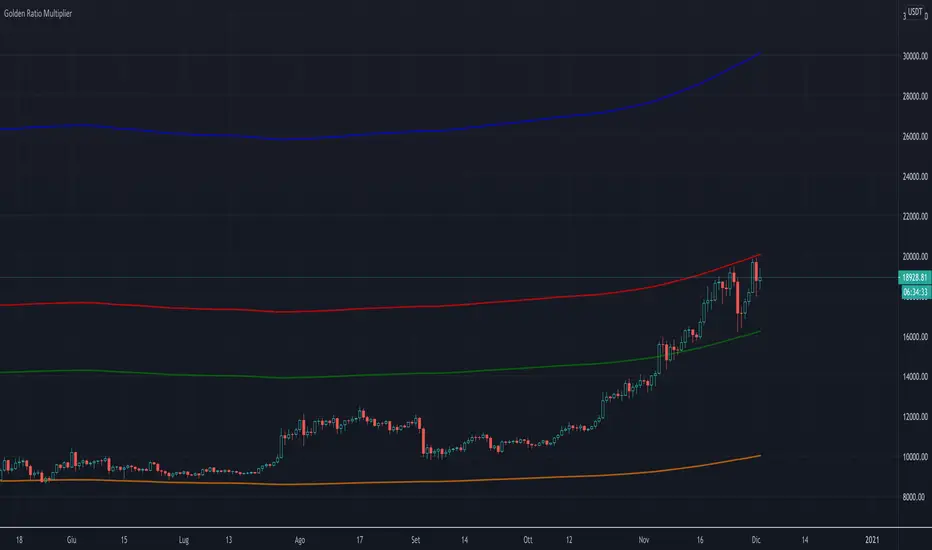
PI_GRM Bitcoin Golden Ratio Multipier [wozdux]Golden Ratio Multiplier
Formula GRM=MA350(BTC USD) * (1.6;2;3;5;8;13;21)
The multiplier examines medium-and long-term time cycles.
For this, a multiple of 350 MA is used to determine the areas of potential resistance.
Additionally, fibo levels from the main line.
version 2021 year modification

'Golden ratio' spiral - 'GoRaS'This script is based on 'Golden Ratio'
It starts from the last pivot high/low, forming a rectangular spiral.
Mainly experimental but I think it could be used as 'support/resistance' and trend interpretation
The (pivot) length can be adjusted ('Leftbars'):
Start of the spiral can be changed ('Start loop'):
End of the spiral can be changed as well ('End loop'):
It can be made more compact, or wider ('Ratio'):
'Extend lines' can be helpful finding S/R area's:
('extend left')
Cheers!

Golden Ratio Multiplier (x1.6; x2; x3)The script displays three multipliers (x1.618; x2; x3) of the Golden Ratio (starting with MA at 350 days) to identify the following levels of support:
the multiplier x1.618 is an accumulation high (green line)
the multiplier x2 is a support that identify a low bull high (red line)
the multiplier x3 is a support that identify an upper bull high (blu line)
Note: the orange line is the SMA at 350 days.
Gold 1 hour strategyThis strategy has no repaint as no security exist in the MTF
the buy system is based on Low scaner script that i show in my early publication (free code)
the sell system depend on the length of the ATR
you can set the HTF which is no security type to different time frame in order to see if the results better or you want
to buy more
Take profit is key part as we exit by it and by the ATR
the setting here are done for Gold 1 hour chart
for other you need to find your own settings

Gold Key Entries (TheWickClub)PublicThe Wick Club's Gold Key entry windows utilising specific Time windows along with Price Action

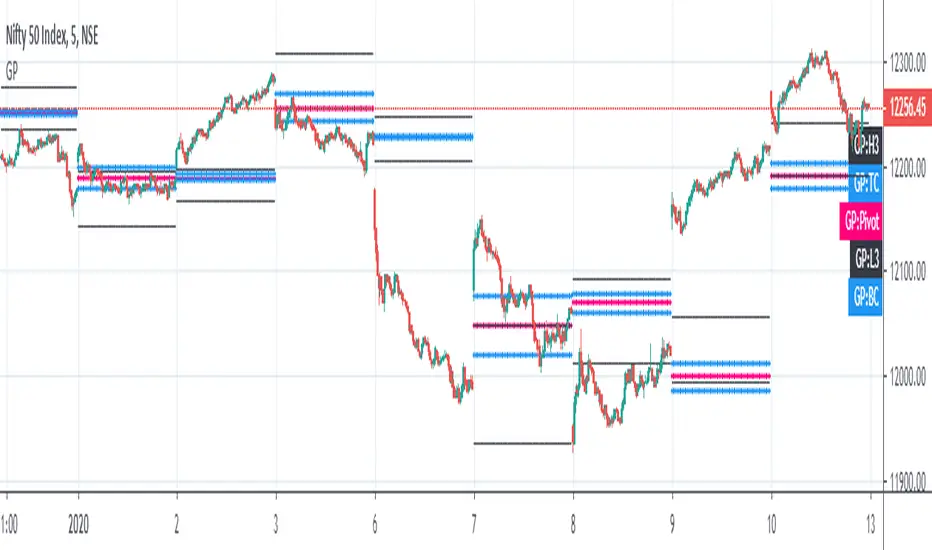
Golden Pivot1. Golden Pivot indicator combines Central Pivot Range and Camarilla Pivots.
2. Pivot calculations are based on Secret of Pivot Boss book by Frank Ochoa.
3. One can also view tomorrow's pivots by today EOD.

Gold Indy by TheorisThis indicator show possibility zone
High possibility for buy - Green zone
Medium possibility for buy - Pale Green zone
High possibility for sell - Red zone
Medium possibility for sell - Pink zone
Other colors - no signal.
Let 's try to use any timeframe / Trend timeframe.
which one is match for your symbols
concept from : RSI/Sto ...

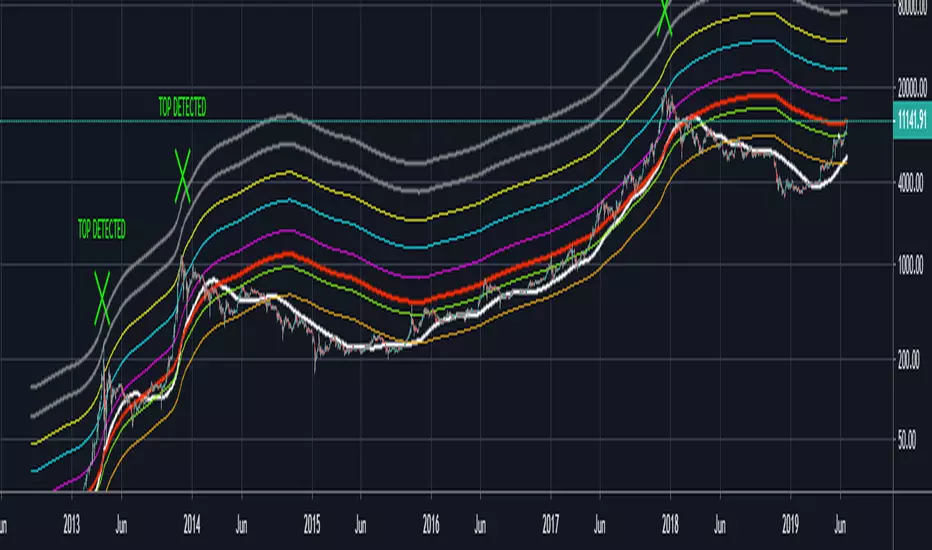
Golden Ratio Fibonacci Multipliers Top DetectorBased on article "The Golden Ratio Multiplier" by Philip Swift (@PositiveCrypto).
Added an alert for the X2 - DMA 111 crossing.
Optimized for dark tradeview themes
Golden Ratio Macro Top IndicatorsThis is inspired by Philip Swift's Golden Ratio Multiplier research however it uses the 300 DMA to predict the Macro Cycle Top's Price. It still uses the 350 DMA * 2 and 111 DMA to predict the top's date (the two cross).
111 DMA (Orange) crosses the 350 DMA * 2 (Green) predicts the Macro Cycle Top Date
300 DMA * 3 (Red) predicts the Current Macro Cycle Top Price
300 DMA * 5 (Yellow) predicted the 2018 Macro Cycle Top Price
300 DMA * 8 (Blue) predicted the 2014 Macro Cycle Top Price

Golden RatioThis is inspired by Philip Swift's Golden Ratio Multiplier research however it uses the 300 DMA to predict the Macro Cycle Top's Price. It still uses the 350 DMA * 2 and 111 DMA to predict the top's date (the two cross).
111 DMA (Orange) crosses the 350 DMA * 2 (Green)= Macro Cycle Top Date
300 DMA * 3 (Red) predicts the Current Macro Cycle Top Price
300 DMA * 5 (Yellow) predicted the 2018 Macro Cycle Top Price
300 DMA * 8 (Blue) predicted the 2014 Macro Cycle Top Price


Golden Egg combined best for 3H, 6H, 1DThis is the combined Golden Egg indicator optimized for bitcoin on 3H, 6H, and 1D timeframe for the current market situation. Other timeframes may/may not be optimized in the future.
The purpose of this indicator is to generate early signal for bitcoin (BTCUSD) in the current market situation (hence it may be re-optimized again when the market macro-situation changes).
It can also be used for altcoins, however, the accuracy may vary. Please use it with caution and only as a complementary indicator together. Remember always set stop loss.


5 minute XAUUSD Strategy (Gold)Most definitely this is the best strategy I have ever coded. (Read Note Below)
Version 3 of PineScript code, 2 contract/lot trades at once, pyramiding = 2.
Commission of 100 pips included on each trade, accurate representation of actual spreads, commission_value = 0.02.
This is essentially 270% of profit in a single month - check the date on the first trade.
Trend following strategy as all the previous ones before, but this one is crazy.
Max drawdown is 34%, all that drawdown and more is profit made, but there cannot be any emotional involvement in this strategy.
Choppy markets produce losses, as is with all trend-following strategies.
(4 lines of code, nice and simple)
Downside - the last month in which this was backtested may not provide actual representation of past movement (market could have been exceptionally trending the last month), (but maybe it does ;v)
Unfortunately, we cannot know because "TRADINGVIEW WON'T OFFER BACKTESTING FOR FARTHER BACK!" fix this please.


4H CCI Strategy 1.3Still working on fixing the code 100%.
Will update with a new version soon.
This one's fine tuned for gold (tp and sl size, and contract size for a 100k account)
Cheers,
Ivan Labrie
Time at Mode FX

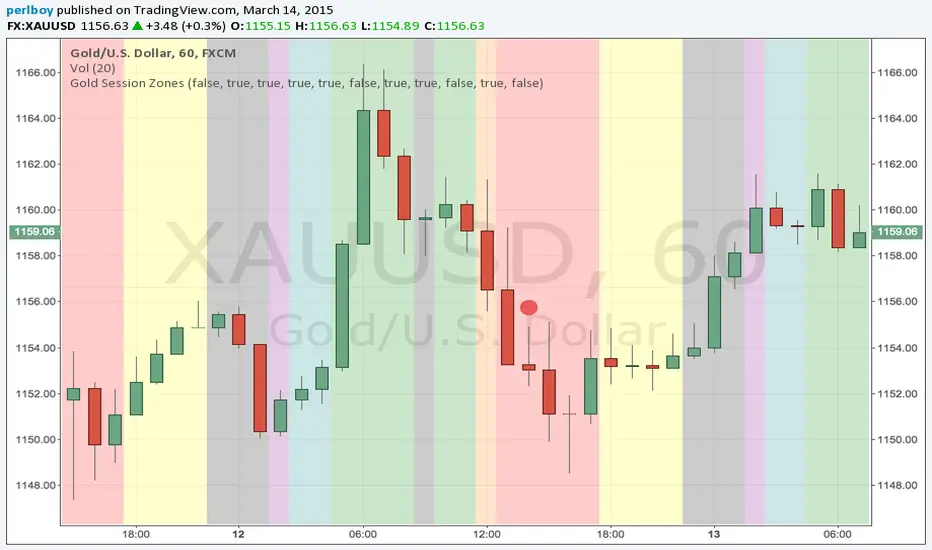
Gold Market Session Breakdown [perlboy] - UTC OnlyVery simple script to apply colours to Gold market areas. Includes Globex daily stop and morning London fix. Doesn't know how to handle weekends (yet).
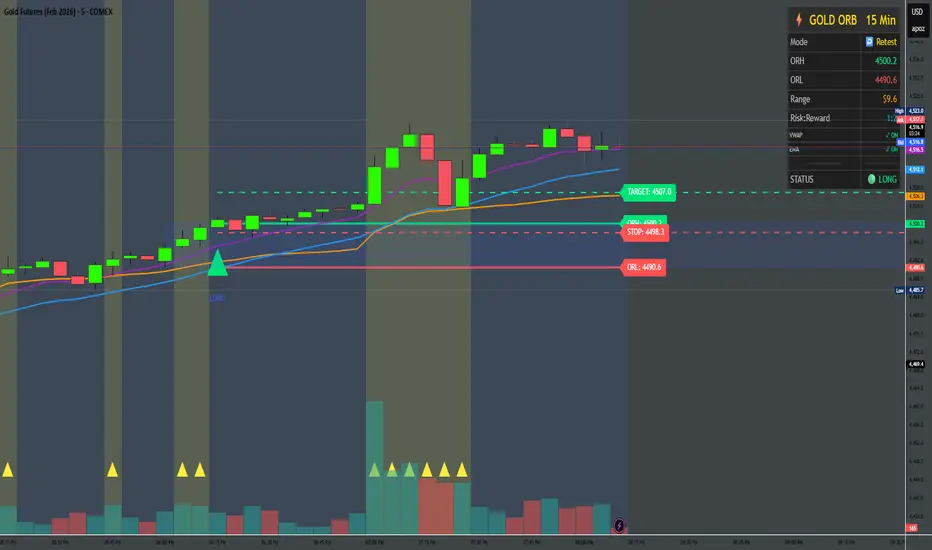
Gold ORB Strategy (3/5/15/30 Min)It's a multi-mode Opening Range Breakout system for Gold futures that automates the detection of the 7:20-7:23 AM CT opening range and provides clear visual signals for four different trading styles.
In Plain English:
"It draws a box around gold's first 3 minutes of trading, then alerts you when price breaks out with confirmation from volume, VWAP, and moving averages. It automatically calculates your entry, stop, and target prices based on your chosen strategy style."
What Makes It Unique:
4 Trading Personalities in One Tool:
Aggressive = "I want every breakout, I'll manage the fakeouts"
Confirmed = "Show me only moves that close beyond the range"
Retest = "I want the pullback entry for better R:R"
Fibonacci = "Let me buy the dip after the initial move"
Smart Confluence Filtering:
Doesn't just show every breakout
Checks if VWAP agrees (trend filter)
Verifies EMA alignment (momentum filter)
Flags volume spikes (conviction filter)
Complete Trade Management:
Automatically calculates stops (3 different methods)
Shows profit targets based on your R:R preference
Labels stick to price levels as you scroll
Visual dashboard shows all key info at a glance
What It's NOT:
Not a "buy here, sell there" robot - you still need to read the market
Not foolproof - no strategy works every day
Not optimized yet - you'll need to backtest and adjust settings for your style
The Real Value:
It takes a proven strategy from your research and makes it systematic and repeatable. Instead of manually drawing boxes and calculating stops every morning, it does the math and shows you exactly where the setup is.
Gold Asia Session Highlighter [IST]Here is a polished description and guide for your Gold Asia Session Highlighter. You can use this text for a YouTube description, a Telegram post, or a PDF guide to explain the tool to others.
Gold Asia Session Highlighter (IST) | Visual Indicator
This is a custom TradingView indicator designed to simplify the Gold Asia Strategy. Instead of automating trades, this tool purely handles the visuals. It automatically highlights the correct Asia Session time window (adjusting for Winter/Summer hours) and marks the exact points where you should draw your Fixed Range Volume Profile (FRVP) tool.
Perfect for: Traders who prefer to draw their own FRVP levels manually but want to ensure they are using the exact, error-free time range every single day.
Features
✅ Automatic Time Zone: Strictly calculated using IST (Indian Standard Time), so you don't need to convert time zones manually.
✅ Smart Season Detection: Automatically switches between Winter Session (04:30 – 06:25) and Summer Session (03:30 – 05:25) based on the current month.
✅ Visual Guidance: Highlights the session background and places "START" and "END" labels on the exact candles.
✅ Zero Clutter: Clean visuals with no moving averages or strategy lines—just the session box.
How to Use It
Add to Chart: Apply the script to your Gold (XAUUSD) 5-minute chart. You will see a blue highlighted box appear during the Asia session.
Locate the Labels:
Look for the blue START label (bottom of the candle).
Look for the red END label (top of the candle).
Draw Your FRVP:
Select the Fixed Range Volume Profile tool from your TradingView toolbar.
Click exactly on the START candle.
Drag and release exactly on the END candle.
Trade: You now have the exact Value Area High (VAH), Value Area Low (VAL), and Point of Control (POC) for the day. Use your breakout strategy as usual!

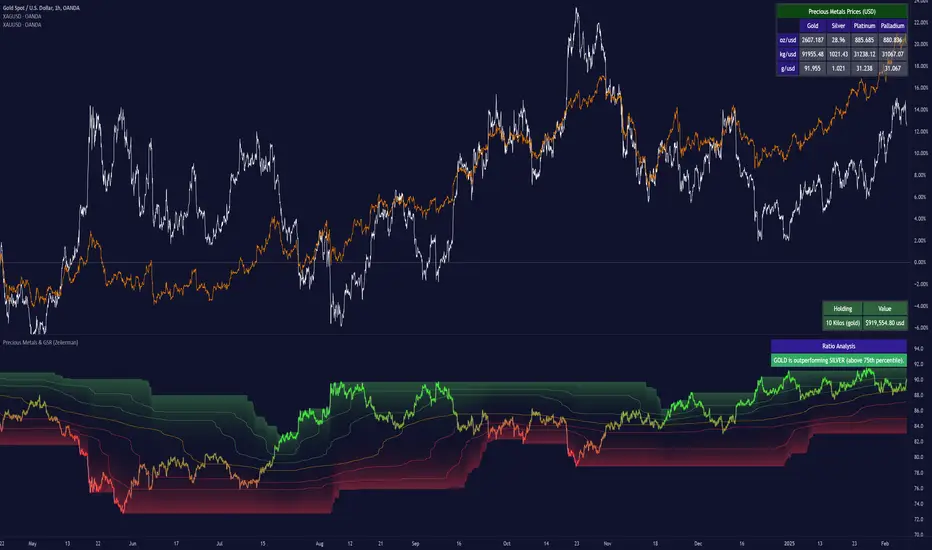
Precious Metals & GSR (Zeiierman)█ Overview
The Precious Metals & GSR (Zeiierman) is designed to provide traders and investors with a comprehensive view of the Gold-Silver Ratio (GSR) and other precious metal relationships. This tool helps evaluate the relative strength between different metals by analyzing their price ratios over historical periods, using quantile-based analysis and trend interpretation tables to highlight key insights.
The Gold-Silver Ratio (GSR) is a widely utilized metric in precious metals trading, representing the number of silver ounces required to purchase one ounce of gold. Historically, this ratio has fluctuated, providing traders with insights into the relative value of these two metals. By analyzing the GSR, traders can identify potential trading opportunities based on historical patterns and market dynamics.
By integrating customizable percentile bands, gradient coloring for performance visualization, and dynamic ratio analysis, this indicator assists in understanding how one metal is performing relative to another, making it useful for trend tracking, risk management, and portfolio allocation.
█ How It Works
The Precious Metals & GSR Indicator operates by fetching the latest prices of the selected precious metals in the user's chosen currency. It then calculates the ratio between two selected metals (Metal 1 and Metal 2) and analyzes this ratio over a specified period. By computing quantile bands and high/low bands, the indicator provides insights into the historical performance and current standing of the ratio.
⚪ Ratio Calculation
The core of this indicator is the metal ratio, calculated by dividing the price of Metal 1 by Metal 2.
A rising ratio means Metal 1 is outperforming Metal 2.
A falling ratio means Metal 2 is outperforming Metal 1.
The indicator automatically retrieves live market prices of Gold, Silver, Platinum, and Palladium to compute the ratio.
⚪ Quantile Ratio Bands
The indicator calculates the highest (max) and lowest (min) ratio levels over a user-defined period.
It also plots quantile bands at the 10th, 25th, 50th (median), 75th, and 90th percentiles, providing deeper statistical insights into how extreme or average the current ratio is.
The median (Q50) acts as a reference level, showing whether the ratio is above or below its historical midpoint.
⚪ Interpretation Table
The Ratio Interpretation Table provides a text-based summary of the ratio’s strength.
It detects whether Metal 1 is at a historical high, low, or within common ranges.
This helps traders and investors make informed decisions on whether the ratio is overextended, mean-reverting, or trending.
⚪ Precious Metals Table
Displays live market prices for Gold, Silver, Platinum, and Palladium.
Prices are shown in different units (oz, kg, grams, and troy ounces) based on user preferences.
A color-coded system highlights price changes, making it easier to track market movements.
⚪ Physical Holding Calculator
Users can enter their precious metal holdings to estimate their current value.
The system adjusts calculations based on weight, purity (24K, 22K, etc.), and unit of measurement.
The holding value is displayed in the selected currency (USD, EUR, GBP, etc.).
█ How to Use
⚪ Trend Identification
If the ratio is increasing, Metal 1 is gaining strength relative to Metal 2 → Possible Long Position on Metal 1 / Short on Metal 2
If the ratio is decreasing, Metal 2 is gaining strength relative to Metal 1 → Possible Short Position on Metal 1 / Long on Metal 2
⚪ Mean Reversion Strategy
When the ratio reaches the 90th percentile, Metal 1 is historically overextended (expensive) compared to Metal 2.
Traders may look to sell Metal 1 and buy Metal 2, expecting the ratio to decline back toward its historical average.
Example (Gold/Silver Ratio): If the GSR is above the 90th percentile, gold is very expensive relative to silver, suggesting a potential buying opportunity in silver and/or a selling opportunity in gold.
When the ratio reaches the 10th percentile, Metal 1 is historically undervalued (cheap) compared to Metal 2.
Traders may look to buy Metal 1 and sell Metal 2, expecting the ratio to rise back toward its historical average.
Example (Gold/Silver Ratio): If the GSR is below the 10th percentile, gold is very cheap relative to silver, suggesting a potential buying opportunity in gold and/or a selling opportunity in silver.
⚪ Common Strategy Based on GSR Insights
A common approach involves monitoring the ratio for extreme values based on historical data. When the ratio reaches historically high levels, it suggests that gold is expensive relative to silver, potentially indicating a buying opportunity for silver and/or a selling opportunity for gold. Conversely, when the ratio is at historically low levels, silver is expensive relative to gold, suggesting a potential buying opportunity for gold and/or selling opportunity for silver. This mean-reversion strategy relies on the tendency of the GSR to return to its historical average over time.
⚪ Hedging & Portfolio Diversification
If Gold is strongly outperforming Silver, investors may shift allocations to balance risk.
If Silver is rapidly gaining on Gold, it may indicate increased industrial demand or speculative interest.
⚪ Inflation & Economic Cycles
A rising Gold-Silver ratio often correlates with economic downturns and increased risk aversion.
A falling Gold-Silver ratio may signal stronger economic growth and higher inflation expectations.
█ Settings
Precious Metals Table
Select which metals to display (Gold, Silver, Platinum, Palladium)
Choose measurement units (oz, kg, grams, troy ounces)
Ratio Analysis
Select Metal 1 & Metal 2 for ratio calculation
Set historical length for quantile calculations
Interpretation Table
Enable automated insights based on ratio levels
Physical Holdings Calculator
Enter metal weight, purity, and unit
Select calculation currency
-----------------
Disclaimer
The content provided in my scripts, indicators, ideas, algorithms, and systems is for educational and informational purposes only. It does not constitute financial advice, investment recommendations, or a solicitation to buy or sell any financial instruments. I will not accept liability for any loss or damage, including without limitation any loss of profit, which may arise directly or indirectly from the use of or reliance on such information.
All investments involve risk, and the past performance of a security, industry, sector, market, financial product, trading strategy, backtest, or individual's trading does not guarantee future results or returns. Investors are fully responsible for any investment decisions they make. Such decisions should be based solely on an evaluation of their financial circumstances, investment objectives, risk tolerance, and liquidity needs.