Volume bar range# Volume Bar Range (VBR) Indicator
## Overview
The Volume Bar Range indicator identifies key support and resistance levels based on high-volume price bars. It creates a visual range that represents significant price levels where the market has shown strong interest through volume confirmation.
## Features
### Visual Range Display
- **Blue/Aqua Area**: Shows the price range of the highest volume bar within the lookback period
- **Dynamic Color**: The fill color changes to indicate whether the range is stable (aqua) or newly updated (white)
- **Boundary Lines**: Invisible white lines mark the upper and lower boundaries of the range
### Trading Signals
- **BUY Signal**: Blue upward arrow appears when price breaks above the resistance level with volume confirmation
- **SELL Signal**: Black downward arrow appears when price breaks below the support level with volume confirmation
## How to Use
### Setup
1. Apply the indicator to any chart
2. The indicator automatically identifies the highest volume bar in the last 55 periods
3. The price range of this high-volume bar becomes your support/resistance zone
### Trading Strategy
- **Range Trading**: Trade within the identified support/resistance range
- **Breakout Trading**: Enter positions when price breaks above resistance (BUY) or below support (SELL)
- **Volume Confirmation**: Only take signals when current volume exceeds the 21-period average
### Signal Interpretation
- **BUY Signal**: Price closes above the resistance level with above-average volume
- **SELL Signal**: Price closes below the support level with above-average volume
- **No Signal**: Price remains within the range or volume is insufficient
## Key Parameters
- **Lookback Period**: 55 bars (automatically identifies the highest volume bar)
- **Volume MA**: 21-period simple moving average for volume confirmation
- **Signal Size**: Tiny markers to avoid chart clutter
## Best Practices
- Use on multiple timeframes for confirmation
- Combine with other technical indicators for stronger signals
- Pay attention to the color changes in the range area
- Consider market context and overall trend direction
## Ideal Markets
- Works well on liquid markets with consistent volume patterns
- Effective on stocks, forex, and crypto markets
- Best suited for swing trading and medium-term analysis
This indicator is particularly useful for traders who rely on volume analysis and want to identify key price levels where the market has shown significant interest.
Search in scripts for "VOLUME BAR"

Volume Bars ColorThe Volume Bars Color indicator for the TradingView platform is a tool for visualizing trading volumes based on their values. It colors volume histograms on the chart according to their relative magnitude compared to the average volume and standard deviation.
Features:
- Volumes exceeding the average value by more than one standard deviation are considered large and highlighted in red.
- Volumes lower than the average by more than one standard deviation are considered low and displayed in orange.
- Volumes within one standard deviation of the average are considered average and marked in gray.
- Users can adjust the period for calculating the average volume.
How to Use:
- Add the indicator to your chart.
- Adjust the period for calculating the average volume using the corresponding parameter.
- Observe how trading volumes on the chart are colored based on their magnitude relative to the average volume and standard deviation.
Example Usage:
On the chart, red volume histograms indicate periods of high trading activity, orange histograms signify low trading volume, and gray histograms represent average trading volume.
Remember:
The Volume Bars Color indicator helps visualize trading volumes and identify periods with the most active or least active trading volume. However, it should be used in conjunction with other tools and analytical methods to make informed trading decisions.

[RS]Volume BarsVolume Bars inspired by Richard W. Arms Jr. EquiVolume.
the bars change in width by the amount of volume within that bar.
see links in the source code for reference.
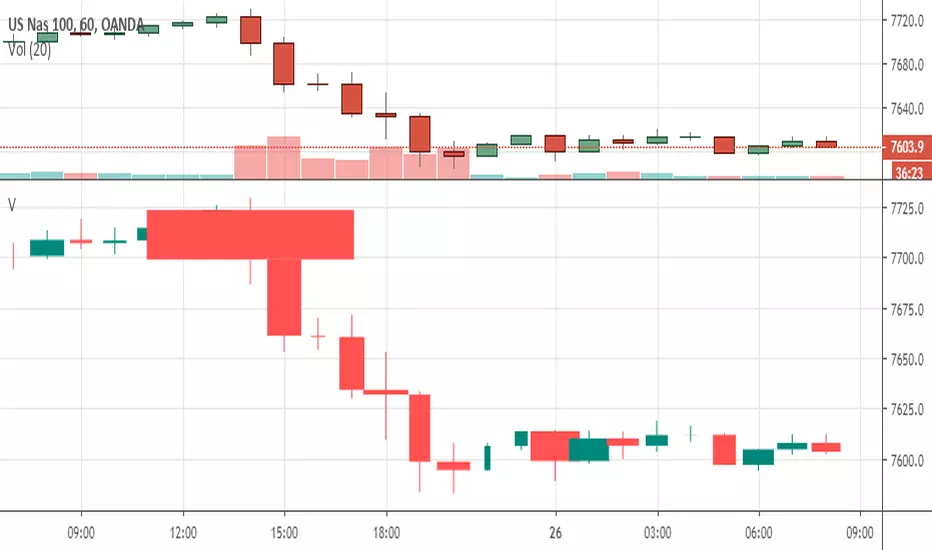
Volume Bar Breakout and Breakdown IndicatorVolume shows strength of a movement and highest volume shows the region that pushed price to certain extent with full strength. Breakout or Breakout of the highest volume bar range shows continuity further push by sellers or buyers indicating a trend continuation for a small period if not for long duration. Entries can be taken once signal is generated with stoploss as recommended.
Guidelines:
Don't trade if range is too large
Don't trade if Breakdown or Breakdown candle body / range is too large or if there is high volatility
Use additional indicator to get the idea of overall trend analysis

High Volume Bars (Advanced)High Volume Bars (Advanced)
High Volume Bars (Advanced) is a Pine Script v6 indicator for TradingView that highlights bars with unusually high volume, with several ways to define “unusual”:
Classic: volume > moving average + N × standard deviation
Change-based: large change in volume vs previous bar
Z-score: statistically extreme volume values
Robust mode (optional): median + MAD, less sensitive to outliers
It can:
Recolor candles when volume is high
Optionally highlight the background
Optionally plot volume bands (center ± spread × multiplier)
⸻
1. How it works
At each bar the script:
Picks the volume source:
If Use Volume Change vs Previous Bar? is off → uses raw volume
If on → uses abs(volume - volume )
Computes baseline statistics over the chosen source:
Lookback bars
Moving average (SMA or EMA)
Standard deviation
Optionally replaces mean/std with robust stats:
Center = median (50th percentile)
Spread = MAD (median absolute deviation, scaled to approx σ)
Builds bands:
upper = center + spread * multiplier
lower = max(center - spread * multiplier, 0)
Flags a bar as “high volume” if:
It passes the mode logic:
Classic abs: volume > upper
Change mode: abs(volume - volume ) > upper
Z-score mode: z-score ≥ multiplier
AND the relative filter (optional): volume > average_volume * Min Volume vs Avg
AND it is past the first Skip First N Bars from the start of the chart
Colors the bar and (optionally) the background accordingly.
⸻
2. Inputs
2.1. Statistics
Lookback (len)
Number of bars used to compute the baseline stats (mean / median, std / MAD).
Typical values: 50–200.
StdDev / Z-Score Multiplier (mult)
How far from the baseline a bar must be to count as “high volume”.
In classic mode: volume > mean + mult × std
In z-score mode: z ≥ mult
Typical values: 1.0–2.5.
Use EMA Instead of SMA? (smooth_with_ema)
Off → uses SMA (slower but smoother).
On → uses EMA (reacts faster to recent changes).
Use Robust Stats (Median & MAD)? (use_robust)
Off → mean + standard deviation
On → median + MAD (less sensitive to a few insane spikes)
Useful for assets with occasional volume blow-ups.
⸻
2.2. Detection Mode
These inputs control how “unusual” is defined.
• Use Volume Change vs Previous Bar? (mode_change)
• Off (default) → uses absolute volume.
• On → uses abs(volume - volume ).
You then detect jumps in volume rather than absolute size.
Note: This is ignored if Z-Score mode is switched on (see below).
• Use Z-Score on Volume? (Overrides change) (mode_zscore)
• Off → high volume when raw value exceeds the upper band.
• On → computes z-score = (value − center) / spread and flags a bar as high when z ≥ multiplier.
Z-score mode can be combined with robust stats for more stable thresholds.
• Min Volume vs Avg (Filter) (min_rel_mult)
An extra filter to ignore tiny-volume bars that are statistically “weird” but not meaningful.
• 0.0 → no filter (all stats-based candidates allowed).
• 1.0 → high-volume bar must also be at least equal to average volume.
• 1.5 → bar must be ≥ 1.5 × average volume.
• Skip First N Bars (from start of chart) (skip_open_bars)
Skips the first N bars of the chart when evaluating high-volume conditions.
This is mostly a safety / cosmetic option to avoid weird behavior on very early bars or backfill.
⸻
2.3. Visuals
• Show Volume Bands? (show_bands)
• If on, plots:
• Upper band (upper)
• Lower band (lower)
• Center line (vol_center)
These are plotted on the same pane as the script (usually the price chart).
• Also Highlight Background? (use_bg)
• If on, fills the background on high-volume bars with High-Vol Background.
• High-Vol Bar Transparency (0–100) (bar_transp)
Controls the opacity of the high-volume bar colors (up / down).
• 0 → fully opaque
• 100 → fully transparent (no visible effect)
• Up Color (upColor) / Down Color (dnColor)
• Regular bar colors (non high-volume) for up and down bars.
• Up High-Vol Base Color (upHighVolBase) / Down High-Vol Base Color (dnHighVolBase)
Base colors used for high-volume up/down bars. Transparency is applied on top of these via bar_transp.
• High-Vol Background (bgHighVolColor)
Background color used when Also Highlight Background? is enabled.
⸻
3. What gets colored and how
• Bar color (barcolor)
• Up bar:
• High volume → Up High-Vol Color
• Normal volume → Up Color
• Down bar:
• High volume → Down High-Vol Color
• Normal volume → Down Color
• Flat bar → neutral gray
• Background color (bgcolor)
• If Also Highlight Background? is on, high-volume bars get High-Vol Background.
• Otherwise, background is unchanged.
⸻
4. Alerts
The indicator exposes three alert conditions:
• High Volume Bar
Triggers whenever is_high is true (up or down).
• High Volume Up Bar
Triggers only when is_high is true and the bar closed up (close > open).
• High Volume Down Bar
Triggers only when is_high is true and the bar closed down (close < open).
You can use these in TradingView’s “Create Alert” dialog to:
• Get notified of potential breakout / exhaustion bars.
• Trigger webhook events for bots / custom infra.
⸻
5. Recommended presets
5.1. “Classic” high-volume detector (closest to original)
• Lookback: 150–200
• StdDev / Z-Score Multiplier: 1.0–1.5
• Use EMA Instead of SMA?: off
• Use Robust Stats?: off
• Use Volume Change vs Previous Bar?: off
• Use Z-Score on Volume?: off
• Min Volume vs Avg (Filter): 0.0–1.0
Behavior: Flags bars whose volume is notably above the recent average (plus a bit of noise filtering), same spirit as your initial implementation.
⸻
5.2. Volatility-aware (Z-score) mode
• Lookback: 100–200
• StdDev / Z-Score Multiplier: 1.5–2.0
• Use EMA Instead of SMA?: on
• Use Robust Stats?: on (if asset has huge spikes)
• Use Volume Change vs Previous Bar?: off (ignored anyway in z-score mode)
• Use Z-Score on Volume?: on
• Min Volume vs Avg (Filter): 0.5–1.0
Behavior: Flags bars that are “statistically extreme” relative to recent volume behavior, not just absolutely large. Good for assets where baseline volume drifts over time.
⸻
5.3. “Wake-up bar” (volume acceleration)
• Lookback: 50–100
• StdDev / Z-Score Multiplier: 1.0–1.5
• Use EMA Instead of SMA?: on
• Use Robust Stats?: optional
• Use Volume Change vs Previous Bar?: on
• Use Z-Score on Volume?: off
• Min Volume vs Avg (Filter): 0.5–1.0
Behavior: Emphasis on sudden increases in volume rather than absolute size – useful to catch “first active bar” after a quiet period.
⸻
6. Limitations / notes
• Time-of-day effects
The script currently treats the entire chart as one continuous “session”. On 24/7 markets (crypto) this is fine. For regular-session assets (equities, futures), volume naturally spikes at open/close; you may want to:
• Use a shorter Lookback, or
• Add a session-aware filter in a future iteration.
• Illiquid symbols
On very low-liquidity symbols, robust stats (Use Robust Stats) and a non-zero Min Volume vs Avg can help avoid “everything looks extreme” problems.
• Overlay behavior
overlay = true means:
• Bars are recolored on the price pane.
• Volume bands are also drawn on the price pane if enabled.
If you want a dedicated panel for the bands, duplicate the logic in a separate script with overlay = false.

Lower Timeframe Volume BarsDescription:
The Lower Timeframe Volume Bars indicator enhances your TradingView experience by allowing you to visualize volume data from lower timeframes on your current chart. This powerful tool helps you gain deeper insights into volume trends and activity that are not immediately visible on higher timeframe charts. Specifically, it shows the volume data from the last bar of the selected lower timeframe.
Key Features:
Volume Bars from Lower Timeframes:
Display volume data from 1-minute or 1-second timeframes directly on higher timeframe charts, such as 15 minutes or 1 hour.
Each volume bar represents the aggregated volume from the lower timeframe within the selected higher timeframe period.
Enhanced Volume Analysis:
Gain a more detailed understanding of volume spikes and troughs that may be hidden in higher timeframe charts.
Identify potential market turning points and confirm trends with precise volume data.
Customizable Display:
Adjust the appearance of volume bars to fit your chart style and preferences.
Configure settings such as color, size, and positioning of volume bars for optimal visibility and clarity.
Seamless Integration:
Easily add the indicator to any chart in TradingView with a few clicks.
Works in conjunction with other technical indicators and tools to provide a comprehensive analysis environment.
How to Use:
Add the Lower Timeframe Volume Bars indicator to your chart.
Select the lower timeframe you wish to fetch volume data from (e.g., 1-minute or 1-second).
Customize the display settings to match your charting style.
Observe the volume bars overlaying your current chart to analyze volume activity across different timeframes, specifically showing the last bar's volume.
Use the detailed volume information to make informed trading decisions and enhance your market analysis.
Benefits:
Increased Clarity: See detailed volume activity that is often lost in higher timeframe aggregation.
Better Decision Making: Make more informed trading decisions with a clear view of volume trends and spikes.
Improved Trend Confirmation: Use lower timeframe volume data to confirm the strength and sustainability of market trends.
Enhance your trading strategy and gain a deeper understanding of market dynamics with the Lower Timeframe Volume Bars indicator. Visualize, analyze, and trade with confidence by leveraging detailed volume insights from lower timeframes.

Buy-Sell Volume Bar Gauge [By MUQWISHI]▋ INTRODUCTION :
The Buy-Sell Volume Bar Gauge is developed to provide traders with a detailed analysis of volume in bars using a low timeframe, such as a 1-second interval, to measure the dominance of buy and sell for each bar. By highlighting the balance between buying and selling activities, the Buy-Sell Volume Bar Gauge helps traders identify potential volume momentum of a bar; aimed at being a useful tool for day traders and scalpers.
_______________________
▋ OVERVIEW:
_______________________
▋ METHODOLOGY:
The concept is based on bars from a lower timeframe within the current chart timeframe bar, where volume is categorized into Up, Down, and Neutral Volume, with each one displayed as a portion of a column plot. Up Volume is recorded when the price experiences a positive change, Down Volume occurs when the price experiences a negative change, and Neutral Volume is observed when the price shows no significant change.
_______________________
▋ INDICATOR SETTINGS:
(1) Fetch data from the selected lower timeframe. Note: If the selected timeframe is invalid (higher than chart), the indicator will automatically switch to 1 second.
(2) Price Source.
(3) Treating Neutral Data (Price Source) as
Neutral: In a lower timeframe, when the bar has no change in its price, the volume is counted as Neutral Volume.
Previous Move: In a lower timeframe, when the bar has no change in its price, the volume is counted as the previous change; “Up Volume” if the previous change was positive, and “Down Volume” if the previous change was negative.
Opposite Previous Move: In a lower timeframe, when the bar has no change in its price, the volume is counted as the opposite previous change; “Up Volume” if the previous change was negative, and “Down Volume” if the previous change was positive.
(4) Average Volume Length, it's used for lighting/darkening columns in a plot.
(5) Enable Alert.
(7) Total bought (%) Level.
(8) Total Sold (%) Level.
_____________________
▋ COMMENT:
The Buy-Sell Volume Bar Gauge can be taken as confirmation for predicting the next move, but it should not be considered a major factor in making a trading decision.

High Volume BarsThis indicator highlights the highest volume bullish and bearish bars within a specified lookback period. It provides a visual representation of significant volume activity, which can be useful for identifying potential trend reversals or continuations.
Key Features:
Customizable lookback period to find highest volume bars
Lime-colored bars for bullish (up) volume
Fuchsia-colored bars for bearish (down) volume
Filled areas between high and low of highest volume bars
Easy-to-read visual cues for volume analysis
The indicator scans the specified number of previous bars to identify the highest volume bullish and bearish bars. It then colors these bars and draws filled areas to make them stand out on the chart. This can help traders quickly spot areas of significant buying or selling pressure.
Use this indicator to:
Identify potential support and resistance levels
Spot volume-based trend reversals
Confirm breakouts or breakdowns
Enhance your volume analysis in conjunction with price action
Adjust the lookback period to fine-tune the indicator's sensitivity to recent volume activity. A longer lookback period will identify more significant volume events, while a shorter period will be more responsive to recent changes.
Note: This indicator is best used in combination with other technical analysis tools and should not be relied upon solely for making trading decisions.
Realtime Volume Bars w Market Buy/Sell/Neutral split & Mkt Delta
What is it?
A tool that shows Real-time Volume bars split into 3 components: (1) Market Buy Volume - i.e., the volume that got transacted on upticks; (2) Market Sell Volume - i.e., the volume that got transacted on downticks;
and, (3) Neutral Volume - i.e., the volume that got transacted without a change in price. (This feature can be turned off if you want normal volume bars).
Market delta (i.e., Market Buy Volume - Market Sell Volume) is also displayed above each volume bar. (On by default; can be switched off from Settings)
The split and Market Delta data are ONLY AVAILABLE FOR REAL-TIME BARS. Historical bars are shown just like regular ones. The dotted line marks the start of real-time data (i.e., the bar from which the indicator started collecting and displaying data). You will see accurate data for bars to the right of this line. The longer you keep a chart open with the study enabled, the more data it collects and displays, and the better your analysis can potentially be.
Note that the data gets reset every time any of the options is changed, the market is switched, the browser is refreshed, or the script is reloaded
DATA ISN'T STORED. I.e., every time a new symbol is loaded, the previous symbol's data is lost. So if you intend to monitor a symbol, you would need to keep it loaded all the time.
Who is it for?
For traders who are used to analyzing buy/sell activity using market buy/sell volume and market delta information
Although you can use this independently as well, use it in conjunction with "Market Delta Volume for Realtime Bars" indicator to get a better visual representation of the numbers.

Colored Volume Bars [LazyBear]Edgar Kraut proposed this simple colored volume bars strategy for swing trading.
This is how the colors are determined:
- If today’s closing price and volume are greater than 'n' days ago, color today’s volume bar green.
- If today’s closing price is greater than 'n' days ago but volume is not, color today’s volume bar blue.
- Similarly, if today’s closing price and volume is less than 'n' days ago, color today’s volume bar orange.
- If today’s closing price is less than 'n' days ago but volume is not, color today’s volume bar red.
Buy the green or blue volume bars, use a 1% trailing stop, and stand aside on red or orange bars.
As you see, this is more for entry confirmation. I have not tested this on any instrument.
You may have to tune the lookback period for your instrument. Default is 10.
More info:
"A color-based system for short-term trading" - www.traders.com
List of all my indicators:

Colored Volume Bars standard deviation from meanThe colour bars:
Green: Price up - Volume > 2 x STD of last 21 bars
Blue: Price up - Volume > 1 x STD of last 21 bars
Maroon: Price down - Volume > 2 x STD of last 21 bars
Purple: Price down - Volume > 1 x STD of last 21 bars
Grey: not high volume bar
Green line: 2 bar sma
Red line: 8 period sma of the greenline
Bollinger band: 55 period sma of the 21 period sma with bands 1.618 deviation from the mean

Slim Ribbon Volume BarsThe Slim Ribbon Volume Bars indicator is intended to be paired with the Slim Ribbon. The Slim Ribbon is also available for free in TradingView. The Slim Ribbon Volume Bars indicator changes the color of the volume bars based on the momentum condition of the Slim Ribbon. When the Ribbons have a bullish condition, the indicator colors the volume bars green. When the Ribbons have a bearish condition, the indicator colors the volume bars red. Finally, when the Ribbons have a neutral condition, the indicator colors the volume bars gray. See below for an overview of the Slim Ribbon.
The Slim Ribbon was developed by Steve Miller. Steve Miller is a 46-year veteran stock, futures and options trader. His badge on the trading floor was his initials, “SLM” and has since gone by the nickname Slim.
The Slim Ribbon is a momentum indicator . It is composed of 3 exponential moving averages (8, 13 and 21). A bullish condition occurs when the 8 period MA is above the 13 period MA and the 13 period MA is above the 21 period MA. A bearish condition occurs when the 8 period MA is below the 13 period MA and the 13 period MA is below the 21 period MA. A neutral condition occurs when the Ribbons are not in alignment.
The Slim Ribbon also notifies you when we transition from one condition to another. A green up arrow indicates that the Slim Ribbon has shifted from a neutral condition to a bullish condition. A red down arrow indicates that the Slim Ribbon has shifted from a neutral condition to a bearish condition. A blue up arrow indicates that we have shifted from a bearish condition to a neutral condition. Lastly, a blue down arrow indicates that we have shifted from a bullish condition to a neutral condition.
We would recommend using the Slim Ribbon on a candlestick chart. Steve Miller believes in the importance of visualizing trends. As a result, we have designed the Slim Ribbon to change the color of the candlesticks based on the condition of the ribbon. When the Slim Ribbon has a bullish condition, the candlesticks will turn green. When the Slim Ribbon has a bearish condition, the candlesticks will turn red. When the Slim Ribbon has a neutral condition, the candlesticks will turn gray.

Clean Volume Bars (Green/Red + Above Avg Highlight)📊 Clean Volume Bars (Green/Red + Above Avg Highlight)
This script provides a clearer view of market volume by combining standard green/red volume bars with dynamic highlights for above-average activity.
Features:
✅ Green / Red Volume Bars – standard visualization:
Green when the candle closes higher than it opened
Red when the candle closes lower than it opened
✅ Average Volume Line – a simple moving average (default 20 periods) to track relative volume.
✅ Above Average Highlights – bars that exceed the average volume are emphasized:
White for above-average bullish volume
Black for above-average bearish volume
How to Use:
Look for white volume spikes during up candles → potential strong bullish activity.
Watch for black volume spikes during down candles → potential strong bearish pressure.
Combine with price action, trend, or other indicators for confluence (this is not a standalone trading system).
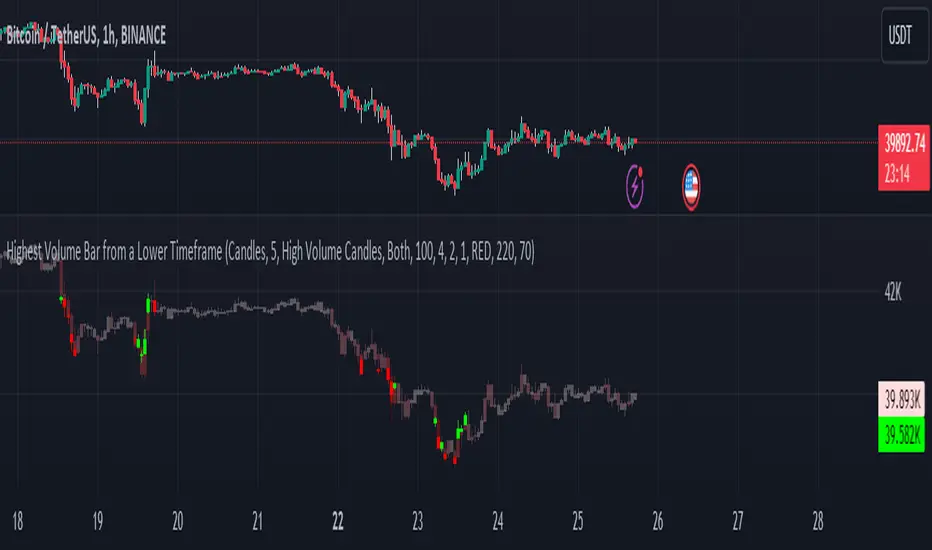
Highest Volume Bar from a Lower TimeframeVolume is an essential indicator in technical analysis as it can signal confirmations of movement, reversals, and more. This indicator was developed to identify candles with high volume in both the current timeframe and a lower timeframe
SETTINGS
The indicator has two display modes: Candles and Volume.
- Candles: it presents a traditional candlestick chart that shows the candles of the current timeframe, along with the candle with the highest volume from the lower timeframe.
- Volume: it features a volume chart displaying the volume of the current timeframe in histogram form, as well as the bar with the highest volume from the lower timeframe represented in columns.
LOWER TIME FRAME SETTINGS
- Lower Time Frame: the lower timeframe to be taken into consideration.
- LTF Candle Display: determines which candles from the current timeframe chart will display the candles with the highest volume from the lower timeframe.
- Volume Display: determines how the volume bars will be presented for both the current timeframe and the lower timeframe.
VOLUME LEVEL SETTINGS
- SMA Period: the time period for calculating the volume average.
- High Volume: the multiplier used to classify a candle as having high volume.
- Medium Volume: the multiplier used to classify a candle as having medium volume.
- Low Volume: the multiplier used to classify a candle as having low volume.
- Show Volume MA: enable this option to display the Volume MA on the chart.
COLOR SETTINGS
- Candle Color: the color to be used in the charts.
- Shade Intensity : the intensity of the shades for volume levels.
- Transparency : the transparency to be used for the candles of the current timeframe when displaying candles with higher volume from the lower timeframe.
Power Indicator - EMAs + VWAP + Volume BarThe Power Indicator is intended to return some exponential moving average, vwap, volume bar, and others. With this compilation, you will be able to use them as one indicator in Trading View.
The components are:
- EMA9 - Exponential Moving Average of 9 days
- EMA21 - Exponential Moving Average of 21 days
- EMA50 - Exponential Moving Average of 50 days
- EMA200 - Exponential Moving Average of 200 days
- Volume Bar - This indicator provides the volume of the candle and its strength by showing different colors. It's a way to check expressive volume in one bar.
- Vwap line
- Indicator
If you have any questions, let me know!
FVE Volatility color-coded Volume bar The FVE is a pure volume indicator. Unlike most of the other indicators
(except OBV), price change doesn?t come into the equation for the FVE
(price is not multiplied by volume), but is only used to determine whether
money is flowing in or out of the stock. This is contrary to the current trend
in the design of modern money flow indicators. The author decided against a
price-volume indicator for the following reasons:
- A pure volume indicator has more power to contradict.
- The number of buyers or sellers (which is assessed by volume) will be the same,
regardless of the price fluctuation.
- Price-volume indicators tend to spike excessively at breakouts or breakdowns.
This study is an addition to FVE indicator. Indicator plots different-coloured volume
bars depending on volatility.

Equivolume Overlay - Volume BarsThis is an addon for displaying volume bars along with Equivolume bars which can be found here

Colored Volume Bars with Standard Deviation from the MeanI have updated the indicator to help visualize volume . The percentage scale is based on a 21 period look back average . The colored volume bars represent volumes that exceed specified standard deviation of this 21 period average as indicated in the figure. The deviation bands are based on a the 55sma of the 21 period average (brown line). A 8 period sma of the 21 moving average (red line) is also indicated.

Colored Volume Bars [LazyBear] with overlayDivs and candle alignment a little easier to see - volume/2 to size correctly - could still use some refining
All credits to LazyBear for his color volume bar source code
C Volume BarsOk do not take this one as serious as I made it as a joke .Its a volume bar that give you such great results and you can call it with fancy names and even hide the code . as there is no signals no one will pay attention that its repaint . And folks can even pay you money for it as its look so good. I even give you the script to show you how generous I am :)
its even better then the fancy name one as it actually give you time frames to choose from.
but on the other hand who said that repainting is bad?
mine look better:)))
