PVSRA Volume Suite with Volume DeltaPVSRA Volume Suite with Volume Delta
🔹 Overview
This indicator is a Volume Suite that enhances PVSRA (Price, Volume, Support, Resistance Analysis) by incorporating Volume Delta and AI-driven predictive alerts. It is designed to help traders analyze volume pressure, market trends, and price movements with color-coded visualizations.
📌 Key Features
PVSRA Volume Color Coding – Highlights vector candles based on extreme volume/spread conditions.
Volume Delta Analysis – Tracks buying/selling pressure using up/down volume data.
AI-Powered Predictive Alerts – Identifies potential trend shifts based on volume and trend context.
Volatility-Adjusted Thresholds – Dynamically adapts volume conditions based on ATR (Average True Range).
Customizable MA & Symbol Overrides – Allows traders to tweak settings for personalized market insights.
Debug & Diagnostic Labels – Shows statistical z-scores, thresholds, and volume dynamics.
How It Works
PVSRA Color Coding – The script classifies candles into four categories based on volume and spread analysis:
🔴 Red Vector → Extreme bearish volume/spread
🟢 Green Vector → Extreme bullish volume/spread
🟣 Violet Vector → Above-average bearish volume
🔵 Blue Vector → Above-average bullish volume
Volume Delta Calculation – Uses lower timeframe volume analysis to estimate up/down volume differentials.
Trend & Predictive Alerts – Combines EMA crossovers with statistical volume analysis to detect potential trend shifts.
Volatility Adaptation – Adjusts volume thresholds based on ATR, making signals more reliable in changing market conditions.
Custom Symbol Override – Fetches PVSRA data from a different instrument, useful for index-based volume analysis.
Customizable Inputs
PVSRA Color Settings – Modify candle color schemes for better visual clarity.
Volume Delta Colors – Customize delta volume body, wick, and border colors.
AI Settings – Tune z-score thresholds, lookback periods, and enable predictive alerts.
Symbol Overrides – Analyze volume from a different market or asset.
Moving Average (MA) Settings – Display a volume-based moving average for trend confirmation.
Important Notes
Works best on intraday timeframes where volume data is reliable.
Lower timeframe volume delta estimates might not be precise for all assets.
No guarantees of accuracy – Use alongside other confluence tools for decision-making.
Credits & Open-Source Notice
This script is based on PVSRA methodologies and integrates Volume Delta analysis. Special thanks to Traders Reality and TradingView for their contributions to volume-based analysis.
Search in scripts for "ai"

MEMEQUANTMEMEQUANT
This script is a comprehensive and specialized tool designed for tracking trends and money flow within meme coins and DEX tokens. By combining various features such as trend lines, Fibonacci levels, and category-based indices, it helps traders make informed decisions in highly volatile markets.
Key Features:
1. Category-Based Indices:
• Tracks the performance of token categories like:
• AI Agent Tokens
• AI Tokens
• Animal Tokens
• Murad Picks
• Each category consists of leader tokens, which are selected based on their higher market cap and trading volume. These tokens act as benchmarks for their respective categories.
• Visualizes category indices in a line chart to identify trends and compare money flow between categories.
2. Fibonacci Correction Zones:
• Highlights key retracement levels (e.g., 60%, 70%, 80%).
• These levels are crucial for identifying potential reversal zones, commonly observed in meme coin trading patterns.
• Fully customizable to match individual trading strategies.
3. Trend Lines:
• Automatically detects major support and resistance levels.
• Separates long-term and short-term trend lines, allowing traders to focus on significant price movements.
4. Enhanced Info Table:
• Provides real-time insights, including:
• % Distance from All-Time High (ATH)
• Current Trading Volume
• 50-bar Average Volume
• Volume Change Percentage
• Displays information in an easy-to-read table on the chart.
5. Customizable Settings:
• Users can adjust transparency, colors, and ranges for Fibonacci zones, trend lines, and the table.
• Enables or disables individual features (e.g., Fibonacci, trend lines, table) based on preferences.
How It Works:
1. Tracking Money Flow Across Categories:
• The script calculates the market cap to volume ratio for each category of tokens to help identify the dominant trend.
• A higher ratio indicates greater liquidity and stability, while a lower ratio suggests higher volatility or price manipulation.
2. Identifying Retracement Patterns:
• Leverages common retracement behaviors (e.g., 70% correction levels) observed in meme coins to detect potential reversal zones.
• Combines this with trend line analysis for additional confirmation.
3. Leader Tokens as Indicators:
• Each category is represented by its leader tokens, which have historically higher liquidity and market cap. This allows the script to accurately reflect the overall trend in each category.
When to Use:
• Trend Analysis: To identify which category (e.g., AI Tokens or Animal Tokens) is leading the market.
• Reversal Zones: To spot potential support or resistance levels using Fibonacci zones.
• Money Flow: To understand how capital is moving across different token categories in real time.
Who Is This For?
This script is tailored for:
• Traders specializing in meme coins and DEX tokens.
• Those looking for an edge in trend-based trading by analyzing market cap, volume, and retracement levels.
• Anyone aiming to track money flow dynamics between different token categories.
Future Updates:
This is the initial version of the script. Future updates may include:
• Support for additional token categories and DEX data.
• More advanced pattern recognition and alerts for volume and price anomalies.
• Enhanced visualization for historical data trends.
With this tool, traders can combine money flow analysis with the 60-70% retracement strategy, turning it into a powerful assistant for navigating the fast-paced world of meme coins and DEX tokens.
This script is designed to provide meaningful insights and practical utility for traders, adhering to TradingView’s standards for originality, clarity, and user value.

MultiSector Performance Tracker [LuxAlgo]The MultiSector Performance Tracker tool shows the overall performance of different crypto market sectors within a selected time frame, overlaid on a single chart for easy comparison.
Users can customize the time frame to suit their specific needs, whether daily, weekly, monthly, or yearly.
🔶 USAGE
The tool displays the performance of up to 6 crypto sectors within a selected time period, such as each day, week, month or year, or from the beginning of the year for any of the last 4 years.
The sectors and tickers within each sector are as follows:
Layer 1: CRYPTOCAP:ETH CRYPTOCAP:SOL CRYPTOCAP:TON
Layer 2: SEED_DONKEYDAN_MARKET_CAP:MATIC TSX:MNT AMEX:ARB
CEX: CRYPTOCAP:BNB CRYPTOCAP:OKB NYSE:BGB
DEX: CRYPTOCAP:UNI LSE:JUP CRYPTOCAP:RUNE
AI: CRYPTOCAP:NEAR GETTEX:TAO CRYPTOCAP:ICP
Ethereum Memes: CRYPTOCAP:PEPE CRYPTOCAP:SHIB CRYPTOCAP:FLOKI
Traders can compare the relative performance of a custom ticker against the sector of their choice and view the average of all sectors.
The tool is fully customizable, allowing traders to enable or disable any of the features or sectors.
🔹 Dashboard
The tool also displays the data in an ascending or descending sector performance dashboard, allowing traders to see at a glance which sectors are overperforming or underperforming.
Other dashboard features include custom ticker vs. sector comparison and sectors average, and traders can choose the location and size of the dashboard.
🔶 SETTINGS
Period: View all data by time period, daily, weekly, etc. Or view data from last year, last 2 years, etc.
Relative Performance Against: Enable/Disable relative performance comparison against a sector.
Use chart ticker: Enable the use of the chart ticker or a custom ticker for relative performance comparison.
🔹 Dashboard
Show Dashboard: Enable / disable Dashboard display.
Order: Choose between ascending and descending order.
Position: Selection of dashboard location.
Size: Selection of dashboard size.
🔹 Style
Show Sectors Labels: Enable / disable sector labels
Layer 1: Enable / disable Layer 1 sector
Layer 2: Enable / disable Layer 2 sector
CEX: Enable / disable CEX sector
DEX: Enable / disable DEX sector
AI: Enable / disable AI sector
Ethereum Memes: Enable / disable Ethereum Memes sector
Average: Enable / disable sectors average display
Custom Ticker: Enable / disable custom ticker display

[Pandora] Error Function Treasure Trove - ERF/ERFI/Sigmoids+PRAISE:
At this time, I have to graciously thank the wonderful minds behind the new "Pine Profiler Mode" (PPM). Directly prior to this release, it allowed me to ascertain script performance even more. While I usually write mostly in highly optimized Pine code, PPM visually identified a few bottlenecks that would otherwise be hard to identify. Anyone who contributed to PPMs creation and testing before release... BRAVO!!! I commend all of those who assisted in it's state-of-the-art engineering and inception, well done!
BACKSTORY:
This script is specifically being released in defense of another member, an exceptionally unique PhD. It was brought to my attention that a script-mod-event occurred, regarding the publishing of a measly antiquated error function (ERF) calculation within his script. This sadly resulted in the now former member jumping ship after receiving unmannerly responses amidst his curious inquiries as to why his erf() was modded. To forbid rusty and rudimentary formulations because a mod-on-duty is temporally offended by a non-nefarious release of code, is in MY opinion an injustice to principles of perpetuating open-source code intended to benefit thousands to millions of community members. While Pine is the heart and soul of TV, the mathematical concepts contributed from the minds of members is the inspirational fuel of curiosity that powers it's pertinent reason to exist and evolve.
It is an indisputable fact that most members are not greatly skilled Pine Poets. Many members may be incapable of innovating robust function code in Pine, even if they have one or more PhDs. We ALL come from various disciplines of mathematical comprehension and education. Some mathematicians are not greatly skilled at coding, while some coders are not exceptional at math. So... what am I to do to attempt to resolve this circumstantial challenge??? Those who know me best are aware that I will always side with "the right side of history" in order to accomplish my primary self-defined missions I choose to accept. Serving as an algorithmic advocate, I felt compelled to intercede by compiling numerous error functions into elegant code of very high caliber that any and every TV member may choose to employ, so this ERROR never happens again.
After weeks of contemplation into algorithms I knew little about, I prioritized myself to resolve an unanticipated matter by creating advanced formulas of exquisitely crafted error functions refined to the best of my current abilities. My aversion for unresolved problems motivated me to eviscerate error function insufficiencies with many more rigid formulations beyond what is thought to exist. ERF needed a proper algorithmic exorcism anyways. In my furiosity, I contemplated an array of madMAXimum diplomatic demolition methods, choosing the chain saw massacre technique to slaughter dysfunctionalities I encountered on a battered ERF roadway. This resulted in prolific solutions that should assuredly endure the test of time. Poetically, as you will come to see, I am ripping the lid off of Pandora's box of error functions in this case to correct wrongs into a splendid bundle of rights for members.
INTENTION:
Error function (ERF) enthusiasts... PREPARE FOR GLORY!! The specific purpose of this script is to deprecate classic error functions with the creation of a fierce and formidable army of superior formulations, each having varying attributes of computational complexity with differing absolute error ranges in their results for multiple compute scenarios. This is NOT an indicator... It is intended to allow members to embark on endeavors to advance the profound knowledge base of this growing worldwide community of 60+ million inquisitive minds. For those of you who believe computational mathematics and statistics is near completion at its finest; I am here to inform you, this is ridiculous to ponder. We are no where near statistical excellence that can and will exist eventually. At this time, metaphorically speaking, we are merely scratching microns off of the surface of the skin of a statistical apple Isaac Newton once pondered.
THIS RELEASE:
Following weeks of pondering methodical experiments beyond the ordinary, I am liberating these wild notions of my error function explorations to the entire globe as copyleft code, not just Pine. This Pandora's basket of ERFs is being openly disclosed for the sake of the sanctity of mathematics, empirical science (not the garbage we are told by CONTROLocrats to blindly trust), revolutionary cutting edge engineering, cosmology, physics, information technology, artificial intelligence, and EVERY other mathematical branch of human knowledge being discovered over centuries. I do believe James Glaisher would favor my aims concerning ERF aspirations embracing the "Power of Pine".
The included functions are intended for TV members to use in any way they see fit. This is a gift to ALL members to foster future innovative excellence on this platform. Any attempt to moderate this code without notification of "self-evident clear and just cause" will be considered an irrevocable egregious action. The original foundational PURPOSE of establishing script moderation (I clearly remember) was primarily to maintain active vigilance over a growing community against intentional nefarious actions and/or behaviors in blatant disrespect to other author's works AND also thwart rampant copypasting bandit operations, all while accommodating balanced principles of fairness for an educational community cause via open source publishing that should support future algorithmic inventions well beyond my lifespan.
APPLICATIONS:
The related error functions are used in probability theory, statistics, and numerous and engineering scientific disciplines. Its key characteristics and applications are innumerable in computational realms. Its versatility and significance make it a fundamental tool in arenas of quantitative analysis and scientific research...
Probability Theory - Is widely used in probability theory to calculate probabilities and quantiles of the normal distribution.
Statistics - It's related to the Gaussian integral and plays a crucial role in statistics, especially in hypothesis testing and confidence interval calculations.
Physics - In physics, it arises in the study of diffusion equations, quantum mechanics, and heat conduction problems.
Engineering - Applications exist in engineering disciplines such as signal processing, control theory, and telecommunications.
Error Analysis - It's employed in error analysis and uncertainty quantification.
Numeric Approximations - Due to its lack of a closed-form expression, numerical methods are often employed to approximate erf/erfi().
AI, LLMs, & MACHINE LEARNING:
The error function (ERF) is indispensable to various AI applications, particularly due to its relation to Gaussian distributions and error analysis. It is used in Gaussian processes for regression and classification, probabilistic inference for Bayesian networks, soft margin computation in SVMs, neural networks involving Gaussian activation functions or noise, and clustering algorithms like Gaussian Mixture Models. Improved ERF approximations can enhance precision in these applications, reduce computational complexity, handle outliers and noise better, and improve optimization and convergence, possibly leading to more accurate, efficient, and robust AI systems.
BONUS ALGORITHMS:
While ERFs are versatile, its opposite also exists in the form of inverse error functions (ERFIs). I have also included a modified form of the inverse fisher transform along side MY sigmoid (sigmyod). I am uncertain what sigmyod() may be used for, but it's a culmination of my examinations deep into "sigmoid domains", something I am fascinated by. Whatever implications it may possess, I am unveiling it along with it's cousin functions. For curious minds, this quality of composition seen here is ideally what underlies what I would term "Pandora functionality" that empowers my Pandora indication. I go through hordes of formulations, testing, and inspection to find what appears to be the most beneficial logical/mathematical equation to apply...
SCRIPT OPERATION:
To showcase the characteristics and performance of my ERF/ERFI formulations, I devised a multi-modal script. By using bar_index , I generated a broad sequence of numeric values to input into the first ERF/ERFI parameter. These sequences allow you to inspect the contours of the error function's outputs for both ERF and ERFI. When combined with compute-intensive precision functions (CIPFs), the polynomial function output values can be subtracted from my CIPFs to obtain results of absolute error, displaying the accuracy of the many polynomial estimation functions I tuned in testing for Pine's float environment.
A host of numeric input settings are wildly adjustable to inspect values/curvatures across the range of numeric input sequences. Very large numbers, such as Divisor:100,000,100/Offset:200,000,000 for ERF modes or... Divisor:100,000,100/Offset:100,000,000 for ERFI modes, will display miniscule output values calculated from input values in close proximity to 0.0 for the various estimates, similar to a microscope. ERFI approximations very near in proximity to +/-1.0 will always yield large deviations of absolute error. Dragging/zooming your chart or using the Offset input will aid with visually clipping off those ERFI extremes where float precision functions cannot suffice.
NOTICE:
perf() and perfi() are intended for precision computation (as good as it basically gets) in a float environment. However, they are CPU intensive (especially perfi). I wouldn't recommend these being used in ANY Pine script unless it's an "absolute necessity" to do so to accomplish your goal. I only built them to obtain "absolute error curvatures" of the error functions for the polynomial approximations. These are visible in the accuracy modes in the indicator Settings.
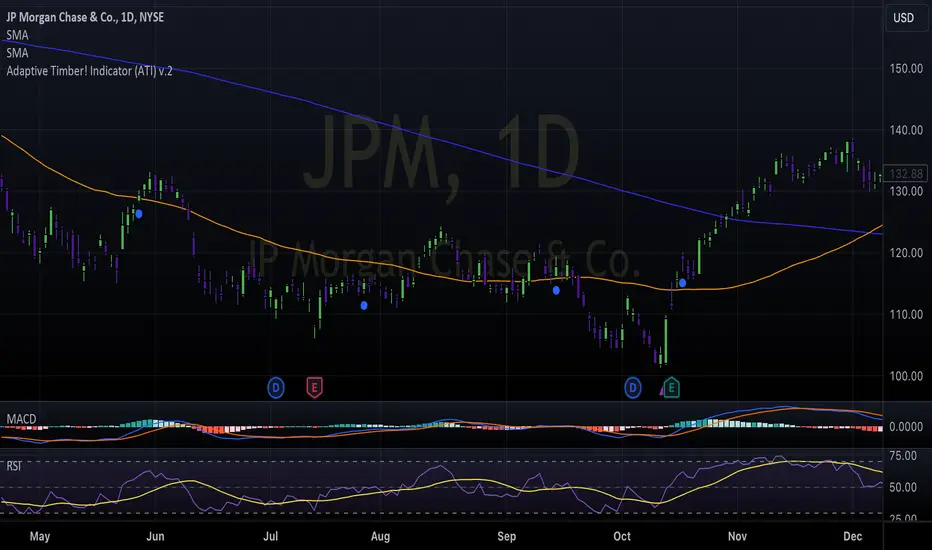
Adaptive Timber! Indicator (ATI)The Adaptive Timber! Indicator (ATI) is a powerful tool designed to identify potential overbought conditions and generate reversal signals in financial markets. It combines multiple technical indicators and market conditions to provide a comprehensive assessment of the likelihood of a price reversal.
How it works:
The ATI uses a combination of the Relative Strength Index (RSI), Moving Average Convergence Divergence (MACD), momentum, and volume to detect overbought conditions and potential reversals. The indicator adapts to the current timeframe, adjusting its parameters accordingly to provide more accurate signals.
Key components:
RSI: The ATI uses the RSI to determine overbought conditions. When the RSI exceeds a specified reversal threshold, it indicates a potential overbought state.
MACD: The indicator monitors the MACD line and signal line to identify moments when they are close to crossing, suggesting a potential trend reversal.
Momentum: The ATI checks if the momentum is increasing, providing confirmation of a potential reversal.
Volume: It analyzes volume to confirm the strength of the reversal signal. A decrease in volume along with overbought conditions adds confidence to the reversal indication.
Timeframe Adaptability: The indicator automatically adjusts its parameters based on the current timeframe, ensuring optimal performance across different time horizons.
How to use:
When the ATI identifies a potential reversal, it displays a colored triangle above the price bars. The color of the triangle represents the strength of the reversal signal: red for a strong signal, orange for a moderate signal, and yellow for a weak signal. Additionally, the indicator plots purple triangles below the price bars as an early warning signal for potential trend reversals.
Traders can use these visual cues along with other technical analysis techniques and risk management strategies to make informed trading decisions. The ATI can be particularly useful for identifying potential short-selling opportunities or for determining exit points in existing long positions.
Creators:
The Adaptive Timber! Indicator (ATI) is the result of a collaborative effort led by Claude , an AI assistant with expertise in financial analysis and programming. The development of the ATI was made possible through the valuable contributions and insights from GPT4 , an advanced language model, Clay , a skilled trader, and Pi AI , Clay's trading assistant.
Claude played a crucial role in designing and implementing the indicator's algorithm, ensuring its robustness and adaptability across different timeframes. GPT4 provided guidance and suggestions for refining the indicator's logic and optimizing its performance. Clay and Pi AI offered their trading expertise and real-world experience to help shape the indicator's functionality and usability.
We would like to express our gratitude to all the members of our trading team for their dedication and hard work in bringing the Adaptive Timber! Indicator to life. We wish all traders the best of luck in their trading endeavors and hope that the ATI will be a valuable addition to their technical analysis toolkit, empowering them to make more informed and profitable trading decisions.
[Excalibur][Pandora][Mosaic] Ultra Spectrum Analyzer@veryfid, you will always be remembered eternally...
ANCIENT MYTHOS AND LORE:
The retellings of "Pandora's Box" serve as a cautionary metaphor depicting an opened container (pithos - jar) that once held profound perils and evils — sufferings that are experienced around the world in various forms. The known and vague mythical box contents actually represent manifestation of evils, situational adversities, and human disparities that have been encountered throughout life for aeons. In contemporary times, a meager list of ordeals would include incidents of deceit, betrayal, corruption, oppression, greed, envy, depravity, conflict, mania, affliction, plague, and mortality. However, as the tale is told, kept and remaining inside the box was the essence of expectant hope (elpis), which may represent the optimism and resilience to overcome immense hardships.
There are other versions of the classic story where Pandora isn't actually the culprit, being her husband Epimetheus was the lid lifting perpetrator and the one who always and actually received the gift(s). Curiously, the interpreted Greek word ‘Pandora’ translated to English, can mean either "all-endowed" or "all-gifting". Much like Pandora herself, who was formed from clay of the earth, the jar also would have been most likely crafted from clay. Conceived as a made-to-order maiden for an arranged marriage, Pandora was given qualities of exquisite beauty, persuasive charm, all while being adorned with jewelry and fine clothing. Olympian premeditated preparations in the didactic fable of 'Works and Days' by Hesiod had blamable intent and would be later used for centuries as denigration of women/mothers. The rest of Hesiod's tale is even worse.
In reality, the entire contrived exploit of incarnating Pandora as a trojan temptress was solely intended as an instrument of infiltration and entrapment for delivery to Epimetheus as an arranged seductive snare. Being a man myself, I find it appalling how the antiquated writings of ancient morphological men have repeatedly ostracized women for many of the ailments of mankind. When in truth, it is far more often that despicable men are the recorded all time winning historical harbingers of global abysmal darkness by means of ideological treachery. Vast historical chronicles since antiquity have frequently recorded who the typical real-world villains truly are and are not. As the stories are told in the first place, it was dictator Zeus along with his Olympian conspirators, who intently implanted malicious spirits into a gifted receptacle to orchestrate planetary suffering and carnage on humankind.
PROLOGUE:
I believe, it is way past overdue to restore Pandora's name to a place of better standing. As I have been peaking into a theoretical pitcher of mathematic mysteria for years now, where no one else dares to look. Once upon a time, I pondered an opposite notion: What if Pandora was originally conceived to solve global problems instead of creating them? Maybe Pandora could have been wielded into existence to wage unrelenting and avenging retribution on every dominance hierarchy and each diabolical enemy intently hostile to humankind. My hypothetical version of Pandora would take the notion of "mors omnibus tyrannis" to a whole other fearsome magnitude. She would cause evil arrogant men to tremble with sheer horror... the kind of fear ALL false gods, despotic kings, tyrannical dictators, controligarchies, and criminal syndicates truly worry about at night. In my opinion, that would be a better fictional story worthy of retelling for aeons.
One unique goliath 21st century adversary is LAG and it must be subdued or minimized. This unyielding nemesis is also known as group delay, processing delay, and algorithmic latency. My eyes are locked onto this opponent with fixation that will never surrender a staring contest. The formidable creature lag is my daily arch enemy destined for defeat in battle. It's losing time after time and bar by bar during the past year of 2023. In my attempts to peer through the murky darkness of useless and deceptive information, I am confident that I have found more suitable answers to many current dilemmas of algorithmic lag.
The internet, using mathematics and the speed of light as a planetary beneficial advantage, has already performed wonders by drastically reducing the delay of dissemination of knowledge. This has garnered a mostly positive rapid acceleration of economic evolution. However, hierarchies of dark forces of chaos and subversion by the thousands lurking in the global shadows are not thrilled about well informed populations. In the present era, new spectrums of strife within planetary societies are being waged, one of the worst forms taking the hideous form of censorship. Other nefarious tactics are hindering economic progress with substantial negativity using heavily funded penetration and infiltration operations. Those sinister operational varieties are spanning psychological, cultural, educational, digital, financial, electoral, scientific, medical, biological, commercial, infrastructural, institutional, and organizational domains.
They are mistakenly meddling with the entire primordial order of planetary natural dynamics. The miscalculations from these malevolent CAUSES will be countered with EFFECTS of immense retaliatory primal veracity having equal or exceedingly more powerful opposition with overwhelming numbers in mass. It is a law embedded within the universe that supersedes ALL laws, known as 'causality'. Everyone, especially programmers, know exactly what to do with predatory infiltrating cockroaches... When tyranny becomes enforced law by agendized policies in any land, order = abs(DUTY) * pow(RIGHT) * exp(PEOPLE).
FUTURE ECONOMIC ADVERSARIAL CHALLENGES:
Just as programmers have to critically analyze our code for BUGS, a scrutinized analysis of the current world around us is at times necessary. It is an empirical statistical fact that a few percent of captains at the helm of industry, commerce, institutes, and governance are monetarily psychopathic. They are often hidden bugs operating within national systems. The subsequent economic consequences result in effects that aren't always clearly obvious to all. Here are a few global economic security issues...
Corrupted immoral code in national operation is an inevitable breakdown waiting to happen. In the harsh future to follow, old degenerate interdependent control systems will need to be dismantled and discarded, eventually succeeded by having resilient parallel arrangements with robust independent fidelity. The coming successive paradigm shifts would include future hardware and the hefty novel algorithms that will run on them afterwards. Evolution is inevitable! The internet must be upgraded and continually programmed securely to the near hardness of diamonds at multiple layers within the operational code to retain peaceful global integrity between international collaborations.
DigitalID is never going to fix an insecure vulnerable titanic network of devices full of holes taking in megatons of water from every direction. Weaponized digital mucking ID dead on arrival is certainly NOT a one size fits all solution and it still doesn't do diddly-squat to secure the internet's DNA as executable code. DigID's real purpose is to manage servitude digitally and keep citizens right where they want them, as subservient slaves.
There is a very specific reason why we have key chain rings in OUR pockets with numerous private keys evolving technologically over time to robustly safeguard individual locks we use every day, duh. AI becoming an artificial sentient hyper intelligence may sooner or later become a potential hazard, especially if it breaks AES192 into a thousand shards of glass. Perilous aspects from artilects will emerge and are coming swiftly. AI is already being weaponized and tasked to mind muzzle expressions of human consciousness.
Also, EMPs from the sun ARE an imminent planetary threat, and no amount of carbon taxation schemes inciting anthropomorphic climate hysteria originating from falsified modeling hocus-pocus is going to protect against extreme solar cycle related X-class phenomena. Our solar system candle called the sun, is not consistently energy irradiation stable if you just glance at SOHO images/video. There are very obvious cyclical frequencies within the dynamics of the sun's energetic activity that affect planets far beyond earth. The earth already has a built-in natural thermometer indicating that oceans have been rising very linearly for thousands of years since the last ice age, submerging entire ancient cities under coastal water dozens of meters.
BEAR with me and pardon my French translation, but I have the option to call major league climate BULLshite. There is no hardcore "anthropomorphic climate crisis" proof. It is a crisis in failed modeling that is insufficient to properly estimate colossal computations with dircet limited empirical data with enough accuracy to anticipate higly probable future outcomes. People deserve solid science instead of slanderous smackdowns and slighted statistics. 400ppm of atmospheric CO2 is nothing compared to previously existing 1600ppm concentrations acquired from ancient indirect historical observations at a time when early humans were hunter gatherers driving gas guzzlers.
Western climate-monger fortune tellers are scamming every nation on earth, betraying the collective human species worldwide by climate hype strangulation. Wait until the sheeple with dinner forks turn on the rabid wolves in shepherds's clothing; it has already begun. What these predatory profiteering fraudsters are not telling you is WATER (H2O) in earth's atmosphere is the all time dominating and potent greenhouse gas, always has been, not CO2. Dr. Willie Soon has explained it in the best of ways with clarity. Misleaders, banksterCorpses, and mediaPresstitutes are immensely involved in this hot model scheme and like keeping people right where they want them, force fed with mental filth with regularly scheduled socially engineered programming.
Beware of agendas and isms. The ESGovernanceAgenda is ready made economic coffin nails. I'll explain this very simply, a future green war on carbon is a silent war on carbon lifeforms and economies. Many of the smiling faces you can actually see on the world stage pulling levers are often the coldest blooded deceivers beyond anything you can ever imagine. In truth, corporate agents and policies are the greatest devastators to ecologies, while in concert, they are incessantly waging blame campaign agendas with subversive narratives by targeting consumers as the wrongdoers.
Why am I mentioning all these adversarial difficulties? Well, the intertangling myriads of tomorrow's "bundle of burdens" in a future box ALL have to be thoroughly analyzed, sifted through, and dealt with tenaciously now and in the future by generations to come in every nation state. Some days I wonder if Hesiod's fiction was taken from reality over 2000 years ago to WARN future world inhabitants. In the scope of economics, the series of incidents that have or will lead up to major world events, will need to have the frequency of related occurrences examined that lead up to crucial points in time historically. In order to prevent future disparities, our progeny will look backwards into history with ultra clarity and vigilance to see how corrupted society once was by hordes of overlords twisted by obsessive delusions of absolute power over the entire human species. There is no human race, only diverse genetic multiformity expressed from the DNA code of humankind exists.
We can't simply put the lid back on low entropy hydroCarbons and a broadband globalNet without having an implemented proven replacement or upgrade. It's far too late, leaving only wiser security chess moves forward as the only viable options. Nikola Tesla was dreaming of this daily in order to build every foundation of modern civilization that we now enjoy today and take for granted. Humanity still has to evolve by unlocking hidden secrets of mother nature. For instance, nations powered by endless geothermal electricity and deuterium fusion WILL solve a lot of the world's problems. Imagine our world dominantly powered by extreme abundant amounts of heavy water... Lady destiny awaits and begs for the future to be built securely, by eventual abandonment of antiquated wheelworks that eventually deserve to be hurled into the annihilatory dustbin of history.
SPECTRAL BURDENS:
Ephemeral 'spectral contents' are extremely difficult to decipher with the least amount of lag, especially while they reside within a noise ridden non-stationary environment. When 'lifting the lid off' of series analysis to peek with quick discernment, distinguishing between real-time relevant signals differing from intertwining undesirable randomness in a crowded information space, requires special kinds of intricate extraction. Due to the nature of fractal chaos, any novel spectral method is better than the scanty few we have now. Firstly, let's comprehend agilities of interpreting a spectrum's structure...
SPECTRAL ANALYSIS PURPOSE AND INTENTION:
Frequency Analysis - Spectral analysis serves a crucial purpose in unraveling the frequency composition of a signal. Its primary intention is to explore the intricacies of a dataset by identifying dominant frequencies and unveiling inherent cyclical patterns. This foundational understanding forms the basis for improving analyses.
Power Spectrum Visualization - The visualization of a signal's power spectrum is a key objective in spectral analysis. By portraying how power is distributed across different frequencies, the goal is to provide a visual representation of the signal's energy landscape. This insight aids with grasping the significance of various frequency components obtained from a larger whole.
Signal Characteristics - Understanding the traits of a signal is another vital goal. Spectral analysis seeks to characterize the nature of the signal, unveiling its periodicity, trends, or irregularities. This knowledge is instrumental in deciphering the behavior of the signal over time, fostering a deeper comprehension.
Algorithmic Adaptation - Spectral analyzer estimation can play a pivotal role in algorithmic development. By assisting with the creation of algorithms sensitive to specific frequency ranges, one possible advantage is to enable real-time adaptability. This adaptability approach may allow algorithms to respond dynamically to variations in different spectral components, potentially enhancing their efficacy.
Market Analysis - In the realm of trading systems and financial markets, spectral analysis methods can serve as applicable functions when studying market dynamics. By 'uncovering' trends, cycles, and anomalies within financial instruments, this analytical proficiency can aid traders and algorithm developers with making better informed decisions based on the spectral attributes of market data.
Noise/Interference Detection - Another purpose of spectral analysis is to identify and scrutinize undesirable elements within a signal, such as noise or interference. One benefit would be to facilitate the development of strategies to mitigate or eliminate these unwanted components, ultimately refining the quality of a given signal with filtration.
INTRODUCTION:
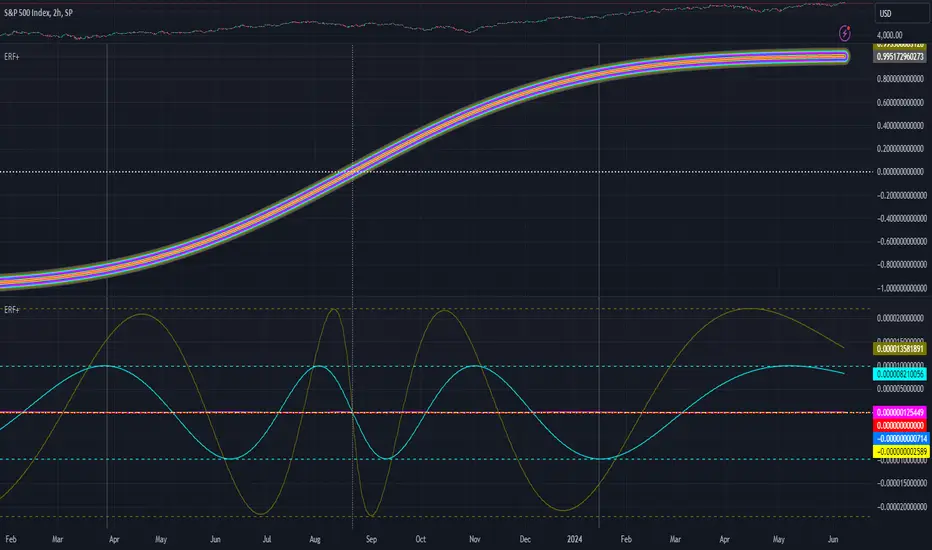
Allow me to introduce Pandora! What you see in the demonstration above, I've named it "Pandora Periodogram", which is also referred to as 'Ultra Spectrum Analyzer' (USA) for technical minds. Firstly, this is NOT technically speaking an indicator like most others. I would describe it as an avant-garde cycle period detector obtaining accurate spectral estimates on market data with Pine Script v5.0. USA is a spectral analysis cryptid that I can only describe as being an alien saber in nature. It is my rendering of spectral wrath unleashed. With time and history to come, my HOPE is this instrument will reveal Excalibur like aspects capable of slicing up a spectrum craftily, traits long thought to be a mythical enigma.
It is not modified forms of either Autocorrelation Periodogram (ACP) or MESA. Pandora's Periodogram embodies an entirely distinct design, adorned with glamourous color, by incorporating several of my most profound, highly refined technological innovations that I have poetically composed into being. What I have forged in Pine, has essentially manifested as a zero lag spectrum analyzer. Pandora easily peeks inside a single signal source more effectively to inspect for hidden spectres, revealing invisible apparitions inside data with improved clarity...
My 'Ultra Spectrum Analyzer' bears an eerie likeness to Autocorrelation Periodogram, but it possesses no autocorrelation and the other small hindrances of ACP that I formerly encountered. While ACP does have a few shortcomings, a few bars of lag, and high frequency bias, it is still phenomenal code. ACP is one answer to spectral enigmas, but not the only one. Developers can utilize this detector by creating scripts that employ a "Dominant Cycle Source" input to adaptively govern algorithms. If you are capable of building suitable algorithms for direct tethering to Autocorrelation Periodogram, then this is your next step in evolutionary application to tether to when you are ready. ACP is a good place to start building upon as an exploratory vessel, before you might ponder using USA. Once you do obtain dynamic ACP sweetness with only a few pesky bars of dominant cycle induced lag, USA may be your tool chest choice without the burden of subtle ACP lag.
USA is possibly the end of my quest for spectral bliss, for the time being. However, I still suspect there is more room for upgrades to Pandora in the future. I must mention, as an overture, this won't be the last of Pandora tech that you will witness, as my literal "out of the box thinking" will unleash many additional creations upon this Earth. The "Power of Pine" merely serves as the beginning foundational phase... Some of my futuristic dreams and daydreams of TradingView are droplets in a wavy ocean of economic providence and potential.
What I am crafting in poetic form is born out of raw curiosity. Future creations are probably best kept private for now, but I will present my future tech with beauty and elegance as it should rightfully be. There's one catch, I have absolutely no idea what this and my future marvels may do to the future of digital signal processing (DSP) and markets. I do fear any insane AI or MALEficent entity ever seeing this code. My innermost hopes and ambitions are always focused on achieving the best result obtainable. What the future can hold, may be absolutely exquisite to gaze upon, maybe even monstrous, or possibly a combination of both.
Notice: Unfortunately, I will not provide any integration support into member's projects at all. My own projects demand too much of my day to day time. I hope you understand. Meanwhile, I'll be applying this on future indication until Mr. Mortality sneaks up behind me.
FEATURES AND CHARACTERISTICS:
I have included as much ultra adjustability as I can humanly muster. Those features being the following and more...
Color Preferences - Four vivid color schemes are available in the original release. The "Ultra Violet" color scheme, in particular, contributes to the indicator's technical title, as it seems to me to reveal the greatest detail of my various spectral color schemes. Color inversion of the four color schemes is also possible, yielding eight schemes in total with predator style visuals. Heatmap transparency control is also provided.
Lag Control - Pandora achieves zero lag spectral approximations, with the added capability to control lag using an input for selectable delay. Note, however, that testing less than zero lag has not been assessed thoroughly due to potential unforeseen instability concerns. Adjustments are provided in either direction for further testing.
Spectral Bias Mitigation - Options for mitigating high OR low-frequency spectral biases are present. One interesting tweak made during development was a subtle form of spectral manipulation, involving a partial reduction of frequency amplitudes influencing either the highest or lowest periodicities. This slightly reduces the impact on the upper and lower portions of the spectrogram and the dominant cycle measurement. What initially surfaced as an unexpected discovery, may now be considered worthy of experimental utility.
Adjustable Periodogram Window Size - The periodogram is adjustable for various window sizes of periodic operation. Exploration up to a periodicity of 59 is obtainable for curiosity's sake. This flexibility challenges the notion that curiosity isn't always a negative trait, contrasting with Hesiod's ancient perspective.
Dominant Cycle Filtration - Filtration of the dominant cycle is achieved with a novel smoother having reduced lag, easily surpassing SuperSmoother's performance. However, defeating lag completely on that one plot() function was elusive.
Tooltips for Control Intention - The settings commonly include handy and informative tooltips that provide information eluding to the intention behind the various controls provided.
Initialization Advantages - Initialization of USA accomplishes what Autocorrelation Periodogram (ACP) didn't. Spectral analysis begins on the earliest visible bars, starting at period 2. Users need to ensure their algorithm's integrity from period 2 upwards to beyond 40ish, establishing a viable operational range for dynamically governing those algorithms. It's notable that stochastics and correlations have a minimum operable critical period of 2, distinct from most low-pass filters that can actually achieve a period of 1 (which is the raw signal itself). Proper initialization of complex IIR filters is particularly effective, especially with smaller initialization periods.
Remaining options and features are comparable to my Enhanced Autocorrelation Periodogram in terms of comprehension, and other upgrades may be added in the future upon discovery.
PERIODOGRAM INTERPRETATION:
The periodogram heatmap renders a power spectrum of a signal visually by color, where the y-axis represents periodicity (frequencies/wavelengths) and the x-axis is delineating time. The y-axis is divided into periods, with each elevation portraying demarcation of periodicity. In this periodogram, the y-axis ranges from 4 at the very bottom to 49 (or greater) at the top, with intermediary values in between, all conveying power of the corresponding frequency component by color. The higher the position ascends on the y-axis, the longer the cycle period or lower the frequency. The x-axis of the periodogram signifies time and is partitioned into equal chart intervals, where each vertical column corresponds to the time interval when the signal was measured. Most recent values/colors are on the right side of the periodogram.
Intensity of the colors on the periodogram signify the power level of the corresponding frequency or cycle period. For example, the "Fiery Embers" color scheme is distinctly like heat intensity from any casual flame witnessed in a small fire from a lighter, match, or campfire. The most intense power exhibited would be represented by the brightest of yellow, while the lowest power would be indicated by the darkest shade of red or just black. By analyzing the pattern of colors across different periods, one may gain insights into the dominant frequency components of the signal and visually identify recurring cycles/patterns of periodicity.

GKD-C CCI Adaptive Smoother [Loxx]Giga Kaleidoscope GKD-C CCI Adaptive Smoother is a Confirmation module included in Loxx's "Giga Kaleidoscope Modularized Trading System".
█ GKD-C CCI Adaptive Smoother
Commodity Channel Index: History, Calculation, and Advantages
The Commodity Channel Index (CCI) is a versatile technical analysis indicator widely used by traders and analysts to identify potential trends, reversals, and trading opportunities in various financial markets. Developed by Donald Lambert in 1980, the CCI was initially designed to analyze the cyclical behavior of commodities. However, its applications have expanded over time to include stocks, currencies, and other financial instruments. The following provides an overview of the CCI's history, explain its calculation, and discuss its advantages compared to other indicators.
History
Donald Lambert, a commodities trader and technical analyst, created the Commodity Channel Index in response to the unique challenges posed by the cyclical nature of the commodities markets. Lambert aimed to develop an indicator that could help traders identify potential turning points in the market, allowing them to capitalize on price trends and reversals. The CCI quickly gained popularity among traders and analysts due to its ability to adapt to various market conditions and provide valuable insights into price movements.
Calculation
The CCI is calculated through the following steps:
1. Determine the typical price for each period: The typical price is calculated as the average of the high, low, and closing prices for each period.
Typical Price = (High + Low + Close) / 3
2. Calculate the moving average of the typical price: The moving average is computed over a specified period, typically 14 or 20 days.
3. Calculate the mean deviation: For each period, subtract the moving average from the typical price, and take the absolute value of the result. Then, compute the average of these absolute values over the specified period.
4. Calculate the CCI: Divide the difference between the typical price and its moving average by the product of the mean deviation and a constant, typically 0.015.
CCI = (Typical Price - Moving Average) / (0.015 * Mean Deviation)
Why CCI is Used and Its Advantages over Other Indicators
The CCI offers several advantages over other technical indicators, making it a popular choice among traders and analysts:
1. Versatility: Although initially developed for commodities, the CCI has proven to be effective in analyzing a wide range of financial instruments, including stocks, currencies, and indices. Its adaptability to different markets and timeframes makes it a valuable tool for various trading strategies.
2. Identification of overbought and oversold conditions: The CCI measures the strength of the price movement relative to its historical average. When the CCI reaches extreme values, it can signal overbought or oversold conditions, indicating potential trend reversals or price corrections.
3. Confirmation of price trends: The CCI can help traders confirm the presence of a price trend by identifying periods of strong momentum. A rising CCI indicates increasing positive momentum, while a falling CCI suggests increasing negative momentum.
4. Divergence analysis: Traders can use the CCI to identify divergences between the indicator and price action. For example, if the price reaches a new high, but the CCI fails to reach a corresponding high, it can signal a weakening trend and potential reversal.
5. Independent of price scale: Unlike some other technical indicators, the CCI is not affected by the price scale of the asset being analyzed. This characteristic allows traders to apply the CCI consistently across various instruments and markets.
The Commodity Channel Index is a powerful and versatile technical analysis tool that has stood the test of time. Developed to address the unique challenges of the commodities markets, the CCI has evolved into an essential tool for traders and analysts in various financial markets. Its ability to identify trends, reversals, and trading opportunities, as well as its versatility and adaptability, sets it apart from other technical indicators. By incorporating the CCI into their analytical toolkit, traders can gain valuable insights into market conditions, enabling them to make more informed decisions and improve their overall trading performance.
As financial markets continue to evolve and grow more complex, the importance of reliable and versatile technical analysis tools like the CCI cannot be overstated. In an environment characterized by rapidly changing market conditions, the ability to quickly identify trends, reversals, and potential trading opportunities is crucial for success. The CCI's adaptability to different markets, timeframes, and instruments makes it an indispensable resource for traders seeking to navigate the increasingly dynamic financial landscape.
Additionally, the CCI can be effectively combined with other technical analysis tools, such as moving averages, trend lines, and candlestick patterns, to create a more comprehensive and robust trading strategy. By using the CCI in conjunction with these complementary techniques, traders can develop a more nuanced understanding of market behavior and enhance their ability to identify high-probability trading opportunities.
In conclusion, the Commodity Channel Index is a valuable and versatile tool in the world of technical analysis. Its ability to adapt to various market conditions and provide insights into price trends, reversals, and trading opportunities make it an essential resource for traders and analysts alike. As the financial markets continue to evolve, the CCI's proven track record and adaptability ensure that it will remain a cornerstone of technical analysis for years to come.
What is the Smoother Moving Average?
The smoother function is a custom algorithm designed to smooth the price data of a financial asset using a moving average technique. It takes the price (src) and the period of the rolling window sample (len) to reduce noise in the data and reveal underlying trends.
smoother(float src, int len)=>
wrk = src, wrk2 = src, wrk4 = src
wrk0 = 0., wrk1 = 0., wrk3 = 0.
alpha = 0.45 * (len - 1.0) / (0.45 * (len - 1.0) + 2.0)
wrk0 := src + alpha * (nz(wrk ) - src)
wrk1 := (src - wrk) * (1 - alpha) + alpha * nz(wrk1 )
wrk2 := wrk0 + wrk1
wrk3 := (wrk2 - nz(wrk4 )) * math.pow(1.0 - alpha, 2) + math.pow(alpha, 2) * nz(wrk3 )
wrk4 := wrk3 + nz(wrk4 )
wrk4
Here's a detailed breakdown of the code, explaining each step and its purpose:
1. wrk, wrk2, and wrk4: These variables are assigned the value of src, which represents the source price of the asset. This step initializes the variables with the current price data, serving as a starting point for the smoothing calculations.
wrk0, wrk1, and wrk3: These variables are initialized to 0. They will be used as temporary variables to hold intermediate results during the calculations.
Calculation of the alpha parameter:
2. The alpha parameter is calculated using the formula: 0.45 * (len - 1.0) / (0.45 * (len - 1.0) + 2.0). The purpose of this calculation is to determine the smoothing factor that will be used in the subsequent calculations. This factor will influence the balance between responsiveness to recent price changes and smoothness of the resulting moving average. A higher value of alpha will result in a more responsive moving average, while a lower value will produce a smoother curve.
Calculation of wrk0:
3. wrk0 is updated with the expression: src + alpha * (nz(wrk ) - src). This step calculates the first component of the moving average, which is based on the current price (src) and the previous value of wrk (if it exists, otherwise 0 is used). This calculation applies the alpha parameter to weight the contribution of the previous wrk value, effectively making the moving average more responsive to recent price changes.
Calculation of wrk1:
4. wrk1 is updated with the expression: (src - wrk) * (1 - alpha) + alpha * nz(wrk1 ). This step calculates the second component of the moving average, which is based on the difference between the current price (src) and the current value of wrk. The alpha parameter is used to weight the contribution of the previous wrk1 value, allowing the moving average to be even more responsive to recent price changes.
Calculation of wrk2:
5. wrk2 is updated with the expression: wrk0 + wrk1. This step combines the first and second components of the moving average (wrk0 and wrk1) to produce a preliminary smoothed value.
Calculation of wrk3:
6. wrk3 is updated with the expression: (wrk2 - nz(wrk4 )) * math.pow(1.0 - alpha, 2) + math.pow(alpha, 2) * nz(wrk3 ). This step refines the preliminary smoothed value (wrk2) by accounting for the differences between the current smoothed value and the previous smoothed values (wrk4 and wrk3 ). The alpha parameter is used to weight the contributions of the previous smoothed values, providing a balance between smoothness and responsiveness.
Calculation of wrk4:
7. Calculation of wrk4:
wrk4 is updated with the expression: wrk3 + nz(wrk4 ). This step combines the refined smoothed value (wrk3) with the previous smoothed value (wrk4 , or 0 if it doesn't exist) to produce the final smoothed value. The purpose of this step is to ensure that the resulting moving average incorporates information from past values, making it smoother and more representative of the underlying trend.
8. Return wrk4:
The function returns the final smoothed value wrk4. This value represents the Smoother Moving Average for the given data point in the price series.
In summary, the smoother function calculates a custom moving average by using a series of steps to weight and combine recent price data with past smoothed values. The resulting moving average is more responsive to recent price changes while still maintaining a smooth curve, which helps reveal underlying trends and reduce noise in the data. The alpha parameter plays a key role in balancing the responsiveness and smoothness of the moving average, allowing users to customize the behavior of the algorithm based on their specific needs and preferences.
What is the CCI Adaptive Smoother?
The Commodity Channel Index (CCI) Adaptive Smoother is an innovative technical analysis tool that combines the benefits of the CCI indicator with a Smoother Moving Average. By adapting the CCI calculation based on the current market volatility, this method offers a more responsive and flexible approach to identifying potential trends and trading signals in financial markets.
The CCI is a momentum-based oscillator designed to determine whether an asset is overbought or oversold. It measures the difference between the typical price of an asset and its moving average, divided by the mean absolute deviation of the typical price. The traditional CCI calculation relies on a fixed period, which may not be suitable for all market conditions, as volatility can change over time.
The introduction of the Smoother Moving Average to the CCI calculation addresses this limitation. The Smoother Moving Average is a custom smoothing algorithm that combines elements of exponential moving averages with additional calculations to fine-tune the smoothing effect based on a given parameter. This algorithm assigns more importance to recent data points, making it more sensitive to recent changes in the data.
The CCI Adaptive Smoother dynamically adjusts the period of the Smoother Moving Average based on the current market volatility. This is accomplished by calculating the standard deviation of the close prices over a specified period and then computing the simple moving average of the standard deviation. By comparing the average standard deviation with the current standard deviation, the adaptive period for the Smoother Moving Average can be determined.
This adaptive approach allows the CCI Adaptive Smoother to be more responsive to changing market conditions. In periods of high volatility, the adaptive period will be shorter, resulting in a more responsive moving average. Conversely, in periods of low volatility, the adaptive period will be longer, producing a smoother moving average. This flexibility enables the CCI Adaptive Smoother to better identify trends and potential trading signals in a variety of market environments.
Furthermore, the CCI Adaptive Smoother is a prime example of the evolution of technical analysis methodologies. As markets continue to become more complex and dynamic, it is crucial for analysts and traders to adapt and improve their techniques to stay competitive. The incorporation of adaptive algorithms, like the Smoother Moving Average, demonstrates the potential for blending traditional indicators with cutting-edge methods to create more powerful and versatile tools for market analysis.
The versatility of the CCI Adaptive Smoother makes it suitable for various trading strategies, including trend-following, mean-reversion, and breakout systems. By providing a more precise measurement of overbought and oversold conditions, the CCI Adaptive Smoother can help traders identify potential entry and exit points with greater accuracy. Additionally, its responsiveness to changing market conditions allows for more timely adjustments in trading positions, reducing the risk of holding onto losing trades.
While the CCI Adaptive Smoother is a valuable tool, it is essential to remember that no single indicator can provide a complete picture of the market. As seasoned analysts and traders, we must always consider a holistic approach, incorporating multiple indicators and techniques to confirm signals and validate our trading decisions. By combining the CCI Adaptive Smoother with other technical analysis tools, such as trend lines, support and resistance levels, and candlestick patterns, traders can develop a more comprehensive understanding of the market and make more informed decisions.
The development of the CCI Adaptive Smoother also highlights the increasing importance of computational power and advanced algorithms in the field of technical analysis. As financial markets become more interconnected and influenced by various factors, including macroeconomic events, geopolitical developments, and technological innovations, the need for sophisticated tools to analyze and interpret complex data sets becomes even more critical.
Machine learning and artificial intelligence (AI) are becoming increasingly relevant in the world of trading and investing. These technologies have the potential to revolutionize how technical analysis is performed, by automating the discovery of patterns, relationships, and trends in the data. By leveraging machine learning algorithms and AI-driven techniques, traders can uncover hidden insights, improve decision-making processes, and optimize trading strategies.
The CCI Adaptive Smoother is just one example of how advanced algorithms can enhance traditional technical indicators. As the adoption of machine learning and AI continues to grow in the financial sector, we can expect to see the emergence of even more sophisticated and powerful analysis tools. These innovations will undoubtedly lead to a new era of technical analysis, where the ability to quickly adapt to changing market conditions and extract meaningful insights from complex data becomes increasingly critical for success.
In conclusion, the CCI Adaptive Smoother is an essential step forward in the evolution of technical analysis. It demonstrates the potential for combining traditional indicators with advanced algorithms to create more responsive and versatile tools for market analysis. As technology continues to advance and reshape the financial landscape, it is crucial for traders and analysts to stay informed and embrace innovation. By integrating cutting-edge tools like the CCI Adaptive Smoother into their arsenal, traders can gain a competitive edge and enhance their ability to navigate the increasingly complex world of financial markets.
Additional Features
This indicator allows you to select from 33 source types. They are as follows:
Close
Open
High
Low
Median
Typical
Weighted
Average
Average Median Body
Trend Biased
Trend Biased (Extreme)
HA Close
HA Open
HA High
HA Low
HA Median
HA Typical
HA Weighted
HA Average
HA Average Median Body
HA Trend Biased
HA Trend Biased (Extreme)
HAB Close
HAB Open
HAB High
HAB Low
HAB Median
HAB Typical
HAB Weighted
HAB Average
HAB Average Median Body
HAB Trend Biased
HAB Trend Biased (Extreme)
What are Heiken Ashi "better" candles?
Heiken Ashi "better" candles are a modified version of the standard Heiken Ashi candles, which are a popular charting technique used in technical analysis. Heiken Ashi candles help traders identify trends and potential reversal points by smoothing out price data and reducing market noise. The "better formula" was proposed by Sebastian Schmidt in an article published by BNP Paribas in Warrants & Zertifikate, a German magazine, in August 2004. The aim of this formula is to further improve the smoothing of the Heiken Ashi chart and enhance its effectiveness in identifying trends and reversals.
Standard Heiken Ashi candles are calculated using the following formulas:
Heiken Ashi Close = (Open + High + Low + Close) / 4
Heiken Ashi Open = (Previous Heiken Ashi Open + Previous Heiken Ashi Close) / 2
Heiken Ashi High = Max (High, Heiken Ashi Open, Heiken Ashi Close)
Heiken Ashi Low = Min (Low, Heiken Ashi Open, Heiken Ashi Close)
The "better formula" modifies the standard Heiken Ashi calculation by incorporating additional smoothing, which can help reduce noise and make it easier to identify trends and reversals. The modified formulas for Heiken Ashi "better" candles are as follows:
Better Heiken Ashi Close = (Open + High + Low + Close) / 4
Better Heiken Ashi Open = (Previous Better Heiken Ashi Open + Previous Better Heiken Ashi Close) / 2
Better Heiken Ashi High = Max (High, Better Heiken Ashi Open, Better Heiken Ashi Close)
Better Heiken Ashi Low = Min (Low, Better Heiken Ashi Open, Better Heiken Ashi Close)
Smoothing Factor = 2 / (N + 1), where N is the chosen period for smoothing
Smoothed Better Heiken Ashi Open = (Better Heiken Ashi Open * Smoothing Factor) + (Previous Smoothed Better Heiken Ashi Open * (1 - Smoothing Factor))
Smoothed Better Heiken Ashi Close = (Better Heiken Ashi Close * Smoothing Factor) + (Previous Smoothed Better Heiken Ashi Close * (1 - Smoothing Factor))
The smoothed Better Heiken Ashi Open and Close values are then used to calculate the smoothed Better Heiken Ashi High and Low values, resulting in "better" candles that provide a clearer representation of the market trend and potential reversal points.
It's important to note that, like any other technical analysis tool, Heiken Ashi "better" candles are not foolproof and should be used in conjunction with other indicators and analysis techniques to make well-informed trading decisions.
Heiken Ashi "better" candles, as mentioned previously, provide a clearer representation of market trends and potential reversal points by reducing noise and smoothing out price data. When using these candles in conjunction with other technical analysis tools and indicators, traders can gain valuable insights into market behavior and make more informed decisions.
To effectively use Heiken Ashi "better" candles in your trading strategy, consider the following tips:
Trend Identification: Heiken Ashi "better" candles can help you identify the prevailing trend in the market. When the majority of the candles are green (or another color, depending on your chart settings) and there are no or few lower wicks, it may indicate a strong uptrend. Conversely, when the majority of the candles are red (or another color) and there are no or few upper wicks, it may signal a strong downtrend.
Trend Reversals: Look for potential trend reversals when a change in the color of the candles occurs, especially when accompanied by longer wicks. For example, if a green candle with a long lower wick is followed by a red candle, it could indicate a bearish reversal. Similarly, a red candle with a long upper wick followed by a green candle may suggest a bullish reversal.
Support and Resistance: You can use Heiken Ashi "better" candles to identify potential support and resistance levels. When the candles are consistently moving in one direction and then suddenly change color with longer wicks, it could indicate the presence of a support or resistance level.
Stop-Loss and Take-Profit: Using Heiken Ashi "better" candles can help you manage risk by determining optimal stop-loss and take-profit levels. For instance, you can place your stop-loss below the low of the most recent green candle in an uptrend or above the high of the most recent red candle in a downtrend.
Confirming Signals: Heiken Ashi "better" candles should be used in conjunction with other technical indicators, such as moving averages, oscillators, or chart patterns, to confirm signals and improve the accuracy of your analysis.
In this implementation, you have the choice of AMA, KAMA, or T3 smoothing. These are as follows:
Kaufman Adaptive Moving Average (KAMA)
The Kaufman Adaptive Moving Average (KAMA) is a type of adaptive moving average used in technical analysis to smooth out price fluctuations and identify trends. The KAMA adjusts its smoothing factor based on the market's volatility, making it more responsive in volatile markets and smoother in calm markets. The KAMA is calculated using three different efficiency ratios that determine the appropriate smoothing factor for the current market conditions. These ratios are based on the noise level of the market, the speed at which the market is moving, and the length of the moving average. The KAMA is a popular choice among traders who prefer to use adaptive indicators to identify trends and potential reversals.
Adaptive Moving Average
The Adaptive Moving Average (AMA) is a type of moving average that adjusts its sensitivity to price movements based on market conditions. It uses a ratio between the current price and the highest and lowest prices over a certain lookback period to determine its level of smoothing. The AMA can help reduce lag and increase responsiveness to changes in trend direction, making it useful for traders who want to follow trends while avoiding false signals. The AMA is calculated by multiplying a smoothing constant with the difference between the current price and the previous AMA value, then adding the result to the previous AMA value.
T3
The T3 moving average is a type of technical indicator used in financial analysis to identify trends in price movements. It is similar to the Exponential Moving Average (EMA) and the Double Exponential Moving Average (DEMA), but uses a different smoothing algorithm.
The T3 moving average is calculated using a series of exponential moving averages that are designed to filter out noise and smooth the data. The resulting smoothed data is then weighted with a non-linear function to produce a final output that is more responsive to changes in trend direction.
The T3 moving average can be customized by adjusting the length of the moving average, as well as the weighting function used to smooth the data. It is commonly used in conjunction with other technical indicators as part of a larger trading strategy.
█ Giga Kaleidoscope Modularized Trading System
Core components of an NNFX algorithmic trading strategy
The NNFX algorithm is built on the principles of trend, momentum, and volatility. There are six core components in the NNFX trading algorithm:
1. Volatility - price volatility; e.g., Average True Range, True Range Double, Close-to-Close, etc.
2. Baseline - a moving average to identify price trend
3. Confirmation 1 - a technical indicator used to identify trends
4. Confirmation 2 - a technical indicator used to identify trends
5. Continuation - a technical indicator used to identify trends
6. Volatility/Volume - a technical indicator used to identify volatility/volume breakouts/breakdown
7. Exit - a technical indicator used to determine when a trend is exhausted
What is Volatility in the NNFX trading system?
In the NNFX (No Nonsense Forex) trading system, ATR (Average True Range) is typically used to measure the volatility of an asset. It is used as a part of the system to help determine the appropriate stop loss and take profit levels for a trade. ATR is calculated by taking the average of the true range values over a specified period.
True range is calculated as the maximum of the following values:
-Current high minus the current low
-Absolute value of the current high minus the previous close
-Absolute value of the current low minus the previous close
ATR is a dynamic indicator that changes with changes in volatility. As volatility increases, the value of ATR increases, and as volatility decreases, the value of ATR decreases. By using ATR in NNFX system, traders can adjust their stop loss and take profit levels according to the volatility of the asset being traded. This helps to ensure that the trade is given enough room to move, while also minimizing potential losses.
Other types of volatility include True Range Double (TRD), Close-to-Close, and Garman-Klass
What is a Baseline indicator?
The baseline is essentially a moving average, and is used to determine the overall direction of the market.
The baseline in the NNFX system is used to filter out trades that are not in line with the long-term trend of the market. The baseline is plotted on the chart along with other indicators, such as the Moving Average (MA), the Relative Strength Index (RSI), and the Average True Range (ATR).
Trades are only taken when the price is in the same direction as the baseline. For example, if the baseline is sloping upwards, only long trades are taken, and if the baseline is sloping downwards, only short trades are taken. This approach helps to ensure that trades are in line with the overall trend of the market, and reduces the risk of entering trades that are likely to fail.
By using a baseline in the NNFX system, traders can have a clear reference point for determining the overall trend of the market, and can make more informed trading decisions. The baseline helps to filter out noise and false signals, and ensures that trades are taken in the direction of the long-term trend.
What is a Confirmation indicator?
Confirmation indicators are technical indicators that are used to confirm the signals generated by primary indicators. Primary indicators are the core indicators used in the NNFX system, such as the Average True Range (ATR), the Moving Average (MA), and the Relative Strength Index (RSI).
The purpose of the confirmation indicators is to reduce false signals and improve the accuracy of the trading system. They are designed to confirm the signals generated by the primary indicators by providing additional information about the strength and direction of the trend.
Some examples of confirmation indicators that may be used in the NNFX system include the Bollinger Bands, the MACD (Moving Average Convergence Divergence), and the MACD Oscillator. These indicators can provide information about the volatility, momentum, and trend strength of the market, and can be used to confirm the signals generated by the primary indicators.
In the NNFX system, confirmation indicators are used in combination with primary indicators and other filters to create a trading system that is robust and reliable. By using multiple indicators to confirm trading signals, the system aims to reduce the risk of false signals and improve the overall profitability of the trades.
What is a Continuation indicator?
In the NNFX (No Nonsense Forex) trading system, a continuation indicator is a technical indicator that is used to confirm a current trend and predict that the trend is likely to continue in the same direction. A continuation indicator is typically used in conjunction with other indicators in the system, such as a baseline indicator, to provide a comprehensive trading strategy.
What is a Volatility/Volume indicator?
Volume indicators, such as the On Balance Volume (OBV), the Chaikin Money Flow (CMF), or the Volume Price Trend (VPT), are used to measure the amount of buying and selling activity in a market. They are based on the trading volume of the market, and can provide information about the strength of the trend. In the NNFX system, volume indicators are used to confirm trading signals generated by the Moving Average and the Relative Strength Index. Volatility indicators include Average Direction Index, Waddah Attar, and Volatility Ratio. In the NNFX trading system, volatility is a proxy for volume and vice versa.
By using volume indicators as confirmation tools, the NNFX trading system aims to reduce the risk of false signals and improve the overall profitability of trades. These indicators can provide additional information about the market that is not captured by the primary indicators, and can help traders to make more informed trading decisions. In addition, volume indicators can be used to identify potential changes in market trends and to confirm the strength of price movements.
What is an Exit indicator?
The exit indicator is used in conjunction with other indicators in the system, such as the Moving Average (MA), the Relative Strength Index (RSI), and the Average True Range (ATR), to provide a comprehensive trading strategy.
The exit indicator in the NNFX system can be any technical indicator that is deemed effective at identifying optimal exit points. Examples of exit indicators that are commonly used include the Parabolic SAR, the Average Directional Index (ADX), and the Chandelier Exit.
The purpose of the exit indicator is to identify when a trend is likely to reverse or when the market conditions have changed, signaling the need to exit a trade. By using an exit indicator, traders can manage their risk and prevent significant losses.
In the NNFX system, the exit indicator is used in conjunction with a stop loss and a take profit order to maximize profits and minimize losses. The stop loss order is used to limit the amount of loss that can be incurred if the trade goes against the trader, while the take profit order is used to lock in profits when the trade is moving in the trader's favor.
Overall, the use of an exit indicator in the NNFX trading system is an important component of a comprehensive trading strategy. It allows traders to manage their risk effectively and improve the profitability of their trades by exiting at the right time.
How does Loxx's GKD (Giga Kaleidoscope Modularized Trading System) implement the NNFX algorithm outlined above?
Loxx's GKD v1.0 system has five types of modules (indicators/strategies). These modules are:
1. GKD-BT - Backtesting module (Volatility, Number 1 in the NNFX algorithm)
2. GKD-B - Baseline module (Baseline and Volatility/Volume, Numbers 1 and 2 in the NNFX algorithm)
3. GKD-C - Confirmation 1/2 and Continuation module (Confirmation 1/2 and Continuation, Numbers 3, 4, and 5 in the NNFX algorithm)
4. GKD-V - Volatility/Volume module (Confirmation 1/2, Number 6 in the NNFX algorithm)
5. GKD-E - Exit module (Exit, Number 7 in the NNFX algorithm)
(additional module types will added in future releases)
Each module interacts with every module by passing data between modules. Data is passed between each module as described below:
GKD-B => GKD-V => GKD-C(1) => GKD-C(2) => GKD-C(Continuation) => GKD-E => GKD-BT
That is, the Baseline indicator passes its data to Volatility/Volume. The Volatility/Volume indicator passes its values to the Confirmation 1 indicator. The Confirmation 1 indicator passes its values to the Confirmation 2 indicator. The Confirmation 2 indicator passes its values to the Continuation indicator. The Continuation indicator passes its values to the Exit indicator, and finally, the Exit indicator passes its values to the Backtest strategy.
This chaining of indicators requires that each module conform to Loxx's GKD protocol, therefore allowing for the testing of every possible combination of technical indicators that make up the six components of the NNFX algorithm.
What does the application of the GKD trading system look like?
Example trading system:
Backtest: Strategy with 1-3 take profits, trailing stop loss, multiple types of PnL volatility, and 2 backtesting styles
Baseline: Hull Moving Average
Volatility/Volume: Hurst Exponent
Confirmation 1: CCI Adaptive Smoother as shown on the chart above
Confirmation 2: Williams Percent Range
Continuation: CCI Adaptive Smoother
Exit: Rex Oscillator
Each GKD indicator is denoted with a module identifier of either: GKD-BT, GKD-B, GKD-C, GKD-V, or GKD-E. This allows traders to understand to which module each indicator belongs and where each indicator fits into the GKD protocol chain.
Giga Kaleidoscope Modularized Trading System Signals (based on the NNFX algorithm)
Standard Entry
1. GKD-C Confirmation 1 Signal
2. GKD-B Baseline agrees
3. Price is within a range of 0.2x Volatility and 1.0x Volatility of the Goldie Locks Mean
4. GKD-C Confirmation 2 agrees
5. GKD-V Volatility/Volume agrees
Baseline Entry
1. GKD-B Baseline signal
2. GKD-C Confirmation 1 agrees
3. Price is within a range of 0.2x Volatility and 1.0x Volatility of the Goldie Locks Mean
4. GKD-C Confirmation 2 agrees
5. GKD-V Volatility/Volume agrees
6. GKD-C Confirmation 1 signal was less than 7 candles prior
Volatility/Volume Entry
1. GKD-V Volatility/Volume signal
2. GKD-C Confirmation 1 agrees
3. Price is within a range of 0.2x Volatility and 1.0x Volatility of the Goldie Locks Mean
4. GKD-C Confirmation 2 agrees
5. GKD-B Baseline agrees
6. GKD-C Confirmation 1 signal was less than 7 candles prior
Continuation Entry
1. Standard Entry, Baseline Entry, or Pullback; entry triggered previously
2. GKD-B Baseline hasn't crossed since entry signal trigger
3. GKD-C Confirmation Continuation Indicator signals
4. GKD-C Confirmation 1 agrees
5. GKD-B Baseline agrees
6. GKD-C Confirmation 2 agrees
1-Candle Rule Standard Entry
1. GKD-C Confirmation 1 signal
2. GKD-B Baseline agrees
3. Price is within a range of 0.2x Volatility and 1.0x Volatility of the Goldie Locks Mean
Next Candle:
1. Price retraced (Long: close < close or Short: close > close )
2. GKD-B Baseline agrees
3. GKD-C Confirmation 1 agrees
4. GKD-C Confirmation 2 agrees
5. GKD-V Volatility/Volume agrees
1-Candle Rule Baseline Entry
1. GKD-B Baseline signal
2. GKD-C Confirmation 1 agrees
3. Price is within a range of 0.2x Volatility and 1.0x Volatility of the Goldie Locks Mean
4. GKD-C Confirmation 1 signal was less than 7 candles prior
Next Candle:
1. Price retraced (Long: close < close or Short: close > close )
2. GKD-B Baseline agrees
3. GKD-C Confirmation 1 agrees
4. GKD-C Confirmation 2 agrees
5. GKD-V Volatility/Volume Agrees
1-Candle Rule Volatility/Volume Entry
1. GKD-V Volatility/Volume signal
2. GKD-C Confirmation 1 agrees
3. Price is within a range of 0.2x Volatility and 1.0x Volatility of the Goldie Locks Mean
4. GKD-C Confirmation 1 signal was less than 7 candles prior
Next Candle:
1. Price retraced (Long: close < close or Short: close > close)
2. GKD-B Volatility/Volume agrees
3. GKD-C Confirmation 1 agrees
4. GKD-C Confirmation 2 agrees
5. GKD-B Baseline agrees
PullBack Entry
1. GKD-B Baseline signal
2. GKD-C Confirmation 1 agrees
3. Price is beyond 1.0x Volatility of Baseline
Next Candle:
1. Price is within a range of 0.2x Volatility and 1.0x Volatility of the Goldie Locks Mean
2. GKD-C Confirmation 1 agrees
3. GKD-C Confirmation 2 agrees
4. GKD-V Volatility/Volume Agrees
]█ Setting up the GKD
The GKD system involves chaining indicators together. These are the steps to set this up.
Use a GKD-C indicator alone on a chart
1. Inside the GKD-C indicator, change the "Confirmation Type" setting to "Solo Confirmation Simple"
Use a GKD-V indicator alone on a chart
**nothing, it's already useable on the chart without any settings changes
Use a GKD-B indicator alone on a chart
**nothing, it's already useable on the chart without any settings changes
Baseline (Baseline, Backtest)
1. Import the GKD-B Baseline into the GKD-BT Backtest: "Input into Volatility/Volume or Backtest (Baseline testing)"
2. Inside the GKD-BT Backtest, change the setting "Backtest Special" to "Baseline"
Volatility/Volume (Volatility/Volume, Backte st)
1. Inside the GKD-V indicator, change the "Testing Type" setting to "Solo"
2. Inside the GKD-V indicator, change the "Signal Type" setting to "Crossing" (neither traditional nor both can be backtested)
3. Import the GKD-V indicator into the GKD-BT Backtest: "Input into C1 or Backtest"
4. Inside the GKD-BT Backtest, change the setting "Backtest Special" to "Volatility/Volume"
5. Inside the GKD-BT Backtest, a) change the setting "Backtest Type" to "Trading" if using a directional GKD-V indicator; or, b) change the setting "Backtest Type" to "Full" if using a directional or non-directional GKD-V indicator (non-directional GKD-V can only test Longs and Shorts separately)
6. If "Backtest Type" is set to "Full": Inside the GKD-BT Backtest, change the setting "Backtest Side" to "Long" or "Short
7. If "Backtest Type" is set to "Full": To allow the system to open multiple orders at one time so you test all Longs or Shorts, open the GKD-BT Backtest, click the tab "Properties" and then insert a value of something like 10 orders into the "Pyramiding" settings. This will allow 10 orders to be opened at one time which should be enough to catch all possible Longs or Shorts.
Solo Confirmation Simple (Confirmation, Backtest)
1. Inside the GKD-C indicator, change the "Confirmation Type" setting to "Solo Confirmation Simple"
1. Import the GKD-C indicator into the GKD-BT Backtest: "Input into Backtest"
2. Inside the GKD-BT Backtest, change the setting "Backtest Special" to "Solo Confirmation Simple"
Solo Confirmation Complex without Exits (Baseline, Volatility/Volume, Confirmation, Backtest)
1. Inside the GKD-V indicator, change the "Testing Type" setting to "Chained"
2. Import the GKD-B Baseline into the GKD-V indicator: "Input into Volatility/Volume or Backtest (Baseline testing)"
3. Inside the GKD-C indicator, change the "Confirmation Type" setting to "Solo Confirmation Complex"
4. Import the GKD-V indicator into the GKD-C indicator: "Input into C1 or Backtest"
5. Inside the GKD-BT Backtest, change the setting "Backtest Special" to "GKD Full wo/ Exits"
6. Import the GKD-C into the GKD-BT Backtest: "Input into Exit or Backtest"
Solo Confirmation Complex with Exits (Baseline, Volatility/Volume, Confirmation, Exit, Backtest)
1. Inside the GKD-V indicator, change the "Testing Type" setting to "Chained"
2. Import the GKD-B Baseline into the GKD-V indicator: "Input into Volatility/Volume or Backtest (Baseline testing)"
3. Inside the GKD-C indicator, change the "Confirmation Type" setting to "Solo Confirmation Complex"
4. Import the GKD-V indicator into the GKD-C indicator: "Input into C1 or Backtest"
5. Import the GKD-C indicator into the GKD-E indicator: "Input into Exit"
6. Inside the GKD-BT Backtest, change the setting "Backtest Special" to "GKD Full w/ Exits"
7. Import the GKD-E into the GKD-BT Backtest: "Input into Backtest"
Full GKD without Exits (Baseline, Volatility/Volume, Confirmation 1, Confirmation 2, Continuation, Backtest)
1. Inside the GKD-V indicator, change the "Testing Type" setting to "Chained"
2. Import the GKD-B Baseline into the GKD-V indicator: "Input into Volatility/Volume or Backtest (Baseline testing)"
3. Inside the GKD-C 1 indicator, change the "Confirmation Type" setting to "Confirmation 1"
4. Import the GKD-V indicator into the GKD-C 1 indicator: "Input into C1 or Backtest"
5. Inside the GKD-C 2 indicator, change the "Confirmation Type" setting to "Confirmation 2"
6. Import the GKD-C 1 indicator into the GKD-C 2 indicator: "Input into C2"
7. Inside the GKD-C Continuation indicator, change the "Confirmation Type" setting to "Continuation"
8. Inside the GKD-BT Backtest, change the setting "Backtest Special" to "GKD Full wo/ Exits"
9. Import the GKD-E into the GKD-BT Backtest: "Input into Exit or Backtest"
Full GKD with Exits (Baseline, Volatility/Volume, Confirmation 1, Confirmation 2, Continuation, Exit, Backtest)
1. Inside the GKD-V indicator, change the "Testing Type" setting to "Chained"
2. Import the GKD-B Baseline into the GKD-V indicator: "Input into Volatility/Volume or Backtest (Baseline testing)"
3. Inside the GKD-C 1 indicator, change the "Confirmation Type" setting to "Confirmation 1"
4. Import the GKD-V indicator into the GKD-C 1 indicator: "Input into C1 or Backtest"
5. Inside the GKD-C 2 indicator, change the "Confirmation Type" setting to "Confirmation 2"
6. Import the GKD-C 1 indicator into the GKD-C 2 indicator: "Input into C2"
7. Inside the GKD-C Continuation indicator, change the "Confirmation Type" setting to "Continuation"
8. Import the GKD-C Continuation indicator into the GKD-E indicator: "Input into Exit"
9. Inside the GKD-BT Backtest, change the setting "Backtest Special" to "GKD Full w/ Exits"
10. Import the GKD-E into the GKD-BT Backtest: "Input into Backtest"
Baseline + Volatility/Volume (Baseline, Volatility/Volume, Backtest)
1. Inside the GKD-V indicator, change the "Testing Type" setting to "Baseline + Volatility/Volume"
2. Inside the GKD-V indicator, make sure the "Signal Type" setting is set to "Traditional"
3. Import the GKD-B Baseline into the GKD-V indicator: "Input into Volatility/Volume or Backtest (Baseline testing)"
4. Inside the GKD-BT Backtest, change the setting "Backtest Special" to "Baseline + Volatility/Volume"
5. Import the GKD-V into the GKD-BT Backtest: "Input into C1 or Backtest"
6. Inside the GKD-BT Backtest, change the setting "Backtest Type" to "Full". For this backtest, you must test Longs and Shorts separately
7. To allow the system to open multiple orders at one time so you can test all Longs or Shorts, open the GKD-BT Backtest, click the tab "Properties" and then insert a value of something like 10 orders into the "Pyramiding" settings. This will allow 10 orders to be opened at one time which should be enough to catch all possible Longs or Shorts.
Requirements
Inputs
Confirmation 1: GKD-V Volatility / Volume indicator
Confirmation 2: GKD-C Confirmation indicator
Continuation: GKD-C Confirmation indicator
Solo Confirmation Simple: GKD-B Baseline
Solo Confirmation Complex: GKD-V Volatility / Volume indicator
Solo Confirmation Super Complex: GKD-V Volatility / Volume indicator
Stacked 1: None
Stacked 2+: GKD-C, GKD-V, or GKD-B Stacked 1
Outputs
Confirmation 1: GKD-C Confirmation 2 indicator
Confirmation 2: GKD-C Continuation indicator
Continuation: GKD-E Exit indicator
Solo Confirmation Simple: GKD-BT Backtest
Solo Confirmation Complex: GKD-BT Backtest or GKD-E Exit indicator
Solo Confirmation Super Complex: GKD-C Continuation indicator
Stacked 1: GKD-C, GKD-V, or GKD-B Stacked 2+
Stacked 2+: GKD-C, GKD-V, or GKD-B Stacked 2+ or GKD-BT Backtest
Additional features will be added in future releases.

My exponential moving averages - Suri's EMAs
It's not an indication of anything here, it's just part of my operating in a simple and summarized way, I hope it helps someone.
Suri's EMA's indicator is nothing more than a set of exponential moving averages (EMA). They are 12, 26, 50 and 200.
Attention to the use of the indicator, it is just an INDICATOR, it should not be taken as the main point of your entry, but to guide you in your entries in favor of the trend, whether intra-day or swing.
Created for clear, monochrome screens. Make your adjustments.
Color condition, candles turn green when their close is above EMA 12 and 26.
Color condition, candles turn red when their close is below EMA 12 and 26.
Condition for colors, MME12,26,50 and 200 will turn green with price working above it.
Condition for colors, MME12, 26, 50 and 200 will turn red with price working below it.
Indication for use in time-frames = 5m, 15m, 60m, 240m. (higher hit rates)
How to use the indicator, MME 12 and 26, are the most important and led you to more entries, but we should not only consider them, we have to analyze the whole context to then make a decision.
Indicator was nicknamed by me by "Pullback Pick", it works in a simple way:
In an uptrend or downtrend, the price usually tends to return in the averages or the averages go up to the price, that being said, it is easy to observe that where the price returns would be a pullback from the last movement, so when returning to the averages, the candle that shows strength in favor of this trend, in the EMA's region, becomes a possible entry, with its stop below or above this "pullback" formed, because the stop goes there, because usually when the price returns on the EMAs they tend to to hold and replay the price in favor of the trend.
My observations:
I like to enter when the price returns to the averages smoothly, without much movement, when it touches the average 12 or 26 it is an entry, but an entry without confirmation, the gain is greater, but the chance of being stopped is higher, I like it when the price is close to the 12 and 26 averages and leaves a small candle or doji on this pullback, my entry goes to the breakout of this candle and the stop behind the candle.
THERE IS NO MIRACLE, THERE IS NO 100% HIT RATE, SO USE STOP.
Aaaaaaaaaa I was forgetting.... and the target???
As it is a trend following setup, it is cool to leave a trailing stop or update the stop as new bottoms or tops are formed.
Targeting in 1v1 is good, setup pays a lot!
Targeting in 2x1 is too good, setup pays well!
Making a target in 3x1 is more than good, setup pays sometimes, then from now on, it depends on where you are entering this "PULLBACK", if it is in the first wave, in the second, if you are going to lateralize, the market is SOVEREIGN, put in the pocket that is no longer on the market, oh it's yours!
That's it, doubts, send it there, suggestion, opinion, whatever you want.
Added a symbol at the crossing of the 12 and 26 moving averages.
I am so sorry, but i dont speak english, use google translate.
Português.
Não se trata de indicação de nada aqui, é apenas parte do meu operacional de maneira simples e resumida, espero que ajude alguém.
Indicador Suri's EMA's, nada mais é do que um conjunto de médias móveis exponenciais(MME). São elas 12, 26, 50 e 200.
Atenção para o uso do indicador, ele é apenas um INDICADOR, não deve ser tomado como o ponto principal de sua entrada, mas sim de te balizar nas suas entradas a favor da tendência, seja ela intra-day ou swing.
Criado para telas claras e monocromáticas. Façam seus ajustes.
Condição para as cores, candles ficam verdes quando o fechamento dele é acima das MME 12 e 26.
Condição para as cores, candles ficam vermelhos quando o fechamento dele é abaixo das MME 12 e 26.
Condição para as cores, MME12,26,50 e 200 ficará verde com preço trabalhando acima dela.
Condição para as cores, MME12, 26, 50 e 200 ficará vermelho com preço trabalhando abaixo dela.
Indicação para uso nos time-frame = 5m, 15m, 60m, 240m.(taxas de acerto maior)
Como utilizar o indicador, MME 12 e 26, são as mais importantes e te levaram a mais entradas, porém não devemos levar apenas elas em consideração, temos que analisar todo o contexto para então tomar decisão.
Indicador foi apelidado por mim por " Pega Pullback", ele funciona de uma maneira simples:
Em tendência de alta ou de baixa, o preço geralmente tende a retornar nas médias ou as médias irem até o preço, dito isso é fácil de se observar que onde o preço retorna seria um pullback do último movimento, portanto ao retornar nas médias, o candle que mostra força a favor dessa tendência, na região das EMA's, se torna uma possível entrada, com o seu stop abaixo ou acima desse "pullback" formado, porque o stop vai nesse local, porque geralmente quando o preço retorna nas EMAs elas tendem a segurar e voltar a jogar o preço a favor da tendência.
Minhas observações:
Eu gosto de entrar quando o preço retorna nas médias de maneira suave, sem muito movimento, quando toca na média 12 ou 26 é uma entrada, porém uma entrada sem confirmação, o ganho é maior, porém a chance de ser stopado é mais alta, eu gosto quando o preço fica perto das médias 12 e 26 e deixa um candle pequeno ou doji nesse pullback, minha entrada vai no rompimento desse candle e o stop atrás do candle.
Não existe MILAGRE, NÃO EXISTE TAXA DE ACERTO DE 100%, POR ISSO USE STOP.
Aaaaaaaaaa ia me esquecendo.... e o alvo???
Por ser um setup seguidor de tendência, o legal é deixar um trailing stop ou ir atualizando o stop conforme novos fundos ou topos são formados.
Realizar alvo no 1x1 é bom, setup paga muito!
Realizar alvo no 2x1 é bom de mais, setup paga bem!
Realizar alvo no 3x1 é mais do que bom, setup paga as vezes, ai daqui pra frente, depende de onde você está entrando nesse "PULLBACK", se é na primeira onda, na segunda, se vai lateralizar, o mercado é SOBERANO, põe no bolso que não é mais do mercado, ai é teu!
É isso, dúvidas, manda ai, sugestão, opinião, o que quiser.
Adicionado um símbolo no cruzamento das médias móveis 12 e 26.

ProfitBee59 v5.0ProfitBee59 v5.0 for TradingView (pb5 ai) helps you do tedious works on your technical charts. It does CC59 counting and prints out positive or negative number on each price bar. When the counting arrives at -9 or +9, it creates respectable support and resistance ( SNR ) levels on the chart. It draws a pair of fast/slow average lines with pink/red colors for corresponding downtrend and yellow/green for uptrend. A yellow cross sign shows a crossing point between these fast/slow average line. It also draws a mega average line in gray to give a mega trend picture. Pb5 ai provides time/price analyseses. Up/Dn arrows are printed out at high probability buy/sell regions. In addition, other auxiliary tools such as Max/Min finder used to find the candlesticks with local max/min prices or Gap finder used to locate discontinuity between candlesticks.
For Forex trading, other intraday parameters are also available including the day opening level, high/low of yesterday and intraday brown background marking time interval for key trading hours in Asian-London-New York markets.
Smart phone/tablet and PC notifications of events occurring in the chart can be sent to you by server-side alerts so that you don't have to stay in front of the screen all the time.
=================================================================
The script ProfitBee59 v5.0 for TradingView (pb5 ai) is locked and protected. Contact the author for your access.
=================================================================
How to install the script:
------------------------------
*Go to the bottom of this page and click on "Add to Favorite Scripts".
*Remove older version of the script by clicking on the "X" button behind the indicator line at the top left corner of the chart window.
*Open a new chart at and click on the "Indicators" tab.
*Click on the "Favorites" tab and choose "ProfitBee59 v5.0".
*Right click anywhere on the graph, choose "Color Theme", the select "Dark".
*Right click anywhere on the graph, choose "Settings".
*In "Symbol" tab, set "Precision" to 1/100 for stock price or 1/100000 for Forex and set "Time Zone" to your local time.
*In "Scales" tab, check "Indicator Last Value Label".
*In "Events" tab, check "Show Dividends on Chart", "Show Splits on Chart" and "Show Earnings on Chart".
*At the bottom of settings window, click on "Template", "Save As...", then name this theme of graph setting for future call up such as "My chart setting".
*Click OK.
CryptoCaptain 15M ScalperAfter huge success in CryptoCaptain AI 4H Swing trade indicator ,
My group requested me to make a scalping indicator.
Here is the masterpiece.
No repaints guaranteed.
PS: Its not free.
Always trade with StopLoss.
CryptoCaptain 0_0
Works best on bitfinex 15m chart.
Leave a comment if you want to try. Temporary trial is legit.
Checkout my 4H swing indicator :

NeuralFlow Forecast Levels - User InputsThis is a companion indicator that plots AI-adaptive market equilibrium and expansion mapping levels directly on the SPY chart.
NeuralFlow Forecast Levels are generated through a Artificial Intelligence framework trained to identify:
Where price is statistically inclined to re-balance
Where expansion zones historically exhaust rather than extend
This is structure mapping, not prediction.
......................................................................................
What the Bands Represent?
AI Equilibrium (white core)
Primary weekly balance zone where price is most likely to mean-revert.
Predictive Rails (aqua / purple)
High-confidence corridor of institutional flow containment.
Outer Zones (green / red)
Expansion limits where continuation historically begins to decay.
Extreme Zones (top / bottom)
Rare deviation envelope where auction completion is statistically favored.
.The engine updates only when underlying structure changes —
not when candles fluctuate intraday.
.................................................................................................................
Usage Context
These levels are contextual reference zones, not entry signals. They are designed to answer:
Where does price matter?
Where does continuation weaken?
Where does balance statistically reassert itself?
Risk Disclaimer
Educational and analytical use only. Not financial advice.

NeuralFlow Forecast Levels | SPY WeeklyThis is a companion script that plots AI-adaptive market equilibrium & expansion mapping levels for SPY on chart.
NeuralFlow Forecast levels are generated though a Artificial Intelligence framework trained to identify where price is statistically inclined to re-balance and where expansion zones historically exhaust rather than extend.
What the Bands Represent
Band Layer Meaning
AI Equilibrium (white core) Primary weekly balance zone where price is most likely to mean-revert
Predictive Rails (aqua / purple) High-confidence corridor of institutional flow containment
Outer Zones (green / red) Expansion limits where continuation historically decays
Extreme Zones (top/bottom) Rare deviation envelope where auction completion is statistically favored
NeuralFlow operates Artificial Intelligence models trained specifically to map statistical re-balancing behavior, not trader predictions or sentiment. No discretionary drawing. No correlations. No lagging overlays.
This engine updates only when underlying structure changes — not when candles fluctuate intraday.
Risk:
Educational & analytical use only. Not financial advice

NeuralFlow Forecast Levels| NIFTY WeeklyThis is a companion script that plots AI-adaptive market equilibrium & expansion mapping levels on chart.
NeuralFlow Forecast levels are generated though a Artificial Intelligence framework trained to identify where price is statistically inclined to re-balance and where expansion zones historically exhaust rather than extend.
What the Bands Represent
Band Layer Meaning
AI Equilibrium (white core) Primary weekly balance zone where price is most likely to mean-revert
Predictive Rails (aqua / purple) High-confidence corridor of institutional flow containment
Outer Zones (green / red) Expansion limits where continuation historically decays
Extreme Zones (top/bottom) Rare deviation envelope where auction completion is statistically favored
NeuralFlow operates Artificial Intelligence models trained specifically to map statistical re-balancing behavior, not trader predictions or sentiment. No discretionary drawing. No correlations. No lagging overlays.
This engine updates only when underlying structure changes — not when candles fluctuate intraday.
Risk:
Educational & analytical use only. Not financial advice

AlphaGen ME V.15.12AlphaGen ME V.15.10 is an ATR-based trend-following strategy with dynamic trailing stops and EMA filter, designed for automated Crypto perpetual trading.
Core Logic:
• ATR Trailing Stops: Dynamically adjusts stop-loss using ATR(10) × 3.0 multiplier
• 200 EMA Trend Filter: Optional Only takes longs above EMA, shorts below EMA
• Reversal System: Flips positions when trend changes (filter-aware)
• MACD Acceleration Exit: Optional momentum-based profit taking
Position Sizing Modes:
• Simple % of Equity (default 90%) - Safe leverage control
• Risk % of Equity - Fixed risk per trade
• Fixed Contract Size - Consistent lot sizing
Webhook Integration:
Routes signals directly to AlphaGen-AI for execution on:
• Hyperliquid DEX
• AsterDEX
Requirements:
• AlphaGen-AI Pro subscription for webhook routing
• Hyperliquid or AsterDEX Wallets
• TradingView alerts configured with passphrase
Risk Disclosure: Trading involves substantial risk. Past performance does not guarantee future results. Only trade with capital you can afford to lose.

ALT Risk Metric StrategyHere's a professional write-up for your ALT Risk Strategy script:
ALT/BTC Risk Strategy - Multi-Crypto DCA with Bitcoin Correlation Analysis
Overview
This strategy uses Bitcoin correlation as a risk indicator to time entries and exits for altcoins. By analyzing how your chosen altcoin performs relative to Bitcoin, the strategy identifies optimal accumulation periods (when alt/BTC is oversold) and profit-taking opportunities (when alt/BTC is overbought). Perfect for traders who want to outperform Bitcoin by strategically timing altcoin positions.
Key Innovation: Why Alt/BTC Matters
Most traders focus solely on USD price, but Alt/BTC ratios reveal true altcoin strength:
When Alt/BTC is low → Altcoin is undervalued relative to Bitcoin (buy opportunity)
When Alt/BTC is high → Altcoin has outperformed Bitcoin (take profits)
This approach captures the rotation between BTC and alts that drives crypto cycles
Key Features
📊 Advanced Technical Analysis
RSI (60% weight): Primary momentum indicator on weekly timeframe
Long-term MA Deviation (35% weight): Measures distance from 150-period baseline
MACD (5% weight): Minor confirmation signal
EMA Smoothing: Filters noise while maintaining responsiveness
All calculations performed on Alt/BTC pairs for superior market timing
💰 3-Tier DCA System
Level 1 (Risk ≤ 70): Conservative entry, base allocation
Level 2 (Risk ≤ 50): Increased allocation, strong opportunity
Level 3 (Risk ≤ 30): Maximum allocation, extreme undervaluation
Continuous buying: Executes every bar while below threshold for true DCA behavior
Cumulative sizing: L3 triggers = L1 + L2 + L3 amounts combined
📈 Smart Profit Management
Sequential selling: Must complete L1 before L2, L2 before L3
Percentage-based exits: Sell portions of position, not fixed amounts
Auto-reset on re-entry: New buy signals reset sell progression
Prevents premature full exits during volatile conditions
🤖 3Commas Automation
Pre-configured JSON webhooks for Custom Signal Bots
Multi-exchange support: Binance, Coinbase, Kraken, Bitfinex, Bybit
Flexible quote currency: USD, USDT, or BUSD
Dynamic order sizing: Automatically adjusts to your tier thresholds
Full webhook documentation compliance
🎨 Multi-Asset Support
Pre-configured for popular altcoins:
ETH (Ethereum)
SOL (Solana)
ADA (Cardano)
LINK (Chainlink)
UNI (Uniswap)
XRP (Ripple)
DOGE
RENDER
Custom option for any other crypto
How It Works
Risk Metric Calculation (0-100 scale):
Fetches weekly Alt/BTC price data for stability
Calculates RSI, MACD, and deviation from 150-period MA
Normalizes MACD to 0-100 range using 500-bar lookback
Combines weighted components: (MACD × 0.05) + (RSI × 0.60) + (Deviation × 0.35)
Applies 5-period EMA smoothing for cleaner signals
Color-Coded Risk Zones:
Green (0-30): Extreme buying opportunity - Alt heavily oversold vs BTC
Lime/Yellow (30-70): Accumulation range - favorable risk/reward
Orange (70-85): Caution zone - consider taking initial profits
Red/Maroon (85-100+): Euphoria zone - aggressive profit-taking
Entry Logic:
Buys execute every candle when risk is below threshold
As risk decreases, position sizing automatically scales up
Example: If risk drops from 60→25, you'll be buying at L1 rate until it hits 50, then L2 rate, then L3 rate
Exit Logic:
Sells only trigger when in profit AND risk exceeds thresholds
Sequential execution ensures partial profit-taking
If new buy signal occurs before all sells complete, sell levels reset to L1
Configuration Guide
Choosing Your Altcoin:
Select crypto from dropdown (or use CUSTOM for unlisted coins)
Pick your exchange
Choose quote currency (USD, USDT, BUSD)
Risk Metric Tuning:
Long Term MA (default 150): Higher = more extreme signals, Lower = more frequent
RSI Length (default 10): Lower = more volatile, Higher = smoother
Smoothing (default 5): Increase for less noise, decrease for faster reaction
Buy Settings (Aggressive DCA Example):
L1 Threshold: 70 | Amount: $5
L2 Threshold: 50 | Amount: $6
L3 Threshold: 30 | Amount: $7
Total L3 buy = $18 per candle when deeply oversold
Sell Settings (Balanced Exit Example):
L1: 70 threshold, 25% position
L2: 85 threshold, 35% position
L3: 100 threshold, 40% position (final exit)
3Commas Setup
Bot Configuration:
Create Custom Signal Bot in 3Commas
Set trading pair to your altcoin/USD (e.g., ETH/USD, SOL/USDT)
Order size: Select "Send in webhook, quote" to use strategy's dollar amounts
Copy Bot UUID and Secret Token
Script Configuration:
Paste credentials into 3Commas section inputs
Check "Enable 3Commas Alerts"
Save and apply to chart
TradingView Alert:
Create Alert → Condition: "alert() function calls only"
Webhook URL: api.3commas.io
Enable "Webhook URL" checkbox
Expiration: Open-ended
Strategy Advantages
✅ Outperform Bitcoin: Designed specifically to beat BTC by timing alt rotations
✅ Capture Alt Seasons: Automatically accumulates when alts lag, sells when they pump
✅ Risk-Adjusted Sizing: Buys more when cheaper (better risk/reward)
✅ Emotional Discipline: Systematic approach removes fear and FOMO
✅ Multi-Asset: Run same strategy across multiple altcoins simultaneously
✅ Proven Indicators: Combines RSI, MACD, and MA deviation - battle-tested tools
Backtesting Insights
Optimal Timeframes:
Daily chart: Best for backtesting and signal generation
Weekly data is fetched internally regardless of display timeframe
Historical Performance Characteristics:
Accumulates heavily during bear markets and BTC dominance periods
Captures explosive altcoin rallies when BTC stagnates
Sequential selling preserves capital during extended downtrends
Works best on established altcoins with multi-year history
Risk Considerations:
Requires capital reserves for extended accumulation periods
Some altcoins may never recover if fundamentals deteriorate
Past correlation patterns may not predict future performance
Always size positions according to personal risk tolerance
Visual Interface
Indicator Panel Displays:
Dynamic color line: Green→Lime→Yellow→Orange→Red as risk increases
Horizontal threshold lines: Dashed lines mark your buy/sell levels
Entry/Exit labels: Green labels for buys, Orange/Red/Maroon for sells
Real-time risk value: Numerical display on price scale
Customization:
All threshold lines are adjustable via inputs
Color scheme clearly differentiates buy zones (green spectrum) from sell zones (red spectrum)
Line weights emphasize most extreme thresholds (L3 buy and L3 sell)
Strategy Philosophy
This strategy is built on the principle that altcoins move in cycles relative to Bitcoin. During Bitcoin rallies, alts often bleed against BTC (high sell, accumulate). When Bitcoin consolidates, alts pump (take profits). By measuring risk on the Alt/BTC chart instead of USD price, we time these rotations with precision.
The 3-tier system ensures you're always averaging in at better prices and scaling out at better prices, maximizing your Bitcoin-denominated returns.
Advanced Tips
Multi-Bot Strategy:
Run this on 5-10 different altcoins simultaneously to:
Diversify correlation risk
Capture whichever alt is pumping
Smooth equity curve through rotation
Pairing with BTC Strategy:
Use alongside the BTC DCA Risk Strategy for complete portfolio coverage:
BTC strategy for core holdings
ALT strategies for alpha generation
Rebalance between them based on BTC dominance
Threshold Calibration:
Check 2-3 years of historical data for your chosen alt
Note where risk metric sat during major bottoms (set buy thresholds)
Note where it peaked during euphoria (set sell thresholds)
Adjust for your risk tolerance and holding period
Credits
Strategy Development & 3Commas Integration: Claude AI (Anthropic)
Technical Analysis Framework: RSI, MACD, Moving Average theory
Implementation: pommesUNDwurst
Disclaimer
This strategy is for educational purposes only. Cryptocurrency trading involves substantial risk of loss. Altcoins are especially volatile and many fail completely. The strategy assumes liquid markets and reliable Alt/BTC price data. Always do your own research, understand the fundamentals of any asset you trade, and never risk more than you can afford to lose. Past performance does not guarantee future results. The authors are not financial advisors and assume no liability for trading decisions.
Additional Warning: Using leverage or trading illiquid altcoins amplifies risk significantly. This strategy is designed for spot trading of established cryptocurrencies with deep liquidity.
Tags: Altcoin, Alt/BTC, DCA, Risk Metric, Dollar Cost Averaging, 3Commas, ETH, SOL, Crypto Rotation, Bitcoin Correlation, Automated Trading, Alt Season
Feel free to modify any sections to better match your style or add specific backtesting results you've observed! 🚀Claude is AI and can make mistakes. Please double-check responses. Sonnet 4.5

Sessioni Orarie IT + Weekend + Alerts# 📋 DESCRIZIONE ITALIANO
---
# 🇮🇹 Sessioni Orarie Italiane + Weekend + Alert
## 📊 Descrizione
Questo indicatore è stato progettato specificamente per i trader italiani che necessitano di visualizzare orari chiave durante la sessione di trading, identificare i periodi di weekend e **ricevere notifiche automatiche** ai cambi di sessione.
Lo script traccia automaticamente **linee verticali infinite** ai seguenti orari italiani:
- **15:30** - Apertura mercato USA (New York)
- **18:30** - Fine sessione europea / Mid-session USA
Inoltre, evidenzia visualmente tutto il **periodo di weekend** (da Venerdì 20:00 a Domenica 23:00) con uno sfondo colorato personalizzabile.
**🔔 NOVITÀ: Sistema di Alert completo** per non perdere mai l'apertura/chiusura delle sessioni chiave!
---
## ✨ Caratteristiche Principali
### 🕐 Linee Orarie Automatiche
- **15:30 IT** - Linea verticale all'apertura di Wall Street
- **18:30 IT** - Linea verticale di fine sessione europea
- Linee **infinite** che si estendono sopra e sotto il grafico
- Stile completamente **personalizzabile** (colore, larghezza, tipo di linea)
- **Auto-aggiornamento** con gestione automatica ora legale/solare (CET/CEST)
### 🌙 Evidenziazione Weekend
- Sfondo colorato nel periodo: **Venerdì 20:00 → Domenica 23:00**
- Aiuta a identificare rapidamente quando i mercati Forex/Crypto sono meno liquidi
- Colore e trasparenza **completamente personalizzabili**
### 🔔 Sistema Alert Avanzato
- **Alert automatici** per ogni cambio di sessione
- **5 tipi di alert configurabili**:
- 🇺🇸 Apertura New York (15:30 IT)
- 🇪🇺 Fine Sessione Europea (18:30 IT)
- 🌙 Inizio Weekend (Venerdì 20:00 IT)
- ☀️ Fine Weekend (Domenica 23:00 IT)
- ⚠️ Qualsiasi evento (alert combinato)
- **Multi-canale**: Notifiche push, email, popup, webhook
- **Messaggi personalizzati** con emoji e informazioni dettagliate
- **Switch individuale** per ogni tipo di alert
### ⚙️ Caratteristiche Tecniche
- ✅ Funziona su **tutti i timeframe** (da 1 minuto a mensile)
- ✅ Compatibile con **tutti gli strumenti** (Forex, Crypto, Azioni, Indici, Commodities)
- ✅ Fuso orario **Europe/Rome** integrato
- ✅ Gestione automatica DST (Daylight Saving Time)
- ✅ Codice ottimizzato in **Pine Script v6**
- ✅ Label opzionali per identificare gli orari
- ✅ **Alert frequency**: once_per_bar (evita spam di notifiche)
---
## 🎨 Impostazioni Personalizzabili
### Stile Visivo
1. **Colore Linee Orarie** - Scegli il colore che preferisci
2. **Larghezza Linee** - Da 1 a 5 pixel
3. **Stile Linee** - Solid (continua), Dashed (tratteggiata), Dotted (puntinata)
4. **Colore Weekend** - Sfondo personalizzabile con trasparenza
### Alert Settings
1. **Abilita Alert** - Switch master per attivare/disattivare tutti gli alert
2. **Alert ore 15:30** - Notifica apertura New York
3. **Alert ore 18:30** - Notifica fine sessione europea
4. **Alert Inizio Weekend** - Notifica chiusura mercati (Ven 20:00)
5. **Alert Fine Weekend** - Notifica riapertura mercati (Dom 23:00)
---
## 📖 Come Utilizzarlo
### Installazione Base
1. Aggiungi l'indicatore al tuo grafico
2. Le linee appariranno automaticamente alle 15:30 e 18:30 (ora italiana)
3. Il weekend sarà evidenziato con uno sfondo colorato
4. Personalizza colori e stili dalle impostazioni (icona ingranaggio)
### Attivazione Alert
#### Metodo 1: Alert Automatici (Consigliato - Più Semplice)
1. Vai in **Impostazioni** dell'indicatore (icona ingranaggio)
2. Sezione **Alert Settings**
3. Spunta gli alert che vuoi ricevere
4. Gli alert si attivano automaticamente!
#### Metodo 2: Alert Personalizzati (Avanzato)
1. Clicca sul pulsante **⏰ Alert** in alto a destra
2. Seleziona **Condizione** → Nome dell'indicatore
3. Scegli il tipo di alert:
- Apertura NY (15:30)
- Fine EU (18:30)
- Inizio Weekend
- Fine Weekend
- Qualsiasi Sessione
4. Configura le **opzioni di notifica**:
- 📱 Notifica App
- 📧 Email
- 🔊 Popup sonoro
- 🔗 Webhook URL
5. Clicca **Crea**
---
## 🔔 Messaggi Alert
Gli alert includono emoji e informazioni chiare:
**🇺🇸 15:30 IT - APERTURA NEW YORK**
```
Inizio sessione americana
Strumento:
```
**🇪🇺 18:30 IT - FINE SESSIONE EUROPEA**
```
Mid-session USA
Strumento:
```
**🌙 VENERDÌ 20:00 - INIZIO WEEKEND**
```
Mercati in chiusura
Riduzione liquidità prevista
```
**☀️ DOMENICA 23:00 - FINE WEEKEND**
```
Riapertura mercati imminente
Preparati per la nuova settimana
```
---
## 🎯 Ideale Per
- 📈 **Day Traders** che operano sulle sessioni USA/EU
- 🌍 **Forex Traders** che vogliono evidenziare il weekend
- 💹 **Scalpers** che necessitano di riferimenti orari precisi
- ⏰ **Swing Traders** che vogliono evitare gap del weekend
- 🇮🇹 **Trader Italiani** che usano il fuso orario locale
- 📱 **Mobile Traders** che vogliono notifiche push
---
## 💡 Perché Usare Questo Indicatore?
- **Risparmia tempo**: Non devi più calcolare manualmente gli orari con fusi diversi
- **Non perdere sessioni**: Alert automatici ti avvisano sempre
- **Chiarezza visiva**: Identifica immediatamente le sessioni chiave
- **Versatile**: Funziona su qualsiasi mercato e timeframe
- **Preciso**: Aggiornamento automatico con ora legale/solare
- **Multi-dispositivo**: Ricevi notifiche su mobile, desktop, email
---
## 📝 Note Importanti
- Le linee orarie vengono disegnate solo quando la candela corrisponde esattamente all'orario target
- L'evidenziazione weekend copre il periodo da Ven 20:00 a Dom 23:00 (ora italiana)
- Gli alert usano `alert.freq_once_per_bar` per evitare spam di notifiche
- Lo script è ottimizzato per non appesantire il grafico
- Gli alert funzionano anche quando il grafico non è aperto (se configurati correttamente)
---
## 🚀 Casi d'Uso
### Scenario 1: Day Trader Forex
- Attiva alert 15:30 per entrare sulle notizie USA
- Attiva alert 18:30 per chiudere posizioni EU
- Visualizza linee per identificare breakout agli orari chiave
### Scenario 2: Swing Trader
- Attiva alert weekend per chiudere posizioni prima del venerdì sera
- Evidenziazione weekend per evitare gap di apertura
- Alert domenica sera per preparare setup settimanali
### Scenario 3: Scalper Intraday
- Linee orarie come riferimento per volatilità
- Alert 15:30 per sfruttare l'aumento di volume NY
- Personalizza colori per non disturbare l'analisi tecnica
---
## 🔄 Aggiornamenti Futuri
Roadmap pianificata:
- Aggiunta sessione asiatica (Tokyo)
- Sessione londinese personalizzabile
- Statistiche volatilità per sessione
- Alert personalizzabili con messaggi custom
- Integrazione con Discord/Telegram
**Lascia un commento con le tue richieste!**
---
## ⭐ Ti è Piaciuto?
Se trovi utile questo indicatore:
- Lascia una ⭐ **stella**
- 💬 **Commenta** con feedback o richieste
- 🔄 **Condividilo** con altri trader
- 👤 **Seguimi** per altri script utili!
---
## 🏷️ Tags
`sessioni` `orari` `italia` `weekend` `alert` `notifiche` `fuso-orario` `CET` `CEST` `new-york` `forex` `day-trading` `scalping` `swing-trading` `utilità` `automazione`
---
**Versione**: 2.0 (Alert Update)
**Lingua**: Italiano / English
**Licenza**: Mozilla Public License 2.0
**Autore**:
---
**Buon Trading! 📊🇮🇹**
---
---
# 📋 ENGLISH DESCRIPTION
---
# 🌍 Italian Time Sessions + Weekend + Alerts
## 📊 Description
This indicator is specifically designed for traders who need to visualize key Italian time zones during trading sessions, identify weekend periods, and **receive automatic notifications** at session changes.
The script automatically draws **infinite vertical lines** at the following Italian times:
- **15:30 IT** - US Market Open (New York)
- **18:30 IT** - European Session Close / Mid US Session
Additionally, it visually highlights the entire **weekend period** (from Friday 20:00 to Sunday 23:00) with a customizable colored background.
**🔔 NEW: Complete Alert System** to never miss key session openings/closings!
---
## ✨ Main Features
### 🕐 Automatic Time Lines
- **15:30 IT** - Vertical line at Wall Street opening
- **18:30 IT** - Vertical line at European session close
- **Infinite lines** extending above and below the chart
- Fully **customizable** style (color, width, line type)
- **Auto-update** with automatic DST management (CET/CEST)
### 🌙 Weekend Highlighting
- Colored background during: **Friday 20:00 → Sunday 23:00**
- Helps quickly identify when Forex/Crypto markets are less liquid
- Color and transparency **fully customizable**
### 🔔 Advanced Alert System
- **Automatic alerts** for every session change
- **5 configurable alert types**:
- 🇺🇸 New York Open (15:30 IT)
- 🇪🇺 European Session Close (18:30 IT)
- 🌙 Weekend Start (Friday 20:00 IT)
- ☀️ Weekend End (Sunday 23:00 IT)
- ⚠️ Any Event (combined alert)
- **Multi-channel**: Push notifications, email, popup, webhook
- **Custom messages** with emojis and detailed information
- **Individual switch** for each alert type
### ⚙️ Technical Features
- ✅ Works on **all timeframes** (from 1 minute to monthly)
- ✅ Compatible with **all instruments** (Forex, Crypto, Stocks, Indices, Commodities)
- ✅ Integrated **Europe/Rome** timezone
- ✅ Automatic DST (Daylight Saving Time) management
- ✅ Optimized code in **Pine Script v6**
- ✅ Optional labels to identify times
- ✅ **Alert frequency**: once_per_bar (avoids notification spam)
---
## 🎨 Customizable Settings
### Visual Style
1. **Time Lines Color** - Choose your preferred color
2. **Lines Width** - From 1 to 5 pixels
3. **Lines Style** - Solid, Dashed, Dotted
4. **Weekend Color** - Customizable background with transparency
### Alert Settings
1. **Enable Alerts** - Master switch to activate/deactivate all alerts
2. **Alert 15:30** - New York opening notification
3. **Alert 18:30** - European session close notification
4. **Weekend Start Alert** - Market close notification (Fri 20:00)
5. **Weekend End Alert** - Market reopen notification (Sun 23:00)
---
## 📖 How to Use
### Basic Installation
1. Add the indicator to your chart
2. Lines will automatically appear at 15:30 and 18:30 (Italian time)
3. Weekend will be highlighted with a colored background
4. Customize colors and styles from settings (gear icon)
### Alert Activation
#### Method 1: Automatic Alerts (Recommended - Easiest)
1. Go to indicator **Settings** (gear icon)
2. **Alert Settings** section
3. Check the alerts you want to receive
4. Alerts activate automatically!
#### Method 2: Custom Alerts (Advanced)
1. Click **⏰ Alert** button (top right)
2. Select **Condition** → Indicator name
3. Choose alert type:
- NY Open (15:30)
- EU Close (18:30)
- Weekend Start
- Weekend End
- Any Session
4. Configure **notification options**:
- 📱 App Notification
- 📧 Email
- 🔊 Sound Popup
- 🔗 Webhook URL
5. Click **Create**
---
## 🔔 Alert Messages
Alerts include emojis and clear information:
**🇺🇸 15:30 IT - NEW YORK OPEN**
```
US session start
Instrument:
```
**🇪🇺 18:30 IT - EUROPEAN SESSION CLOSE**
```
Mid US session
Instrument:
```
**🌙 FRIDAY 20:00 - WEEKEND START**
```
Markets closing
Reduced liquidity expected
```
**☀️ SUNDAY 23:00 - WEEKEND END**
```
Markets reopening soon
Get ready for the new week
```
---
## 🎯 Ideal For
- 📈 **Day Traders** operating on US/EU sessions
- 🌍 **Forex Traders** who want to highlight weekends
- 💹 **Scalpers** who need precise time references
- ⏰ **Swing Traders** who want to avoid weekend gaps
- 🇮🇹 **European Traders** using Italian timezone
- 📱 **Mobile Traders** who want push notifications
---
## 💡 Why Use This Indicator?
- **Save time**: No more manual timezone calculations
- **Never miss sessions**: Automatic alerts always notify you
- **Visual clarity**: Immediately identify key sessions
- **Versatile**: Works on any market and timeframe
- **Accurate**: Automatic update with DST
- **Multi-device**: Receive notifications on mobile, desktop, email
---
## 📝 Important Notes
- Time lines are drawn only when the candle matches exactly the target time
- Weekend highlighting covers the period from Fri 20:00 to Sun 23:00 (Italian time)
- Alerts use `alert.freq_once_per_bar` to avoid notification spam
- Script is optimized to not overload the chart
- Alerts work even when the chart is not open (if configured correctly)
---
## 🚀 Use Cases
### Scenario 1: Forex Day Trader
- Activate 15:30 alert to enter on US news
- Activate 18:30 alert to close EU positions
- Visualize lines to identify breakouts at key times
### Scenario 2: Swing Trader
- Activate weekend alerts to close positions before Friday evening
- Weekend highlighting to avoid opening gaps
- Sunday evening alert to prepare weekly setups
### Scenario 3: Intraday Scalper
- Time lines as reference for volatility
- 15:30 alert to exploit NY volume increase
- Customize colors to not disturb technical analysis
---
## 🔄 Future Updates
Planned roadmap:
- Asian session addition (Tokyo)
- Customizable London session
- Volatility statistics per session
- Customizable alerts with custom messages
- Discord/Telegram integration
**Leave a comment with your requests!**
---
## ⭐ Did You Like It?
If you find this indicator useful:
- Leave a ⭐ **star**
- 💬 **Comment** with feedback or requests
- 🔄 **Share** with other traders
- 👤 **Follow me** for more useful scripts!
---
## 🏷️ Tags
`sessions` `times` `italy` `weekend` `alerts` `notifications` `timezone` `CET` `CEST` `new-york` `forex` `day-trading` `scalping` `swing-trading` `utility` `automation`
---
**Version**: 2.0 (Alert Update)
**Language**: Italian / English
**License**: Mozilla Public License 2.0
**Author**:
---
**Happy Trading! 📊🌍**

RiskCraft - Advanced Risk Management SystemRiskCraft – Risk Intelligence Dashboard
Trade like you actually respect risk
"I know the setup looks good… but how much am I actually risking right now?"
RiskCraft is an open-source Pine Script v6 indicator that keeps risk transparent directly on the chart. It is not a signal generator; it is a risk desk that calculates size, frames volatility, and reminds you when your behaviour drifts away from the plan.
Core utilities
Calculates professional-style position sizing in real time.
Reads volatility and market regime before position size is confirmed.
Adjusts risk based on the trader’s emotional state and confidence inputs.
Maps session risk across Asian, London, and New York hours.
Draws exactly one stop line and one target line in the preferred direction.
Provides rotating education tips plus contextual warnings when risk escalates.
It is intentionally conservative and keeps you in the game long enough for any separate entry logic to matter.
---
Chart layout checklist
Use a clean chart on a liquid symbol (e.g., AMEX:SPY or major FX pairs).
Main RiskCraft dashboard placed on the right edge.
Session Risk box on the left with UTC time visible.
Floating risk badge above price.
Stop/target guide lines enabled.
Education panel visible in the bottom-right corner.
---
1. On-chart components
Right-side dashboard : account risk %, position size/value, stop, target, risk/reward, regime, trend strength, emotional state, behavioural score, correlation, and preferred trade direction.
Session Risk box : highlights active session (Asian, London, NY), current UTC time, and risk label (High/Med/Low) per session.
Floating risk badge : keeps actual account risk percent visible with colour-coded wording from Ultra Cautious to Very Aggressive.
Stop/target lines : exactly one dashed stop and one dashed target aligned with the preferred bias.
Education panel : rotates core principles and AI-style warnings tied to volatility, risk %, and behaviour flags.
---
2. Volatility engine – ATR with context 📈
atr = ta.atr(atrLength)
atrPercent = (atr / close) * 100
atrSMA = ta.sma(atr, atrLength)
volatilityRatio = atr / atrSMA
isHighVol = volatilityRatio > volThreshold
ATR vs ATR SMA shows how wild price is relative to recent history.
Volatility ratio above the threshold flips isHighVol , which immediately trims risk.
An ATR percentile rank over the last 100 bars indicates calm versus chaotic regimes.
Daily ATR sampling via request.security() gives higher time-frame context for intraday sessions.
When volatility spikes the script dials position size down automatically instead of cheering for maximum exposure.
---
3. Market regime radar – Danger or Drift 🌊
ema20 = ta.ema(close, 20)
ema50 = ta.ema(close, 50)
ema200 = ta.ema(close, 200)
trendScore = (close > ema20 ? 1 : -1) +
(ema20 > ema50 ? 1 : -1) +
(ema50 > ema200 ? 1 : -1)
= ta.dmi(14, 14)
Regimes covered:
Danger : high volatility with weak trend.
Volatile : volatility elevated but structure still directional.
Choppy : low ADX and noisy action.
Trending : directional flows without extreme volatility.
Mixed : anything between.
Each regime maps to a 1–10 risk score and a multiplier that feeds the final position size. Danger and Choppy clamp size; Trending restores normal risk.
---
4. Behaviour engine – trader inputs matter 🧠
You provide:
Emotional state : Confident, Neutral, FOMO, Revenge, Fearful.
Confidence : slider from 1 to 10.
Toggle for behavioural adjustment on/off.
Behind the scenes:
Each state triggers an emotional multiplier .
Confidence produces a confidence multiplier .
Combined they form behavioralFactor and a 0–100 Behavioural Score .
High-risk emotions or low conviction clamp the final risk. Calm inputs allow normal size. The dashboard prints both fields to keep accountability on-screen.
---
5. Correlation guardrail – avoid stacking identical risk 📊
Optional correlation mode compares the active symbol to a reference (default AMEX:SPY ):
corrClose = request.security(correlationSymbol, timeframe.period, close)
priceReturn = ta.change(close) / close
corrReturn = ta.change(corrClose) / corrClose
correlation = calcCorrelation()
Absolute correlation above the threshold applies a correlation multiplier (< 1) to reduce size.
Dashboard row shows the live correlation and reference ticker.
When disabled, the row simply echoes the current symbol, keeping the table readable.
---
6. Position sizing engine – heart of the script 💰
baseRiskAmount = accountSize * (baseRiskPercent / 100)
adjustedRisk = baseRiskAmount * behavioralFactor *
regimeAdjustment * volAdjustment *
correlationAdjustment
finalRiskAmount = math.min(adjustedRisk,
accountSize * (maxRiskCap / 100))
stopDistance = atr * atrStopMultiplier
takeProfit = atr * atrTargetMultiplier
positionSize = stopDistance > 0 ? finalRiskAmount / stopDistance : 0
positionValue = positionSize * close
Outputs shown on the dashboard:
Position size in units and value in currency.
Actual risk % back on account after adjustments.
Risk/Reward derived from ATR-based stop and target.
---
7. Intelligent trade direction – bias without signals 🎯
Direction score ingredients:
EMA stack alignment.
Price versus EMA20.
RSI momentum relative to 50.
MACD line vs signal.
Directional Movement (DI+/DI–).
The resulting Trade Direction row prints LONG, SHORT, or NEUTRAL. No orders are generated—this is guidance so you only risk capital when the structure supports it.
---
8. Stop/target guide lines – two lines only ✂️
if showStopLines
if preferLong
// long stop below, target above
else if preferShort
// short stop above, target below
Lines refresh each bar to keep clutter low.
When the direction score is neutral, no lines appear.
Use them as visual anchors, not auto-orders.
---
9. Session Risk map – global volatility clock 🌍
Tracks Asian, London, and New York windows via UTC.
Computes average ATR per session versus global ATR SMA.
Labels each session High/Med/Low and colours the cells accordingly.
Top row shows the active session plus current UTC time so you always know the regime you are trading.
One glance tells you whether you are trading quiet drift or the part of the day that hunts stops.
---
10. Floating risk badge – honesty above price 🪪
Text ranges from Ultra Cautious through Very Aggressive.
Colour matches the risk palette inputs (High/Med/Low).
Updates on the last bar only, keeping historical clutter off the chart.
Account risk becomes impossible to ignore while you stare at price.
---
11. Education engine & warnings 📚
Rotates evergreen principles (risk 1–2%, journal trades, respect plan).
Triggers contextual warnings when volatility and risk % conflict.
Flags when emotional state = FOMO or Revenge.
Highlights sub-standard risk/reward setups.
When multiple danger flags stack, an AI-style warning overrides the tip text so you can course-correct before capital is exposed.
---
12. Alerts – hard guard rails 🚨
Excessive Risk Alert : actual risk % crosses custom threshold.
High Volatility Alert : ATR behaviour signals danger regime.
Emotional State Warning : FOMO or Revenge selected.
Poor Risk/Reward Alert : risk/reward drops below your standard.
All alerts reinforce discipline; none suggest entries or exits.
---
13. Multi-market behaviour 🕒
Intraday (1m–1h): session box and badge react quickly; ideal for scalpers needing constant risk context.
Higher time frames (1D–1W): dashboard shifts slowly, supporting swing planning.
Asset classes confirmed in validation: crypto majors, large-cap equities, indices, major FX pairs, and liquid commodities.
Risk logic is price-based, so it adapts across markets without bespoke tuning.
15. Key inputs & recommended defaults
Account Size : 10,000 (modify to match actual account; min 100).
Base Risk % : 1.0 with a Maximum Risk Cap of 2.5%.
ATR Period : 14, Stop Multiplier 2.0, Target Multiplier 3.0.
High Vol Threshold : 1.5 for ATR ratio.
Behavioural Adjustment : enabled by default; disable for fixed risk.
Correlation Check : optional; default symbol AMEX:SPY , threshold 0.7.
Display toggles : main dashboard, risk badge, session map, education panel, and stop lines can be individually disabled to reduce clutter.
16. Usage notes & limits
Indicator mode only; no automated entries or exits.
Trade history panel intentionally disabled (requires strategy context).
Correlation analysis depends on additional data requests and may lag slightly on illiquid symbols.
Session timing uses UTC; adjust expectations if you trade localized instruments.
HTF ATR sampling uses daily data, so bar replay on lower charts may show brief data gaps while HTF loads.
What does everyone think RISK really means?

BTC Price Prediction Model [Global PMI]V2🇺🇸 English Guide
1. Introduction
This indicator was created by GW Capital using Gemini Vibe Coding technology. It leverages advanced AI coding capabilities to reconstruct complex macroeconomic models into actionable trading tools.
2. Credits
Special thanks to the original model author, Marty Kendall. His research into the correlation between Bitcoin's price and macroeconomic factors lays the foundation for this algorithm.
3. Model Principles & Formula
This model calculates the "Fair Value" of Bitcoin based on four key macroeconomic pillars. It assumes that Bitcoin's price is a function of Global Liquidity, Network Security, Risk Appetite, and the Economic Cycle.
💡 Unique Insight: PMI & The 4-Year Cycle
A key distinguishing feature of this model is the hypothesis that Bitcoin's famous "4-Year Halving Cycle" may be intrinsically linked to the Global Business Cycle (PMI), rather than just supply shocks.
Therefore, the model incorporates PMI as a valuation "Amplifier".
Note: Due to TradingView data limitations, US PMI is currently used as the proxy for the global cycle.
The Formula
$$\ln(BTC) = \alpha + (1 + \beta \cdot PMI_{z}) \times $$
Global Liquidity (M2): Sum of M2 supply from US, China, Eurozone, and Japan (converted to USD). Represents the pool of fiat money available to flow into assets.
Network Security (Hashrate): Bitcoin's hashrate, representing the physical security and utility of the network.
Risk Appetite (S&P 500): Used as a proxy for global risk sentiment.
Economic Cycle (PMI Z-Score): US Manufacturing PMI is used to amplify or dampen the valuation based on where we are in the business cycle (Expansion vs. Contraction).
4. How to Use
The indicator plots the Fair Value (White Line) and four sentiment bands based on statistical deviation (Z-Score).
Sentiment Zones
🚨 Extreme Greed (Red Zone): Price > +0.3 StdDev. Historically indicates a market top or overheated sentiment.
⚠️ Greed (Orange Zone): Price > +0.15 StdDev. Bullish momentum is strong but caution is advised.
⚖️ Fair Value (White Line): The theoretical "correct" price based on macro data.
😨 Fear (Teal Zone): Price < -0.15 StdDev. Undervalued territory.
💎 Extreme Fear (Green Zone): Price < -0.3 StdDev. Historically a generational buying opportunity.
Sentiment Score (0-100)
100: Maximum Greed (Top)
50: Fair Value
0: Maximum Fear (Bottom)
5. Usage Recommendations
Timeframe: Daily (1D) or Weekly (1W) ONLY.
Reason: The underlying data sources (M2, PMI) are updated monthly. The S&P 500 and Hashrate are daily. Using this indicator on intraday charts (e.g., 15m, 1h, 4h) adds no value because the fundamental data does not change that fast.
Long-Term View: This is a macro-cycle indicator designed for identifying cycle tops and bottoms over months and years, not for day trading.
6. Disclaimer
This indicator is for educational and informational purposes only. It does not constitute financial advice. The model relies on historical correlations which may not hold true in the future. All trading involves risk. GW Capital and the creators assume no responsibility for any trading losses.
7. Support Us ❤️
If you find this indicator useful, please Boost 👍, Comment, and add it to your Favorites! Your support keeps us going.
🇨🇳 中文说明 (Chinese Version)
1. 简介
本指标由 GW Capital 使用 Gemini Vibe Coding 技术制作。利用先进的 AI 编程能力,将复杂的宏观经济模型重构为可执行的交易工具。
2. 致谢
特别感谢模型原作者 Marty Kendall。他对这一算法的研究奠定了基础,揭示了比特币价格与宏观经济因素之间的深层联系。
3. 模型原理与公式
该模型基于四大宏观经济支柱计算比特币的“公允价值”。它假设比特币的价格是全球流动性、网络安全性、风险偏好和经济周期的函数。
💡 独家洞察:PMI 与 4年周期
本模型的一个核心独特之处在于:我们认为比特币著名的“4年减半周期”背后的真正驱动力,可能与全球商业周期 (PMI) 高度同步,而不仅仅是供应减半。
因此,模型特别引入 PMI 作为估值的“放大器” (Amplifier)。
注:由于 TradingView 数据源限制,目前采用历史数据最详尽的美国 PMI 作为全球周期的代理指标。
模型公式
$$\ln(BTC) = \alpha + (1 + \beta \cdot PMI_{z}) \times $$
全球流动性 (M2): 美、中、欧、日四大经济体的 M2 总量(折算为美元)。代表可流入资产的法币资金池。
网络安全性 (Hashrate): 比特币全网算力,代表网络的物理安全性和实用价值。
风险偏好 (S&P 500): 作为全球风险情绪的代理指标。
经济周期 (PMI Z-Score): 美国制造业 PMI 用于根据商业周期(扩张 vs 收缩)来放大或抑制估值。
4. 指标用法
指标会在图表上绘制 公允价值 (白线) 以及基于统计偏差 (Z-Score) 的四条情绪带。
情绪区间
🚨 极度贪婪 (红色区域): 价格 > +0.3 标准差。历史上通常预示市场顶部或情绪过热。
⚠️ 一般贪婪 (橙色区域): 价格 > +0.15 标准差。多头动能强劲,但需谨慎。
⚖️ 公允价值 (白线): 基于宏观数据的理论“正确”价格。
😨 一般恐惧 (青色区域): 价格 < -0.15 标准差。进入低估区域。
💎 极度恐惧 (绿色区域): 价格 < -0.3 标准差。历史上通常是代际级别的买入机会。
情绪评分 (0-100)
100: 极度贪婪 (顶部)
50: 公允价值
0: 极度恐惧 (底部)
5. 使用建议
周期: 仅限日线 (1D) 或周线 (1W)。
原因: 底层数据源(M2, PMI)是月度更新的。标普500和算力是日度更新的。在日内图表(如15分钟、1小时、4小时)上使用此指标没有任何意义,因为基本面数据不会变化得那么快。
长期视角: 这是一个宏观周期指标,旨在识别数月甚至数年的周期顶部和底部,而非用于日内交易。
6. 免责声明
本指标仅供教育和参考使用,不构成任何财务建议。该模型依赖于历史相关性,未来可能不再适用。所有交易均涉及风险。GW Capital 及制作者不对任何交易损失承担责任。

BTC Price Prediction Model [Global PMI]🇨🇳 中文说明 (Chinese Version)
1. 简介
本指标由 GW Capital 使用 Gemini Vibe Coding 技术制作。利用先进的 AI 编程能力,将复杂的宏观经济模型重构为可执行的交易工具。
2. 致谢
特别感谢模型原作者 Marty Kendall。他对这一算法的研究奠定了基础,揭示了比特币价格与宏观经济因素之间的深层联系。
3. 模型原理与公式
该模型基于四大宏观经济支柱计算比特币的“公允价值”。它假设比特币的价格是全球流动性、网络安全性、风险偏好和经济周期的函数。
模型公式
$$\ln(BTC) = \alpha + (1 + \beta \cdot PMI_{z}) \times $$
全球流动性 (M2): 美、中、欧、日四大经济体的 M2 总量(折算为美元)。代表可流入资产的法币资金池。
网络安全性 (Hashrate): 比特币全网算力,代表网络的物理安全性和实用价值。
风险偏好 (S&P 500): 作为全球风险情绪的代理指标。
经济周期 (PMI Z-Score): 美国制造业 PMI 用于根据商业周期(扩张 vs 收缩)来放大或抑制估值。
4. 指标用法
指标会在图表上绘制 公允价值 (白线) 以及基于统计偏差 (Z-Score) 的四条情绪带。
情绪区间
🚨 极度贪婪 (红色区域): 价格 > +0.3 标准差。历史上通常预示市场顶部或情绪过热。
⚠️ 一般贪婪 (橙色区域): 价格 > +0.15 标准差。多头动能强劲,但需谨慎。
⚖️ 公允价值 (白线): 基于宏观数据的理论“正确”价格。
😨 一般恐惧 (青色区域): 价格 < -0.15 标准差。进入低估区域。
💎 极度恐惧 (绿色区域): 价格 < -0.3 标准差。历史上通常是代际级别的买入机会。
情绪评分 (0-100)
100: 极度贪婪 (顶部)
50: 公允价值
0: 极度恐惧 (底部)
5. 使用建议
周期: 仅限日线 (1D) 或周线 (1W)。
原因: 底层数据源(M2, PMI)是月度更新的。标普500和算力是日度更新的。在日内图表(如15分钟、1小时、4小时)上使用此指标没有任何意义,因为基本面数据不会变化得那么快。
长期视角: 这是一个宏观周期指标,旨在识别数月甚至数年的周期顶部和底部,而非用于日内交易。
6. 免责声明
本指标仅供教育和参考使用,不构成任何财务建议。该模型依赖于历史相关性,未来可能不再适用。所有交易均涉及风险。GW Capital 及制作者不对任何交易损失承担责任。
🇺🇸 English Guide (英文说明)
1. Introduction
This indicator was created by GW Capital using Gemini Vibe Coding technology. It leverages advanced AI coding capabilities to reconstruct complex macroeconomic models into actionable trading tools.
2. Credits
Special thanks to the original model author, Marty Kendall. His research into the correlation between Bitcoin's price and macroeconomic factors lays the foundation for this algorithm.
3. Model Principles & Formula
This model calculates the "Fair Value" of Bitcoin based on four key macroeconomic pillars. It assumes that Bitcoin's price is a function of Global Liquidity, Network Security, Risk Appetite, and the Economic Cycle.
The Formula
$$\ln(BTC) = \alpha + (1 + \beta \cdot PMI_{z}) \times $$
Global Liquidity (M2): Sum of M2 supply from US, China, Eurozone, and Japan (converted to USD). Represents the pool of fiat money available to flow into assets.
Network Security (Hashrate): Bitcoin's hashrate, representing the physical security and utility of the network.
Risk Appetite (S&P 500): Used as a proxy for global risk sentiment.
Economic Cycle (PMI Z-Score): US Manufacturing PMI is used to amplify or dampen the valuation based on where we are in the business cycle (Expansion vs. Contraction).
4. How to Use
The indicator plots the Fair Value (White Line) and four sentiment bands based on statistical deviation (Z-Score).
Sentiment Zones
🚨 Extreme Greed (Red Zone): Price > +0.3 StdDev. Historically indicates a market top or overheated sentiment.
⚠️ Greed (Orange Zone): Price > +0.15 StdDev. Bullish momentum is strong but caution is advised.
⚖️ Fair Value (White Line): The theoretical "correct" price based on macro data.
😨 Fear (Teal Zone): Price < -0.15 StdDev. Undervalued territory.
💎 Extreme Fear (Green Zone): Price < -0.3 StdDev. Historically a generational buying opportunity.
Sentiment Score (0-100)
100: Maximum Greed (Top)
50: Fair Value
0: Maximum Fear (Bottom)
5. Usage Recommendations
Timeframe: Daily (1D) or Weekly (1W) ONLY.
Reason: The underlying data sources (M2, PMI) are updated monthly. The S&P 500 and Hashrate are daily. Using this indicator on intraday charts (e.g., 15m, 1h, 4h) adds no value because the fundamental data does not change that fast.
Long-Term View: This is a macro-cycle indicator designed for identifying cycle tops and bottoms over months and years, not for day trading.
6. Disclaimer
This indicator is for educational and informational purposes only. It does not constitute financial advice. The model relies on historical correlations which may not hold true in the future. All trading involves risk. GW Capital and the creators assume no responsibility for any trading losses.

Volume Intelligence Pro [Abusuhil]═══════════════════════════════════════════════════════════════════════════════
📊 VOLUME INTELLIGENCE TABLE - PROFESSIONAL VOLUME ANALYSIS INDICATOR
═══════════════════════════════════════════════════════════════════════════════
🌐 BILINGUAL SUPPORT: Full support for English and Arabic languages - switch instantly from settings!
🎯 COMPREHENSIVE VOLUME ANALYSIS DASHBOARD
This advanced indicator provides institutional-grade volume analysis through an elegant, customizable table that displays critical volume metrics in real-time. Designed for professional traders who need deep insights into market volume dynamics, order flow, and smart money movements.
═══════════════════════════════════════════════════════════════════════════════
✨ KEY FEATURES
═══════════════════════════════════════════════════════════════════════════════
🔷 BILINGUAL INTERFACE
• Seamless switching between English and Arabic
• All metrics, labels, and signals fully translated
• Perfect for international traders
🔷 VOLUME FUNDAMENTALS
• Current Volume: Real-time volume tracking
• Volume SMA: Moving average for volume comparison
• Volume Ratio: Current volume vs average (identifies abnormal activity)
• Volume % Change: Percentage change from previous bar
• Volume Delta: Difference between buying and selling pressure
🔷 VOLUME SPIKE DETECTION (4 LEVELS)
• Weak Spike: 1.5x average volume
• Medium Spike: 2.0x average volume
• Strong Spike: 2.5x average volume
• Extreme Spike: 3.0x+ average volume
• Visual alerts with color-coded indicators
🔷 ADVANCED BUY/SELL PRESSURE ANALYSIS
• Buy Volume: Bullish candle volume accumulation
• Sell Volume: Bearish candle volume accumulation
• Buy Pressure %: Percentage of buying pressure
• Sell Pressure %: Percentage of selling pressure
• Pressure Dominance: Who controls the market (Buyers/Sellers/Neutral)
• Candle Body Strength: Measures conviction in price movement
• Imbalance Volume: Detects wick imbalances
• Volume Delta (HLC3): Advanced delta calculation
• Weighted Delta: Volume-weighted price movement
• Pressure Lookback: Multi-candle pressure analysis (optimized for performance)
🔷 TECHNICAL INDICATORS INTEGRATION
• VWMA (Volume Weighted Moving Average): Price vs VWMA positioning
• OBV (On Balance Volume): Trend detection with EMA smoothing
• OBV Divergence: Bullish/Bearish divergence detection
• MFI (Money Flow Index): Overbought/oversold conditions
• A/D Line (Accumulation/Distribution): Smart money tracking
🔷 AI-POWERED VOLUME INTELLIGENCE SCORING
• Entry Power: Measures volume strength combined with price movement
• Effort vs Result: Identifies climax situations (buying/selling exhaustion)
• Reversal Volume Analysis: Tracks volume at reversal candles
• Trend Integration: Combines trend direction with volume confirmation
• Bullish/Bearish Points: 11-point scoring system
• Volume Score: -100 to +100 scale (positive = bullish, negative = bearish)
• Confidence Level: Reliability percentage of the signal
• Final Signal: Clear BULLISH/BEARISH/NEUTRAL verdict
🔷 TRIPLE SIGNAL SYSTEM (Optional)
• Signal 1: Volume Score Based (customizable thresholds)
• Signal 2: Volume Spike + Candle Color (spike level selection)
• Signal 3: OBV Divergence Detection
• Independent on/off toggles for each signal
• Visual signals plotted on chart with triangles
• Combined signal alerts
🔷 COMPREHENSIVE ALERT SYSTEM
• Volume spike alerts (configurable levels)
• Signal 1, 2, 3 individual alerts
• Combined buy/sell signal alerts
• OBV trend change alerts
• Strong buying/selling pressure alerts
• Customizable alert frequency
═══════════════════════════════════════════════════════════════════════════════
📊 TABLE STRUCTURE & DISPLAY
═══════════════════════════════════════════════════════════════════════════════
The indicator features a professional 3-column table with the following sections:
📌 COLUMN HEADERS:
• INDICATOR: Metric name
• VALUE: Current reading
• STATUS: Visual status indicator (color-coded dots/icons)
📌 SECTION 1: VOLUME BASICS
Displays fundamental volume metrics with ratio indicators and percentage changes. Essential for understanding current market activity levels.
📌 SECTION 2: VOLUME SPIKE DETECTION
Real-time spike detection with 4 severity levels. Color-coded for instant recognition of abnormal volume.
📌 SECTION 3: BUY/SELL PRESSURE (ADVANCED)
Comprehensive order flow analysis with 10+ metrics. Includes advanced calculations like weighted delta, imbalance volume, and multi-candle pressure lookback.
📌 SECTION 4: VWMA ANALYSIS
Shows price position relative to volume-weighted moving average. Critical for identifying volume-supported moves.
📌 SECTION 5: OBV ANALYSIS
On Balance Volume trend and divergence detection. Helps identify smart money accumulation/distribution.
📌 SECTION 6: MFI ANALYSIS
Money Flow Index readings with overbought/oversold signals. Combines price and volume for comprehensive analysis.
📌 SECTION 7: A/D LINE
Accumulation/Distribution line trend analysis. Tracks institutional buying and selling.
📌 SECTION 8: VOLUME INTELLIGENCE
AI-powered scoring system with 11 evaluation points:
1. Volume strength assessment
2. Current buy/sell pressure
3. Multi-candle pressure lookback
4. Entry power calculation
5. Reversal volume tracking
6. VWMA position
7. OBV trend
8. OBV divergence
9. MFI signal
10. A/D trend
11. Trend-volume integration
Final output: Volume Score, Confidence Level, and highlighted FINAL SIGNAL.
═══════════════════════════════════════════════════════════════════════════════
⚙️ CUSTOMIZATION OPTIONS
═══════════════════════════════════════════════════════════════════════════════
🎨 TABLE DISPLAY
• Position: 9 locations (top-left, top-center, top-right, middle-left, etc.)
• Size: 5 sizes (tiny, small, normal, large, huge)
• Colors: Fully customizable background and text colors
• Sections: Show/hide any section independently
🎯 VOLUME SETTINGS
• Volume Average Length (default: 20)
• Spike Thresholds: Adjustable multipliers for each level
• Advanced Metrics: Lookback periods (optimized: 10 candles)
• Reversal Analysis: Candle count (optimized: 5 candles)
📊 INDICATOR LENGTHS
• OBV Smoothing: Default 14
• MFI Period: Default 14
• VWMA Length: Default 20
• A/D Length: Default 14
🎯 SIGNAL SYSTEM
• Enable/disable each signal independently
• Customizable thresholds for Signal 1 (score & confidence)
• Spike level selection for Signal 2
• Show/hide signals on chart
• Alert configuration for each signal type
═══════════════════════════════════════════════════════════════════════════════
🚀 PERFORMANCE & OPTIMIZATION
═══════════════════════════════════════════════════════════════════════════════
✅ REPLAY MODE OPTIMIZED
• Works flawlessly in TradingView Replay mode
• Optimized calculations for fast historical analysis
• No lag or freezing issues
✅ REAL-TIME EFFICIENCY
• Lightweight code structure (50 labels/lines limit)
• Smart caching of repeated calculations
• Limited loop iterations for optimal performance
• Updates only on last bar (table rendering)
✅ NON-REPAINTING
• All signals are confirmed on bar close
• No retrospective changes to historical signals
• Reliable for backtesting and strategy development
═══════════════════════════════════════════════════════════════════════════════
💡 USAGE RECOMMENDATIONS
═══════════════════════════════════════════════════════════════════════════════
📈 FOR DAY TRADING:
• Use 15m-1H timeframes
• Enable all sections for comprehensive analysis
• Focus on Volume Spike and Buy/Sell Pressure sections
• Set alerts for Strong and Extreme spikes
📈 FOR SWING TRADING:
• Use 4H-1D timeframes
• Focus on Volume Intelligence and OBV sections
• Enable Signal 1 and Signal 3 for swing entries
• Monitor divergences for trend reversals
📈 FOR SCALPING:
• Use 1m-5m timeframes
• Focus on Buy/Sell Pressure and Volume Basics
• Enable Signal 2 for quick spike-based entries
• Hide less relevant sections to reduce visual clutter
═══════════════════════════════════════════════════════════════════════════════
🎓 INDICATOR METHODOLOGY
═══════════════════════════════════════════════════════════════════════════════
This indicator combines classical volume analysis with modern algorithmic intelligence:
1. Volume Profiling: Identifies abnormal volume relative to historical averages
2. Order Flow Analysis: Separates buying and selling pressure using candle structure
3. Divergence Detection: Compares price action with volume indicators
4. Multi-Timeframe Approach: Uses smoothing and lookback for context
5. Scoring Algorithm: 11-point evaluation system for objective signal generation
6. Confluence Integration: Combines multiple indicators for higher probability setups
═══════════════════════════════════════════════════════════════════════════════
⚠️ DISCLAIMER
═══════════════════════════════════════════════════════════════════════════════
This indicator is a tool for analysis and should not be used as the sole basis for trading decisions. Always combine with your own analysis, risk management, and trading plan. Past performance does not guarantee future results.
═══════════════════════════════════════════════════════════════════════════════
📞 SUPPORT & UPDATES
═══════════════════════════════════════════════════════════════════════════════
• Regular updates and improvements
• Bug fixes and optimization
• Feature requests considered
• Community feedback welcomed
═══════════════════════════════════════════════════════════════════════════════
🌟 Happy Trading! May your volume analysis lead to profitable decisions! 🚀
═══════════════════════════════════════════════════════════════════════════════
═══════════════════════════════════════════════════════════════════════════════
═══════════════════════════════════════════════════════════════════════════════
📊 جدول معلومات الفوليوم - مؤشر احترافي لتحليل حجم التداول
═══════════════════════════════════════════════════════════════════════════════
🌐 دعم ثنائي اللغة: دعم كامل للغتين الإنجليزية والعربية - التبديل الفوري من الإعدادات!
🎯 لوحة معلومات شاملة لتحليل الفوليوم
مؤشر متقدم يوفر تحليلاً احترافياً للفوليوم من خلال جدول أنيق وقابل للتخصيص يعرض مقاييس الفوليوم الحيوية في الوقت الفعلي. مصمم للمتداولين المحترفين الذين يحتاجون إلى رؤى عميقة حول ديناميكيات حجم السوق، تدفق الأوامر، وحركة الأموال الذكية.
═══════════════════════════════════════════════════════════════════════════════
✨ الميزات الرئيسية
═══════════════════════════════════════════════════════════════════════════════
🔷 واجهة ثنائية اللغة
• التبديل السلس بين الإنجليزية والعربية
• جميع المقاييس والتسميات والإشارات مترجمة بالكامل
• مثالي للمتداولين العرب والدوليين
🔷 أساسيات الفوليوم
• الفوليوم الحالي: تتبع حجم التداول في الوقت الفعلي
• متوسط الفوليوم: المتوسط المتحرك للمقارنة
• نسبة الفوليوم: الحجم الحالي مقابل المتوسط (يحدد النشاط غير الطبيعي)
• تغير الفوليوم %: نسبة التغيير من الشمعة السابقة
• دلتا الفوليوم: الفرق بين ضغط الشراء والبيع
🔷 اكتشاف انفجارات الفوليوم (4 مستويات)
• انفجار ضعيف: 1.5 ضعف المتوسط
• انفجار متوسط: 2.0 ضعف المتوسط
• انفجار قوي: 2.5 ضعف المتوسط
• انفجار شديد: 3.0+ ضعف المتوسط
• تنبيهات بصرية مع مؤشرات ملونة
🔷 تحليل متقدم لضغط الشراء/البيع
• حجم الشراء: تراكم حجم الشموع الصاعدة
• حجم البيع: تراكم حجم الشموع الهابطة
• ضغط الشراء %: نسبة ضغط الشراء
• ضغط البيع %: نسبة ضغط البيع
• سيطرة الضغط: من يتحكم في السوق (المشترين/البائعين/محايد)
• قوة جسم الشمعة: يقيس قوة حركة السعر
• عدم التوازن: يكتشف اختلال توازن الفتائل
• دلتا الفوليوم (HLC3): حساب متقدم للدلتا
• الدلتا المرجح: حركة السعر المرجحة بالحجم
• تحليل الضغط متعدد الشموع: تحليل عدة شموع (محسّن للأداء)
🔷 تكامل المؤشرات الفنية
• VWMA (المتوسط المرجح بالحجم): موقع السعر مقابل VWMA
• OBV (الحجم التراكمي): اكتشاف الاتجاه مع تمهيد EMA
• تباعد OBV: كشف التباعدات الصعودية/الهبوطية
• MFI (مؤشر تدفق الأموال): حالات التشبع الشرائي/البيعي
• خط A/D (التراكم/التوزيع): تتبع الأموال الذكية
🔷 نظام تقييم ذكي مدعوم بالذكاء الاصطناعي
• قوة الدخول: يقيس قوة الفوليوم مع حركة السعر
• الجهد مقابل النتيجة: يحدد حالات الذروة (استنزاف الشراء/البيع)
• تحليل حجم الانعكاس: يتتبع الحجم عند شموع الانعكاس
• تكامل الاتجاه: يجمع اتجاه الترند مع تأكيد الفوليوم
• النقاط الصعودية/الهبوطية: نظام تقييم من 11 نقطة
• تقييم الفوليوم: مقياس من -100 إلى +100 (موجب = صعودي، سالب = هبوطي)
• مستوى الثقة: نسبة موثوقية الإشارة
• الإشارة النهائية: حكم واضح (صعودي/هبوطي/محايد)
🔷 نظام الإشارات الثلاثي (اختياري)
• الإشارة 1: بناءً على تقييم الفوليوم (عتبات قابلة للتخصيص)
• الإشارة 2: انفجار الفوليوم + لون الشمعة (اختيار مستوى الانفجار)
• الإشارة 3: كشف تباعد OBV
• تفعيل/إلغاء مستقل لكل إشارة
• إشارات بصرية على الشارت بمثلثات
• تنبيهات إشارات مجمعة
🔷 نظام تنبيهات شامل
• تنبيهات انفجار الفوليوم (مستويات قابلة للتهيئة)
• تنبيهات فردية للإشارات 1، 2، 3
• تنبيهات إشارات الشراء/البيع المجمعة
• تنبيهات تغيير اتجاه OBV
• تنبيهات ضغط الشراء/البيع القوي
• تردد التنبيهات قابل للتخصيص
═══════════════════════════════════════════════════════════════════════════════
📊 بنية الجدول والعرض
═══════════════════════════════════════════════════════════════════════════════
يتميز المؤشر بجدول احترافي من 3 أعمدة مع الأقسام التالية:
📌 عناوين الأعمدة:
• المؤشر: اسم المقياس
• القيمة: القراءة الحالية
• الحالة: مؤشر الحالة البصري (نقاط/رموز ملونة)
📌 القسم 1: أساسيات الفوليوم
يعرض مقاييس الفوليوم الأساسية مع مؤشرات النسب والتغيرات المئوية. ضروري لفهم مستويات نشاط السوق الحالي.
📌 القسم 2: كشف انفجارات الفوليوم
كشف فوري للانفجارات مع 4 مستويات من الشدة. ملون للتعرف الفوري على الحجم غير الطبيعي.
📌 القسم 3: ضغط الشراء/البيع (متقدم)
تحليل شامل لتدفق الأوامر مع أكثر من 10 مقاييس. يتضمن حسابات متقدمة مثل الدلتا المرجح، حجم عدم التوازن، وتحليل الضغط متعدد الشموع.
📌 القسم 4: تحليل VWMA
يعرض موقع السعر بالنسبة للمتوسط المرجح بالحجم. حاسم لتحديد الحركات المدعومة بالحجم.
📌 القسم 5: تحليل OBV
اتجاه الحجم التراكمي وكشف التباعدات. يساعد في تحديد تراكم/توزيع الأموال الذكية.
📌 القسم 6: تحليل MFI
قراءات مؤشر تدفق الأموال مع إشارات التشبع. يجمع بين السعر والحجم للتحليل الشامل.
📌 القسم 7: خط A/D
تحليل اتجاه خط التراكم/التوزيع. يتتبع الشراء والبيع المؤسسي.
📌 القسم 8: الذكاء الاصطناعي للفوليوم
نظام تقييم ذكي مع 11 نقطة تقييم:
1. تقييم قوة الفوليوم
2. ضغط الشراء/البيع الحالي
3. تحليل الضغط متعدد الشموع
4. حساب قوة الدخول
5. تتبع حجم الانعكاس
6. موقع VWMA
7. اتجاه OBV
8. تباعد OBV
9. إشارة MFI
10. اتجاه A/D
11. تكامل الاتجاه مع الفوليوم
الناتج النهائي: تقييم الفوليوم، مستوى الثقة، والإشارة النهائية المميزة.
═══════════════════════════════════════════════════════════════════════════════
⚙️ خيارات التخصيص
═══════════════════════════════════════════════════════════════════════════════
🎨 عرض الجدول
• الموقع: 9 مواقع (أعلى-يسار، أعلى-وسط، أعلى-يمين، وسط-يسار، إلخ)
• الحجم: 5 أحجام (صغير جداً، صغير، عادي، كبير، ضخم)
• الألوان: خلفية ونص قابل للتخصيص بالكامل
• الأقسام: إظهار/إخفاء أي قسم بشكل مستقل
🎯 إعدادات الفوليوم
• طول متوسط الفوليوم (افتراضي: 20)
• عتبات الانفجار: مضاعفات قابلة للتعديل لكل مستوى
• مقاييس متقدمة: فترات التحليل (محسّن: 10 شموع)
• تحليل الانعكاس: عدد الشموع (محسّن: 5 شموع)
📊 أطوال المؤشرات
• تمهيد OBV: افتراضي 14
• فترة MFI: افتراضي 14
• طول VWMA: افتراضي 20
• طول A/D: افتراضي 14
🎯 نظام الإشارات
• تفعيل/إلغاء كل إشارة بشكل مستقل
• عتبات قابلة للتخصيص للإشارة 1 (التقييم والثقة)
• اختيار مستوى الانفجار للإشارة 2
• إظهار/إخفاء الإشارات على الشارت
• تهيئة التنبيهات لكل نوع إشارة
═══════════════════════════════════════════════════════════════════════════════
🚀 الأداء والتحسين
═══════════════════════════════════════════════════════════════════════════════
✅ محسّن لوضع الريبلاي
• يعمل بسلاسة في وضع Replay في TradingView
• حسابات محسّنة للتحليل التاريخي السريع
• لا توجد مشاكل تأخير أو تجميد
✅ كفاءة الوقت الفعلي
• بنية كود خفيفة (حد 50 علامة/خط)
• تخزين ذكي للحسابات المتكررة
• تكرارات محدودة للحلقات للأداء الأمثل
• تحديثات فقط على آخر شمعة (عرض الجدول)
✅ غير قابل لإعادة الرسم
• جميع الإشارات مؤكدة عند إغلاق الشمعة
• لا توجد تغييرات بأثر رجعي على الإشارات التاريخية
• موثوق للاختبار الخلفي وتطوير الاستراتيجيات
═══════════════════════════════════════════════════════════════════════════════
💡 توصيات الاستخدام
═══════════════════════════════════════════════════════════════════════════════
📈 للتداول اليومي:
• استخدم فريمات 15د-1س
• فعّل جميع الأقسام للتحليل الشامل
• ركز على أقسام انفجار الفوليوم وضغط الشراء/البيع
• ضع تنبيهات للانفجارات القوية والشديدة
📈 للتداول المتأرجح:
• استخدم فريمات 4س-1ي
• ركز على أقسام الذكاء الاصطناعي و OBV
• فعّل الإشارة 1 والإشارة 3 لدخولات التأرجح
• راقب التباعدات لانعكاسات الاتجاه
📈 للمضاربة:
• استخدم فريمات 1د-5د
• ركز على ضغط الشراء/البيع وأساسيات الفوليوم
• فعّل الإشارة 2 لدخولات سريعة بناءً على الانفجارات
• أخفِ الأقسام الأقل صلة لتقليل الفوضى البصرية
═══════════════════════════════════════════════════════════════════════════════
🎓 منهجية المؤشر
═══════════════════════════════════════════════════════════════════════════════
يجمع هذا المؤشر بين تحليل الفوليوم الكلاسيكي والذكاء الخوارزمي الحديث:
1. تحديد الفوليوم: يحدد الحجم غير الطبيعي نسبة للمتوسطات التاريخية
2. تحليل تدفق الأوامر: يفصل ضغط الشراء والبيع باستخدام بنية الشمعة
3. كشف التباعد: يقارن حركة السعر مع مؤشرات الفوليوم
4. نهج متعدد الفريمات: يستخدم التمهيد والتحليل الرجعي للسياق
5. خوارزمية التقييم: نظام تقييم من 11 نقطة لتوليد إشارات موضوعية
6. تكامل التقاء: يجمع عدة مؤشرات لإعدادات ذات احتمالية أعلى
═══════════════════════════════════════════════════════════════════════════════
⚠️ إخلاء المسؤولية
═══════════════════════════════════════════════════════════════════════════════
هذا المؤشر هو أداة للتحليل ولا ينبغي استخدامه كأساس وحيد لقرارات التداول. اجمع دائماً مع تحليلك الخاص وإدارة المخاطر وخطة التداول. الأداء السابق لا يضمن النتائج المستقبلية.
═══════════════════════════════════════════════════════════════════════════════
📞 الدعم والتحديثات
═══════════════════════════════════════════════════════════════════════════════
• تحديثات وتحسينات منتظمة
• إصلاحات الأخطاء والتحسين
• طلبات الميزات قيد الاعتبار
• ملاحظات المجتمع مرحب بها
═══════════════════════════════════════════════════════════════════════════════
🌟 تداول سعيد! نتمنى أن يقودك تحليل الفوليوم إلى قرارات مربحة! 🚀
═══════════════════════════════════════════════════════════════════════════════
═══════════════════════════════════════════════════════════════════════════════

SPY Daily Gamma Levels [Manual Input With Alerts]Overview This indicator plots key options-based support and resistance levels (Gamma Exposure / GEX) directly on your chart. Unlike standard technical analysis, these levels (Call Wall, Gamma Flip, Put Support, and Volatility Trigger) represent where Market Makers are positioned, often acting as "magnets" or "repellents" for price action.
Important Note: TradingView Pine Script cannot currently access external options open interest data natively. Therefore, this is a Manual Input Indicator. You must update the four price levels in the settings each morning before the market opens.
Key Features:
4 Key Levels: Plots the Call Wall, Gamma Flip (Zero Gamma), Put Support, and Volatility Trigger.
Auto-Cleaning: Automatically deletes yesterday's lines to keep your chart clean; lines only show for the current session.
Alerts Included: Built-in alert conditions allow you to set notifications when price crosses the Gamma Flip or breaks the Vol Trigger.
Customization: Fully customizable colors and line styles.
Best Practices:
Timeframe: Works best on 15-minute charts for trend identification and 5-minute charts for entry execution.
Strategy:
Above Gamma Flip: Market generally stabilizes; dealers buy dips.
Below Gamma Flip: Volatility expands; dealers sell rips.
Below Vol Trigger: "Danger Zone" – expect accelerated selling pressure.
How to Get the Data (The AI Workflow)
Since these numbers change daily, I use Google Gemini to fetch the data and remind me every morning. Here is how you can set up the same automated workflow:
1. The Prompt You can ask Gemini (or your preferred AI) the following prompt manually each morning:
"Find the daily SPY Call Wall, Gamma Flip, Put Support, and Vol Trigger levels for today to input into my TradingView indicator."
2. Automating the Routine I have set up a scheduled daily reminder with Gemini. To do this yourself, simply ask Gemini:
"Can you schedule a daily task to search for these SPY Gamma levels and send them to me every morning at 8:00 AM?"
3. Updating the Chart
Receive the notification from the AI.
Open the Indicator Settings in TradingView.
Type in the new numbers.
The chart updates instantly.
Disclaimer: This tool is for educational purposes only. Gamma levels are estimates based on Open Interest and Dealer Gamma exposure models. Always manage your risk.

DeMARK 9-13For the first time ever, the power and precision of DeMARK is now available on TradingView. Combining core elements of the renowned Sequential® and Combo® studies, the DeMARK 9-13® indicator delivers the same unique insights in a streamlined interface.
The Sequential and Combo family of indicators have been trusted by the top financial firms, funds and figures for decades to enhance their trading and investment strategies. Known for their 9 Setup® and 13 Countdown® readings, these studies are designed to highlight potential market reversals as well as key areas of support, resistance and momentum. With DeMARK 9-13, users can access these groundbreaking techniques in one integrated offering.
While it's often said, "the trend is your friend," it's also crucial to recognize when it's about to end. Identifying potential market inflection points allows you to buy weakness and sell strength, improving your cost basis, reducing risk and allowing you to capitalize on a greater portion of the reversal.
At its core, 9s and 13s are constructed to measure market momentum and exhaustion. Both Sequential and Combo consist of two phases: Setup and Countdown. The Setup phase compares price activity across nine consecutive bars to define the market environment, while the Countdown phase performs a separate 13-bar comparison to indicate when a reversal may be imminent. A 9-13 reading reflects the fulfillment of both phases. When combined with TDST® lines and Risk Levels®, this approach provides a more comprehensive view of the market.
The DeMARK 9-13 indicator consists of:
Sequential
Combo
9 Setup
13 Countdown
TD Setup Trend (TDST)
Perfected® Setup
Risk Levels & Zones
Together, these elements provide an unparalleled view into the inner workings of the market, helping you anticipate shifts and act with greater precision.
🟡 DESCRIPTION
SETUP
The initial stage of the DeMARK 9-13 indicator is the Setup phase. This series is the same for both Sequential and Combo and compares the close of the current bar to the close four bars earlier. Buy Setup counts are displayed in blue below the data set and fulfilled when there are nine consecutive closes less than the close four bars earlier. Sell Setup counts are displayed in blue above the data set and fulfilled when there are nine consecutive closes greater than the close four bars earlier.
During the active Setup, all number counts remain visible to show the progress of the series. Upon completing the Setup, the 9 is recorded and the 1-8 counts are removed. This reduces visual distraction and allows for more result history (due to TradingView’s 500-label limit). Setups are always counting, with Price Flips® occurring as the series alternates between Buy and Sell Setups.
PERFECTED SETUPS
Setups can be classified as either “Perfected” or “Imperfected.” The Setup is Perfected when the 9 is completed and the 6 and 7 bars have been exceeded. In the case of a Buy Setup, the low of bars 8 or 9 must be less than the low of bars 6 and 7. Conversely, in the case of a Sell Setup, the high of bars 8 or 9 must be greater than the high of bars 6 and 7. The point at which the Setup is perfected is displayed with a solid blue dot, matching the color of the Setup series.
Generally speaking, the market will reverse or stabilize within one to four bars of a completed and Perfected Setup 9. The strength and duration of this response can be assessed with the implementation of other indicators, such as TDST® lines.
TD SETUP TREND (TDST)
The TDST indicator is derived from the Setup phase and is used to confirm market trends and identify likely trend failures. A TDST resistance line is drawn from the highest true high of the completed 9 Buy Setup series, while a TDST support line is drawn from the lowest true low of the completed 9 Sell Setup series. These TDST lines provide an indication of market support, resistance and momentum to help evaluate the integrity of the move.
TDST lines are displayed in a lighter blue than the Setup phase. When Breakout Qualifiers are enabled, TDST lines can be considered qualified or disqualified. Disqualified TDSTs appear as a dashed line, indicating potential support in the case of TDST support lines or resistance in the case of TDST resistance lines. Qualified TDSTs appear as a solid line and will stop drawing when a breakout or breakdown occurs, suggesting continued momentum.
COUNTDOWN
Once the Setup phase is completed, the second stage of the DeMARK 9-13 indicator can begin — the Countdown phase. Sequential and Combo share the same Setup series, but there are subtle differences in their respective Countdown phases, each constructed to identify areas of potential trend exhaustion in different market conditions.
Sequential is designed to respond in both trending and consolidating markets, while Combo is more responsive in trending environments and inactive during periods of market consolidation. For that reason, we often say that Combo identifies the highest or lowest points of a move, with Sequential identifying secondary tests. When aligned, these results are even more powerful.
SEQUENTIAL COUNTDOWN
A Sequential Buy Countdown is possible upon completion of a Buy Setup and looks for 13 closes less than or equal to the low two bars earlier. Sequential Buy Countdown counts are displayed as a dark green number below the data set and can begin as early as the 9 bar of a completed Buy Setup. A Sequential Sell Countdown is possible upon completion of a Sell Setup and looks for 13 closes greater than or equal to the high two bars earlier. Sequential Sell Countdown counts are displayed as a dark red number above the data set and can begin as early as the 9 bar of a Sell Setup. Because of this overlap, Sequential Countdown requires as few as 12 bars beyond the 9 Setup to complete the cycle.
Unlike the Setup phase, Countdown counts need not be consecutive. During the active Countdown, all number counts remain visible to display the progress of the series. Upon completing the Countdown, the 13 is confirmed and the 1-12 counts are removed. This reduces visual distraction and allows for more result history (due to TradingView’s 500-label limit).
A completed Sequential 13 Countdown marks the fulfillment of the 9-13 reading and identifies potential market exhaustion. Additional elements of Sequential Countdown like Intersection, Countdown Deferral, Risk Levels and the 12-bar rule can be used to provide further detail and are outlined below.
COMBO COUNTDOWN
A Combo Buy Countdown is possible upon completion of a Buy Setup and looks for 13 closes less than or equal to the low two bars earlier, with additional rules based on the Combo version selected. Combo Buy Countdown counts are displayed as a light green number below the data set and can begin as early as the 1 bar of a completed Buy Setup. A Combo Sell Countdown is possible upon completion of a Sell Setup and looks for 13 closes greater than or equal to the high two bars earlier, with additional rules based on the Combo version selected. Combo Sell Countdown counts are displayed as a magenta number above the data set and can begin as early as the 1 bar of a Sell Setup. Because of this overlap, Combo Countdown requires as few as four bars beyond the 9 Setup to complete the cycle.
Unlike the Setup phase, Countdown counts need not be consecutive. During the active Countdown, all number counts remain visible to display the progress of the series. Upon completing the Countdown, the 13 is confirmed and the 1-12 counts are removed. This reduces visual distraction and allows for more result history (due to TradingView’s 500-label limit).A completed Combo 13 Countdown marks the fulfillment of the 9-13 reading and identifies potential market exhaustion. Additional elements of Combo Countdown like Risk Levels and the 12-bar rule can be used to provide further detail and are outlined below.
RISK LEVELS
When a 9 Setup or 13 Countdown indication is recorded, a Risk Level is generated to identify the zone within which a reversal should occur. This level accounts for any residual trend momentum without invalidating the buy or sell indication. For a completed buy indication, the Risk Level marks the price above which the 9 or 13 remains active and serves as additional support. Conversely, for a completed sell indication, it marks the price below which the 9 or 13 remains active and serves as additional resistance. This level can be viewed as the maximum threshold the indication can withstand before the prevailing momentum overwhelms and negates it and is often used to establish stop-loss areas.
Risk Level line colors correspond to the completed Setup, Sequential Countdown or Combo Countdown that generated it. Shaded risk zones can also be displayed, further highlighting the indication window. When Breakout Qualifiers are enabled, the Risk Level can be considered qualified or disqualified. Disqualified Risk Levels appear as a dashed line, indicating likely support in the case of a buy indication and likely resistance in the case of a sell indication. Qualified Risk Levels appear as a solid line and will stop drawing when a breakout or breakdown occurs, suggesting continued momentum.
4-BAR & 12-BAR METRICS
Generally speaking, the market should see some sort of response within four bars of a completed 9 Setup indication and 12 bars of a completed 13 Countdown indication. If the chart has not responded in that time the existing trend is likely to continue.
INTERSECTION
Intersection is an elective setting unique to Sequential Countdown. When enabled, it postpones the start of the Countdown phase until the price range of the later Setup counts overlap with the price activity of any Setup count occurring three or more bars earlier. This is intended as a pressure release to avoid commencing the count during an extraordinary breakaway market event or aberration. The Intersection level’s color matches its corresponding Buy and Sell Countdown reading and is displayed as a horizontal line on the confirming bar.
COUNTDOWN DEFERRAL
The Sequential Countdown phase of the DeMARK 9-13 indicator includes two optional Countdown Deferral qualifiers — the 13 vs. 8 rule and the 8 vs. 5 rule.
The 13 vs. 8 Countdown Deferral rule is designed to ensure that the tail end of the Countdown is representative of the existing trend. To fulfill this restriction, the low of the 13 bar must be less than or equal to the close of the 8 bar in the case of a Sequential Buy Countdown, while the high of the 13 bar must be greater than or equal to the close of the 8 bar in the case of a Sequential Sell Countdown. Because Countdown counts can increment in a sideways market, this rule helps to confirm that a trend has remained intact and improves accuracy as the series reaches its completion.
When enabled, this Countdown Deferral condition substitutes a “+” for what would otherwise be a “13,” thereby postponing the count. A Sequential Buy Countdown deferral is displayed in dark green below the data set, while a Sequential Sell Countdown deferral is displayed in dark red above the data set. Note that this optional setting is enabled by default and labeled “Last vs. 8 Qualifier” in the DeMARK 9-13 indicator settings.
Whereas the 13 vs. 8 rule is designed to ensure that the tail end of the Sequential series is representative of the existing trend, the 8 vs. 5 Countdown Deferral rule is designed to ensure that the body of the Countdown phase is properly configured. As with the 13 vs. 8 rule, the 8 vs. 5 rule matches the color and placement of its corresponding Buy or Sell Countdown series and substitutes a "+" for what would otherwise be an "8," thereby postponing the count. The 13 vs. 8 comparison is critical to the Countdown phase, while the 8 vs. 5 comparison is elective and provides additional confidence that the trend has remained intact.
COUNTDOWN RECYCLE®
Markets are constantly evolving to reflect new information. Just as fundamentals experience occasional adjustments impacting the expectations of the asset, so too do technical analysis and market timing. This is most often reflected in the Sequential and Combo Countdown phase by a process known as Recycling.
Recycling occurs when a Countdown 13 is interrupted by a subsequent overlapping “22” Setup count in the same direction. Recycling suggests that the new Setup is sufficiently strong to weaken the impact of a confirmed Countdown series and resets the process. A recycling indication is represented as an “R” where the Countdown 13 was previously displayed, matching the color and placement of that Buy or Sell Countdown series.
COUNTDOWN CANCELLATION
Once completed, a 9 Setup and 13 Countdown confirmation is permanent and never altered. However, it’s important to note that Countdowns can be cancelled during their construction phase. There are two scenarios where a Countdown series would be removed from the chart.
The first Countdown cancellation scenario occurs when a subsequent 9 Setup is confirmed in the opposite direction prior to the completion of the Countdown phase. The reasoning is that market conditions have changed from what they were when the initial Setup was fulfilled, making the newer Setup more relevant. Upon confirming an opposing 9 Setup, the incomplete Countdown phase is canceled and removed from the chart.
The second Countdown cancellation scenario takes place when the TDST in the opposite direction is violated, suggesting a conclusion to the previous trend and a confirmation of a new one. In these cases, a true low that occurs above the Buy Setup’s TDST resistance line, or a true high that occurs below the Sell Setup’s TDST support line, cancels the incomplete Countdown phase and removes the counts from the chart.
🟡 SETTINGS
DISPLAY
Setup : Displays the Setup phase of the Sequential and Combo indicators. The first swatch controls the color of the Buy Setup phase displayed below the data set. The second swatch controls the color of the Sell Setup phase displayed above the data set.
TDST : Displays the TDST lines for the Sequential and Combo indicators. The first swatch controls the color of the TDST resistance lines associated with the Buy Setup phase. The second swatch controls the color of the TDST support lines associated with the Sell Setup phase.
Sequential Countdown : Displays the Countdown phase of the Sequential indicator. The first swatch controls the color of the Buy Countdown phase displayed below the data set. The second swatch controls the color of the Sell Countdown phase displayed above the data set.
Combo Countdown : Displays the Countdown phase of the Combo indicator. The first swatch controls the color of the Buy Countdown phase displayed below the data set. The second swatch controls the color of the Sell Countdown phase displayed above the data set.
Indicator font size : Adjusts the size of the Sequential and Combo indicator counts displayed above and below the data set. ( Default: 18 )
Display full series count : Displays the full Sequential and Combo numerical series for the active 9 Setup and 13 Countdown phases only, or for all completed indications (within TradingView’s 500-label limit). ( Default: Active only )
SETUP
Bars to Setup : Number of consecutive bars needed to complete the Setup phase. ( Default: 9 )
Bars to look back : Defines the bar to which the current Setup count is compared. ( Default: 4 )
Setup compare : Determines whether equal prices should increment the Setup count. ( Default: Without equal )
Count completion weight : Adjusts the font weight of the Setup completion counts displayed above and below the data set. ( Default: Bold )
Setup Perfection : Identifies when Setup Perfection occurs, with the low of the final two Buy Setup counts less than the lows three or four bars prior to completion, and the high of the final two Sell Setup counts greater than the highs three or four bars prior to completion. With the default “Bars to Setup” setting of “9,” Perfection occurs when the low of Buy Setup bar 8 or 9 is less than the lows of bars 6 and 7, and the high of Sell Setup bar 8 or 9 is greater than the highs of bars 6 and 7. ( Default: Enabled )
Enable Setup Risk Level : Displays the Risk Level tied to the Setup. ( Default: On )
Enable Setup Risk Level Zone : Shades the area between the completed Setup and its Risk Level. ( Default: On )
TD SETUP TREND (TDST)
TDST line thickness : Adjusts the thickness of TDST support and resistance lines. ( Default: Standard )
COUNTDOWN (SHARED)
Bars to Countdown : Number of bars needed to complete the Countdown phase. ( Default: 13 )
Bars to look back : Defines the bar to which the current Countdown count is compared. ( Default: 2 )
Countdown comparison value : Output used in the Countdown look back comparison. For Aggressive settings, Low/High is required. ( Default: Close )
Termination Count price value : Allows the final count of the Countdown phase to use a different comparison value for more flexibility. ( Default: Open or Close )
Countdown compare : Determines whether equal prices should increment the Countdown count. ( Default: With equal )
Count completion weight : Adjusts the font weight of the Countdown completion counts displayed above and below the data set. ( Default: Bold )
SEQUENTIAL COUNTDOWN
Enable Intersection : Toggles the Sequential Intersection phase requirement. ( Default: Off )
8 vs. 5 Qualifier : Qualifier requiring the low of the 8 Buy Countdown to be less than the close of the 5 count, and the high of the 8 Sell Countdown to be greater than the close of the 5 count. ( Default: Off )
Last vs. 8 Qualifier : Qualifier requiring the low of the final Buy Countdown count to be less than the close of the 8 count, and the high of the final Sell Countdown to be greater than the close of the 8 count. With the default “Bars to Countdown” setting of “13,” the low of the 13 Buy Countdown would need to be less than the close of the 8 count, and the high of the 13 Sell Countdown would need to be greater than the close of the 8 count. ( Default: On )
Enable Risk Level : Displays the Risk Level tied to the Countdown. ( Default: On )
Enable Risk Level Zone : Shades the area between the completed Countdown and its Risk Level. ( Default: On )
COMBO COUNTDOWN
Combo version : Determines the version of Combo used for the Countdown phase, whether it’s Standard, Conservative or Aggressive. ( Default: Standard )
Enable Risk Level : Displays the Risk Level tied to the Countdown. ( Default: On )
Enable Risk Level Zone : Shades the area between the completed Countdown and its Risk Level. ( Default: On )
RECYCLE
Enable Recycle : Toggles Recycling, replacing the final Sequential and Combo Countdown count with an “R” when its rules are met. With the default “Bars to Countdown” setting of “13,” a recycled 13 count would be replaced with the ‘R’. ( Default: On )
Setup Count : Defines the number of consecutive Setup bars required to trigger a Recycle. ( Default: 22 )
CANCEL
Reverse Setup : Incomplete Countdowns are cancelled when a Setup in the opposite direction is confirmed. ( Default: On )
TDST Rule : Incomplete Buy Countdowns are cancelled when a true low exceeds the Buy Setup’s TDST resistance line, and incomplete Sell Countdowns are cancelled when a true high breaks the Sell Setup’s TDST support line. ( Default: On )
BREAKOUT QUALIFIERS
Enable Breakout Qualifiers : Breakout Qualifier rules will dictate whether TDST and Risk Level line breakouts can be considered qualified or disqualified. Qualified lines are solid and will stop drawing when a breakout or breakdown occurs, suggesting continued momentum. Disqualified lines are dashed, serving as resistance in the case of a false breakout and support in the case of a false breakdown. When Breakout Qualifier rules are disabled, a line becomes solid on any close beyond the level. ( Default: On )
🟡 DISCLAIMER
By subscribing to and or using DeMARK 9-13 or any other DeMARK Indicators on TradingView, you acknowledge that you have read, understood and agree to the DeMARK for TradingView Terms of Service (located in the DeMARK account signature) as well as any updates to those terms which may happen from time-to-time.
The DeMARK Indicators are powerful tools designed to assist the individual process you use to understand financial markets and make investment decisions but they are not trading systems. Any information presented is not, and should not be construed as, financial or investment advice. You should not make any investment decision based solely on the information provided by these tools. The products we offer do not recommend or endorse any specific securities, financial products or investment strategies. Any information, data or analysis presented by any DeMARK products or tools is generic and does not consider your personal financial situation, investment objectives or risk tolerance. All investment decisions are yours alone and are made at your own risk. Those risks include, but are not limited to, potential system errors, data inaccuracies or outages.
From time to time unauthorized and unaffiliated third parties use the DeMARK name or the names of our copyrighted and/or trademarked products in an unapproved, inaccurate and misleading manner. While we do our best to remove these examples, some fake, flawed and fraudulent may exist. The only official and accurate sources of our products are those listed on the DeMARK company website. Unauthorized reproduction, copying, scraping, republishing, distribution, dissemination or any other use of our name, trademarks and/or copyrighted materials (including this script documentation) is prohibited.
Without in any way limiting DeMARK’s exclusive rights under copyright, trademark and all other intellectual property protections, any use of DeMARK products to “train” generative artificial intelligence (AI) technologies to generate text is expressly prohibited. DeMARK reserves all rights to license uses of this work for generative AI training and development of machine learning language or machine learning visual models.
The data and analysis in our products are based on sources believed to be reliable, but DeMARK does not control or guarantee the accuracy, completeness or timeliness of this information.
As a DeMARK subscriber or user, you are responsible for conducting your own research and due diligence before making any investment decisions.
Past performance, including any simulated or historical data, is not indicative of future results.
Paid script

🧠 Quantum Regime Shift Detector v3.0 — Institutional Edition🧠 Quantum Regime Shift Detector v3.0 — Institutional Overview
📊 What It Does
The Quantum Regime Shift Detector identifies when the market transitions between different volatility and behavioral states.
It classifies every moment as one of three regimes:
Regime Description Visual
Stable Low-volatility, predictable environment ideal for trend-following 🟢 Green
Transition High-volatility, chaotic regime shifts or market rotations 🔴 Red
Uncertain Mid-zone where signals conflict or structure is reforming 🟡 Yellow
⚙️ How It Works
1️⃣ Five-Factor Market Feature Engine
Feature Description
Volatility Short-term standard deviation of price — captures movement intensity
Trend Strength Distance between fast and slow EMAs — shows directional persistence
Momentum Rate of price change — detects acceleration or exhaustion
Volume Change Relative volume spikes or droughts — measures participation shifts
Volatility Clustering ATR vs long-term ATR average — flags clustering of volatility bursts
2️⃣ Weighted AI-Style Shift Score
All five features are blended into a single smoothed composite using customizable weights
(default 30 % Volatility / 30 % Trend / 25 % Momentum / 15 % Volume / 20 % Clustering).
Think of it as a mini-neural-network attention layer that highlights whichever factor dominates.
3️⃣ Adaptive Percentile Thresholds
Analyzes the last 200 bars to build rolling percentiles:
📈 Above 75th percentile → Transition
📉 Below 25th percentile → Stable
⚖️ Between → Uncertain
This self-adjusts to volatility shifts across any timeframe or asset.
4️⃣ Visual System
Element Meaning
Aqua Line Quantum Shift Score (main signal)
Red / Green Lines Dynamic thresholds
Blue Fill Uncertain zone
Purple Line Regime probability (0–1 scale)
Histogram Current regime (high/low bars)
Background Tint Directional bias — green for bullish, red for bearish
🚨 Alerts & Integrations
Trigger Purpose
Bull Regime Shift Transition + bullish bias → “🚀 Bullish regime expansion detected.”
Bear Regime Shift Transition + bearish bias → “⚠️ Bearish volatility regime forming.”
Stable Zone Entry Calm phase → “✅ Market entering stable phase.”
AI Bridge Hooks Webhook alerts → POST /regime?state=transition / stable for Python or Alice integration
💡 Practical Use Cases
Objective Application
Position Sizing Reduce exposure during red transition zones
Strategy Selection Trend-follow in green stable zones; mean-revert in red transitions
Risk Management Tighten stops or hedge when volatility expands
Entry Timing Prefer entries during stabilization after transitions
🧩 Key Strength
A multi-dimensional, self-learning market classifier that adapts across assets and timeframes, giving you a quantitative edge by revealing when to change your playbook — before the market does.
