Lune Market Analysis Premium- Version 0.9 -
Lune Algo was developed and built by Lune Trading, utilizing years of their trading expertise. This indicator works on all stocks, cryptos, indices, forex, futures , currencies, ETF's, energy and commodities. All the tools and features you need to assist you on your trading journey. Best of all, Lune Algo is easy to use and many of our tools and strategies have been thoroughly backtested thousands of times to ensure that users have the best experience possible.
Overview
Trade Dashboard—Provides information about the current market conditions, Such as if the market is trending up or down, how much volatility is in the market and even displays information about the current signal.
Trade Statistics—This tool gives you a breakdown of the Statistics of the current selected strategy based on backtests. It tells you the percentage of how often a Take Profit or Stop Loss was hit within a specific time period. Risk and Trade management is very important in trading, and can be the difference between a winning and losing strategy. So we believe that this was mandatory.
Current Features:
Advanced Buy and Sell Signals
Exclusive built-in Strategies
Lune Confidence AI
EK Clouds
Reversal Bands
Vray (Volume Ray)
Divergence Signals
Reversal Signals
Support/Resistance Zones
Built-in Themes
Built-in Risk Management system (take profit/stop loss)
Trade Statistics
Trade Assistance
Trade Dashboard
Advanced Settings
+ More coming soon, Big plans!
Features Breakdown:
Lune Confirmation—Used to help you confirm your trades and trend direction. It uses unique calculations, and its settings can be adjusted to allow traders to adapt the settings to fit their trading style.
Lune Confidence AI—All strategies are equipped with our exclusive built-in Confidence AI. This feature tells you how much confluence there is in a trade. It uses a rating system where signals are given a number from 0 to 5. A rating of 0 indicates that there is not a lot of confluence or confidence in the signal, while a rating of 5 indicates that there is a lot of confidence in the trade. This feature is not perfect and will be improved overtime.
Support/Resistance Zones—Calculates the most important support/resistance levels based on how many times a level has been used as support or resistance. Traders also refer to these as supply and demand zones and key levels.
EK Clouds—Used to further help you confirm trend and was optimized to also be used as support and resistance. This feature is powered by custom moving averages.
Reversal Bands—An optimized and improved version of the infamous Bollinger Bands. When price action takes place within the Reversal Bands it usually indicates that the current symbol is overextended and a reversal is possible.
Vray—Also Known as "Volume Ray", Assists you in better visualizing volume. This helps you find key levels and areas of support that you wouldn't be able to see otherwise. It helps you trade like the institutions.
This indicator's signals DO NOT REPAINT.
If you are using this script you acknowledge past performance is not necessarily indicative of future results and there are many more factors that go into being a profitable trader.
Search in scripts for "ai"
Ganntime Grid Bot long strategy This is a simulating 3commas grid and DCA robot strategy implementation. In AI mode, the default grid width of btc is 500, and the default grid width of eth is 25. Anyone can use it for free. You can also cancel the AI mode option and manually set the grid size and grid width. The initial order, safety order size, stop loss and take profit parameters are consistent with the configuration and usage of 3commas dca bot.
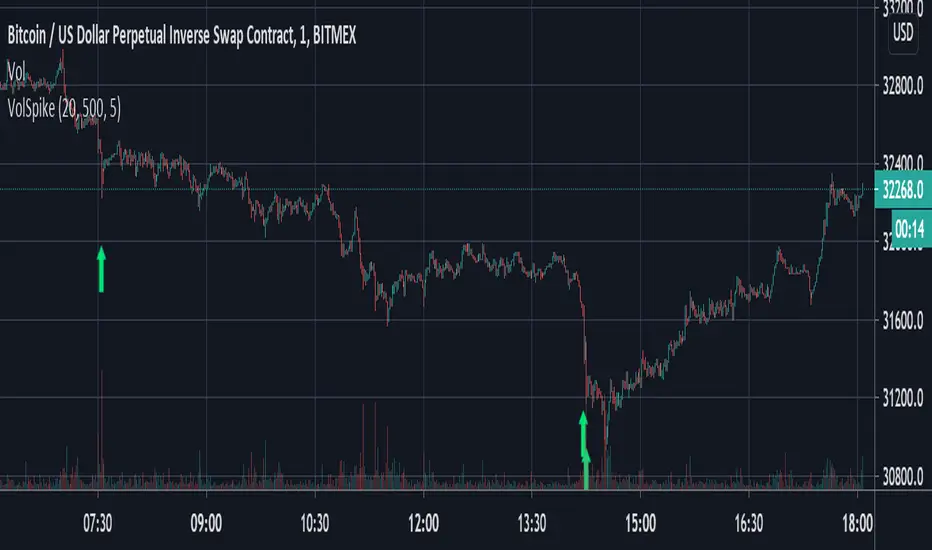
Volume Spike Strategy This is a Pine Script implementation of “Capitalize AI: Volume Spike Strategy" by Bitcoin Trading Challenge (copied with permission).
Original Capital AI formula :
If BTC/USD 1 minute volume > BTC/USD average volume in 20-1m bar by at least 500% and if BTC/USD is below the MA (5,1m,close) of BTC/USD then buy 10,000 USD WORTH of BTC/USD
Tested on XBTUSD 1 minute.
Original strategy is buy-only. Option for sells was added (enable in settings).
First published script -- comments/feedback appreciated
ADX DMI 3x - Dingue- ADX DMI DINGUE -
Français (bottom) / English
The best baddest - The Ultimate ADX DMI indicator for you to use.
Good to clearly see who's in control. Bear Bull
Includes :
- 3x ADX
- 3x DMI
- 3 line system which uses DMI calculation and put it in a single line instead of positive / negative.
Manual or Auto settings which adjusts length based on time frame used on screen.
Color coded for clear direction.
Squeeze shows when both sides are close together and this is when the trend might change or keep going.
Suggestions are welcome, ask below for any questions.
Try my other "DINGUE" indicators.
Thanks.
----------------- Français -----------------
Le meilleur, le plus génial - L'ultime indicateur ADX DMI pour votre utilisation
Très bon pour voir qui est en contrôle.
Inclu :
- 3x ADX
- 3x DMI
- 3 lignes qui remplace les lignes positives négatives du DMI pour une visualisation plus simple.
Paramétrage manuel ou automatique qui ajuste les valeurs selon la grandeur de chandelles utilisée à l'écran.
Codé avec des couleurs pour une visibilités de la direction claire.
Squeeze qui montre quand les 2 côtés sont près l'un de l'autre et quand un changement de contrôle ou une continuation de la tendance se produit.
Suggestions appréciées, pour toutes questions, écrire dans les commentaires plus bas.
Essayez les autres indicateurs "DINGUE".
Merci.
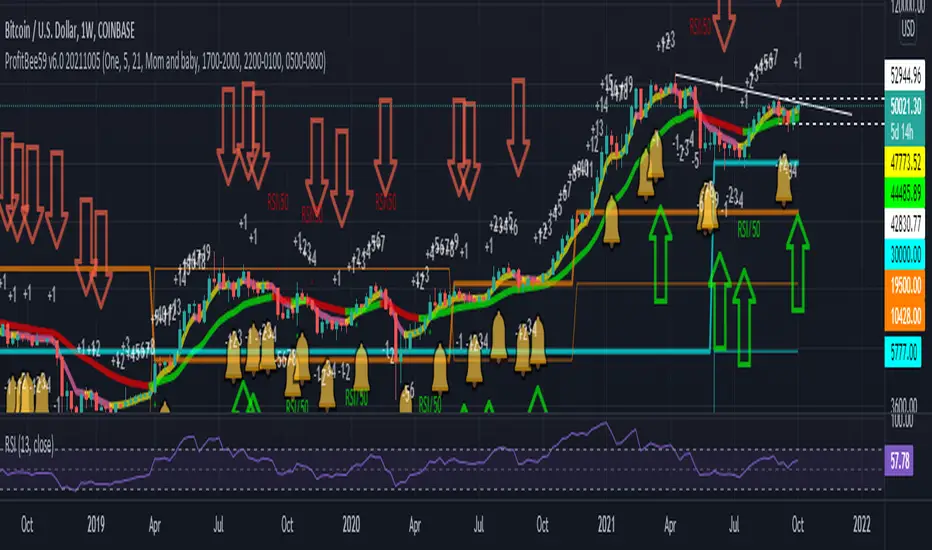
ProfitBee59 v6.0ProfitBee59 v6.0 for TradingView (pb6 ai) helps you do tedious works on your technical charts.
*It does CC59 counting and prints out a positive or negative number on each price bar.
*When the counting arrives at -9 or +9, it creates support and resistance ( SNR ) levels on the chart.
*It draws a pair of fast/slow average lines with pink/red colors for corresponding downtrend and yellow/green for uptrend.
*It shows a crossing point between fast/slow average line with a cream cross sign.
*It analyses and prints Up/Dn arrows base on each of these modes including time, price, average line turnings and crossing, above red/ below green (ARBG) candlesticks.
*It draws lines showing differences between price-fast average, price-slow average, and fast average-slow average.
*In addition, other auxiliary tools such as Max/Min finder used to find the candlesticks with local max/min prices or Gap finder used to locate discontinuity between candlesticks are also provided.
*For Forex trading, other intraday parameters are also available including the day opening level, high/low of previous days as well as intraday brown background marking overlapping sessions for Sydney-Tokyo, Tokyo-London and London-New York markets.
*Smart phone/tablet and PC notifications of events occurring in the chart can be sent to you by server-side alerts so that you don't have to stay in front of the screen all the time.
------------------------------
How to install the script:
------------------------------
*Go to the bottom of this page and click on "Add to Favorite Scripts".
*Remove older version of the script by clicking on the "X" button behind the indicator line at the top left corner of the chart window.
*Open a new chart at and click on the "Indicators" tab.
*Click on the "Favorites" tab and choose "ProfitBee59 v6.0".
*Right click anywhere on the graph, choose "Color Theme", the select "Dark".
*Right click anywhere on the graph, choose "Settings".
*In "Symbol" tab, set "Precision" to 1/100 for stock price or 1/100000 for Forex and set "Time Zone" to your local time.
*In "Scales" tab, check "Symbol Name Label" and "Indicator Last Value Label".
*In "Events" tab, check "Show Dividends on Chart", "Show Splits on Chart" and "Show Earnings on Chart".
*At the bottom of settings window, click on "Template", "Save As...", then name this theme of graph setting for future call up such as "Stock pb6" or "Forex pb6".
*Click OK.
==========================================
ProfitBee59 v6.0 for TradingView (pb6 ai) is locked and protected.
Please ***do not*** ask for access in the comment section.
Use the link below to obtain access to this indicator.
==========================================
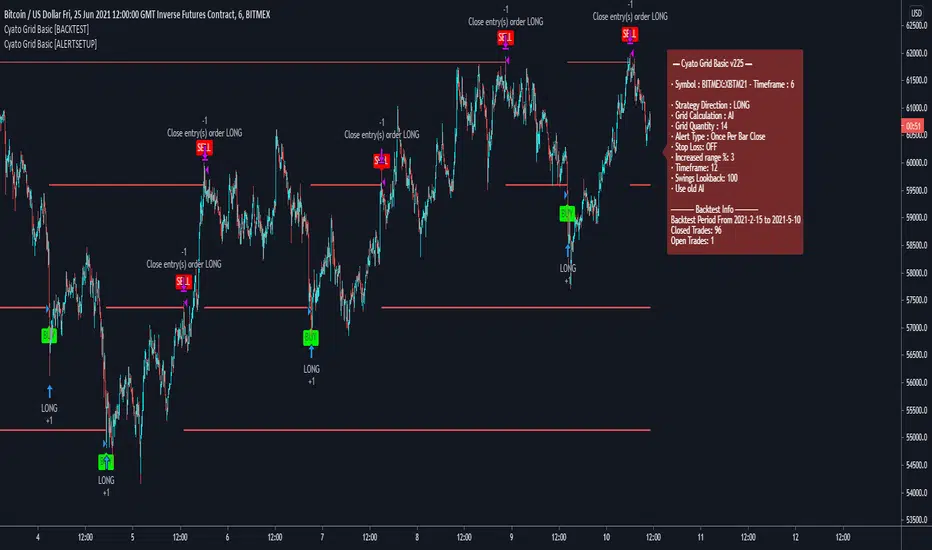
Cyato Grid Basic Buy & Sell [BACKTEST]Private indicator
This Grid bot strategy creates buy orders when the price goes down one level or more, and sell order when the price goes up one level or more.
To avoid useless trades, the lastest traded level is disabled until another level is crossed.
To create the grid, one upper level and one lower level is calculated. Those 2 levels are either given by the user using "MANUAL" mode or automatically calculated by an AI. The space between these two levels are then divided equally into several steps, creating the grid. The number of steps is chosen by the user, from 3 to 20.
HOW IT WORKS
This is the Backtest version meaning this is the one you should use with the Strategy Tester (more below).
Select either "MANUAL" or "AI" mode.
When using "MANUAL", you have to configure an upper level and a lower level.
When using "AI", the upper and lower level are automatically calculated from last 7 days high/low plus a 3% deviation. You can configure the timeframe and the deviation.
Select the grid quantity, from 3 to 20.
Example with 3:
Example with 10:
Example with 20:
You can choose between "Once Per Bar Close" or "Once Per Bar" alert type.
"Once Per Bar Close" will wait candle close to confirm a trade.
"Once Per Bar" will trigger a trade if the price crossed a step anytime inside a candle. Note that the backtest will still use bar close price in its calculation.
BACKTESTING
The strategy will buy 1 contract when a BUY signal appears and sell 1 contract when a SELL signal appears.
Here 1 contract = 1 BTC
The strategy can buy up to 20 contracts. Pyramiding is enabled.
The Backtest info panel is here to show how many trades are open in the backtest.
I know very well that a backtest has no value if several trades are left open. That is why I coded a feature to close all open trades at once on the last candle. This feature can be turned on and off.
To get this indicator, use the link in my signature below, thanks!

Cyato Grid Basic Buy & Sell [ALERTSETUP]Private indicator
This Grid bot strategy creates buy orders when the price goes down one level or more, and sell order when the price goes up one level or more.
To avoid useless trades, the lastest traded level is disabled until another level is crossed.
To create the grid, one upper level and one lower level is calculated. Those 2 levels are either given by the user using "MANUAL" mode or automatically calculated by an AI. The space between these two levels are then divided equally into several steps, creating the grid. The number of steps is choosen by the user, from 3 to 20.
How it Works
This is the Alert Setup version meaning this is the one you should use to create alerts (more below).
Select either "MANUAL" or "AI" mode.
When using "MANUAL", you have to configure an upper level and a lower level.
When using "AI", the upper and lower level are automatically calculated from last swing high/low.
Select the grid quantity, from 3 to 20.
Example with 3:
Example with 10:
Example with 20:
Creating the Alerts
When opening the alert popup, select "Cyato Grid" in the condition.
Make sure to use the option "Once per bar close" in order to stay in sync with the graphics on chart. (Only use "Once per bar" if you really know what you are doing).
Available alerts:
- BUY : Buy alert. Green label on chart.
- SELL: Sell alert. Red label on chart.
To get this indicator, use the link in my signature below, thanks!
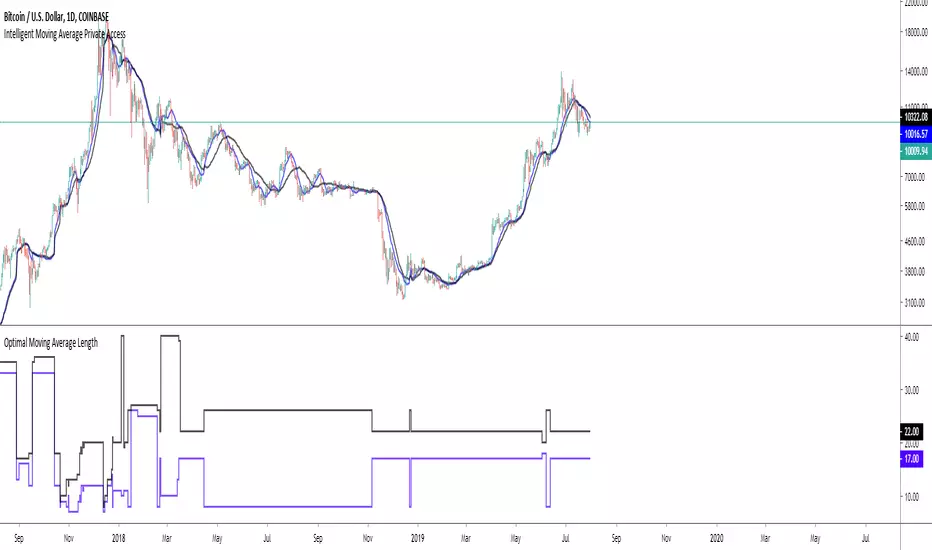
Intelligent Moving Average Private AccessNote: This indicator is intended for those who have been granted private access and may be more frequently updated than the previous versions.
Introduction
This indicator uses machine learning (Artificial Intelligence) to solve a real human problem.
The Moving Average is the most used indicator on the planet, yet no one really knows what pair of moving average lengths works best in combination with each other.
A reason for this is because no two moving averages are always going to be the best on every instrument, time-frame, and at any given point in time.
The " Intelligent Moving Average " solves the moving average problem by adapting the period length to match the most profitable combination of moving averages in real time.
How does the Intelligent Moving Average work?
The artificial intelligence that operates these moving average lengths was created by an algorithm that tests every single combination across the entire chart history of an instrument for maximum profitability in real-time.
No matter what happens, the combination of these moving averages will be the most profitable.
Can we learn from the Intelligent Moving Average?
There are many lessons to be learned from the Intelligent Moving Average. Most will come with time as it is still a new concept.
Adopting the usefulness of this AI will change how we perceive moving averages to work.
Limitations
Ultimately, there are no limiting factors within the range of combinations that has been programmed. The moving averages will operate normally, but may change lengths in unexpected ways - maybe it knows something we don't?
Thresholds
The range of moving average lengths is between 5 to 40.
Additional coverage resulted in TradingView server errors.
Future Updates!
This indicator will be maintained and many updates will come in the near future! Stay tuned.
View the documentation on this indicator here: www.kenzing.com
Well Rounded Moving AverageIntroduction
There are tons of filters, way to many, and some of them are redundant in the sense they produce the same results as others. The task to find an optimal filter is still a big challenge among technical analysis and engineering, a good filter is the Kalman filter who is one of the more precise filters out there. The optimal filter theorem state that : The optimal estimator has the form of a linear observer , this in short mean that an optimal filter must use measurements of the inputs and outputs, and this is what does the Kalman filter. I have tried myself to Kalman filters with more or less success as well as understanding optimality by studying Linear–quadratic–Gaussian control, i failed to get a complete understanding of those subjects but today i present a moving average filter (WRMA) constructed with all the knowledge i have in control theory and who aim to provide a very well response to market price, this mean low lag for fast decision timing and low overshoots for better precision.
Construction
An good filter must use information about its output, this is what exponential smoothing is about, simple exponential smoothing (EMA) is close to a simple moving average and can be defined as :
output = output(1) + α(input - output(1))
where α (alpha) is a smoothing constant, typically equal to 2/(Period+1) for the EMA.
This approach can be further developed by introducing more smoothing constants and output control (See double/triple exponential smoothing - alpha-beta filter) .
The moving average i propose will use only one smoothing constant, and is described as follow :
a = nz(a ) + alpha*nz(A )
b = nz(b ) + alpha*nz(B )
y = ema(a + b,p1)
A = src - y
B = src - ema(y,p2)
The filter is divided into two components a and b (more terms can add more control/effects if chosen well) , a adjust itself to the output error and is responsive while b is independent of the output and is mainly smoother, adding those components together create an output y , A is the output error and B is the error of an exponential moving average.
Comparison
There are a lot of low-lag filters out there, but the overshoots they induce in order to reduce lag is not a great effect. The first comparison is with a least square moving average, a moving average who fit a line in a price window of period length .
Lsma in blue and WRMA in red with both length = 100 . The lsma is a bit smoother but induce terrible overshoots
ZLMA in blue and WRMA in red with both length = 100 . The lag difference between each moving average is really low while VWRMA is way more precise.
Hull MA in blue and WRMA in red with both length = 100 . The Hull MA have similar overshoots than the LSMA.
Reduced overshoots moving average (ROMA) in blue and WRMA in red with both length = 100 . ROMA is an indicator i have made to reduce the overshoots of a LSMA, but at the end WRMA still reduce way more the overshoots while being smoother and having similar lag.
I have added a smoother version, just activate the extra smooth option in the indicator settings window. Here the result with length = 200 :
This result is a little bit similar to a 2 order Butterworth filter. Our filter have more overshoots which in this case could be useful to reduce the error with edges since other low pass filters tend to smooth their amplitude thus reducing edge estimation precision.
Conclusions
I have presented a well rounded filter in term of smoothness/stability and reactivity. Try to add more terms to have different results, you could maybe end up with interesting results, if its the case share them with the community :)
As for control theory i have seen neural networks integrated to Kalman flters which leaded to great accuracy, AI is everywhere and promise to be a game a changer in real time data smoothing. So i asked myself if it was possible for a neural networks to develop pinescript indicators, if yes then i could be replaced by AI ? Brrr how frightening.
Thanks for reading :)

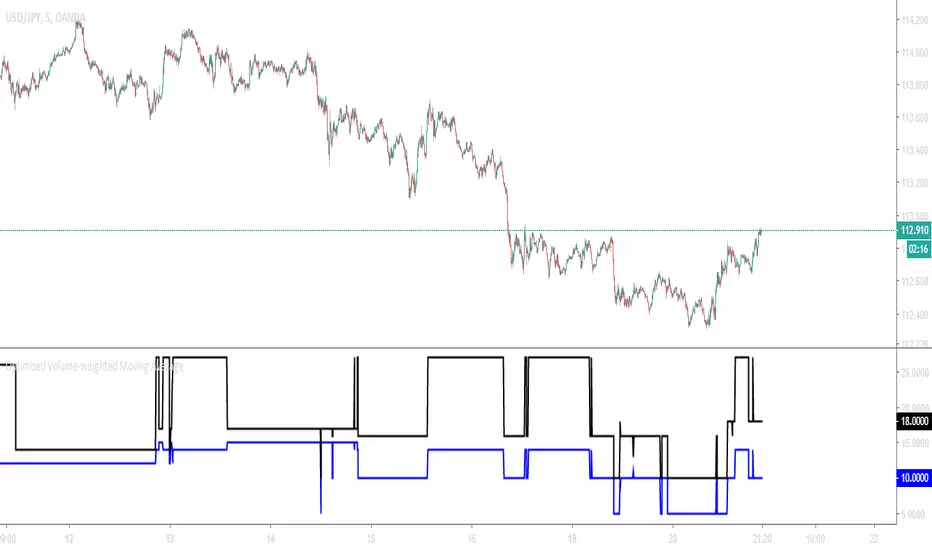
Optimised Volume-weighted Moving AverageAbout
This tool measures the profitability of every volume-weighted moving average length combination for the entire history of the instrument that it is applied,
and only displays the most profitable combination in real-time which means that this indicator is fully functional for trading.
The Optimised Volume-weighted Moving Average can be tested using a Volume-weighted Moving Average Strategy and the Strategy Tester panel on any instrument or time-stamp. It will always display the lengths of the most profitable exponential moving average lengths at the current moment in time.
This can be used on its own, or paired with the Intelligent Volume-weighted Moving Average (AI) for a better understanding of the indicators movements.
The Intelligent Volume-weighted Moving Average (AI) uses this tool as a predictive method for machine learning.
Optimised Exponential Moving AverageAbout
This tool measures the profitability of every exponential moving average length combination for the entire history of the instrument that it is applied and only displays the most profitable combination in real-time meaning that this indicator is fully functional for trading.
The Optimised Exponential Moving Average can be tested using an Exponential Moving Average strategy and the Strategy Tester panel on any instrument or time-stamp. It will always display the lengths of the most profitable exponential moving average lengths at the current moment in time.
This can be used on its own, or paired with the Intelligent Exponential Moving Average (AI) for a better understanding of the indicators movements.
The Intelligent Exponential Moving Average (AI) uses this tool as a predictive method for machine learning.

Clock&Flow: Elements of Cycle Analysis 2nd partClock&Flow – Elements of Cycle Analysis (ECA) | Complete Suite
Elements of Cycle Analysis (ECA) is an advanced cyclic analysis suite designed to interpret the market through time, structure, strength, and energy, combining cycles, volatility, and participation into a single operational framework.
The suite consists of two complementary modules:
🔹ECA 1 – Cycles, Structure, and Volatility (Overlay: True)
ECA 1 is dedicated to the structural and temporal analysis of the market.
Cyclic SMAs (Cyclic Ratio) Moving averages are calibrated according to nominal cycles and timeframes to monitor multiple cycles simultaneously (from the lower cycle to the upper cycles). Crossovers between fast and slow SMAs certify the closing or transition of the cycle related to the faster SMA. The specific cycle is identified in the Info Table at the bottom right (for 15m - 1h - 2h - 1D timeframes). You can select the number of cycles to observe and the asset type to apply them to:
Index: Standard quotes (e.g., Cash sessions).
Future: Extended quotes (24h).
50-200: Classic institutional references for the medium-long term.
ATR-based Dynamic Cyclic Channels The channels represent a lower cycle and its upper counterpart; their width is determined by the observed timeframe and calculated based on average volatility (ATR). Volatility is not treated as noise but as a structural component of the cycle, essential for contextualizing excesses, compressions, and expansions.
Info Table and Quick Guide Dynamic tables automatically link SMAs, timeframes, and time cycles, providing an immediate reading of the current cyclic context.
Time Bands (Weekly / Daily) Temporal visualization helps identify cyclic pivots and rhythm transitions.
🔹 ECA 2 – Market Excesses, Strength, and Energy
ECA 2 analyzes how the market moves within the cyclic structure.
Excesses and Divergences (Cyclic Stochastic) An oscillator calibrated on the same cyclic ratio as the suite. Crossovers between the lower cycle (blue) and upper cycle (red) signal potential phase changes. In areas of excess, divergences often confirm the closing and restart of a cycle.
Directional Movement System (DMS) The ADX measures the strength of the movement, while +DI and -DI indicate direction. A simultaneous crossover of ADX, +DI, and -DI signals imminent acceleration, even before the strength is fully expressed.
Market Pulse – Real Market Energy The Market Pulse measures the amount of real energy moving through the market by relating three factors:
Price Velocity
Normalized Volume
Volatility (ATR relative to price)
These three factors are combined multiplicatively: if one is missing, the impulse weakens. The zero line represents a state of energy equilibrium; values above or below indicate a real imbalance (bullish or bearish). Note: Market Pulse is not a classic oscillator and should not be interpreted as overbought or oversold; it is used to evaluate the energetic quality of a movement.
Operational Convergence
The maximum operational effectiveness of the ECA suite is achieved when all modules converge on the same market phase.
When cyclic timing, volatility, price structure, trend strength, and movement energy align, the context signals a high-probability operational phase. The system is applicable to any timeframe or asset because it is not bound by dogmatic or subjective interpretations of technical or fundamental analysis; instead, it leverages what is actually happening in the market. Major chart patterns and Volume Profile (technically not includable in this specific suite) provide further confirmation.
Under these conditions, the signal does not originate from a single indicator but from the consistency of the entire system: time, volatility, and energy moving in the same direction.
Entries should always be accompanied by proper risk management.
––––––––––––––––––––––––––––––––––––––––––––––––––––––––––––––––––––––––
Clock&Flow – Elements of Cycle Analysis (ECA) | Suite Completa
Elements of Cycle Analysis (ECA) è una suite avanzata di analisi ciclica progettata per leggere il mercato attraverso tempo, struttura, forza ed energia, combinando cicli, volatilità e partecipazione in un unico framework operativo.
La suite è composta da due moduli complementari:
🔹 ECA 1 – Cicli, Struttura e Volatilità (overlay true)
ECA 1 è dedicato all’analisi strutturale e temporale del mercato.
SMA cicliche (ratio ciclica)
Le medie mobili sono calibrate in funzione dei cicli nominali e del timeframe per monitorare più cicli simultaneamente (dal ciclo inferiore fino ai cicli superiori).
Gli incroci tra SMA veloci e lente certificano la chiusura o transizione del ciclo correlato alla SMA più veloce. Il ciclo in questione è segnalato nella info table in basso a destra (per i time frame 15’ - 1h - 2h - 1D) Puoi selezionare il numero dei cicli da osservare e su quali asset applicarle (Index = quotazioni standard / Future = quotazioni estese / 50-200 i classici riferimenti istituzionali per il medio-lungo periodo
Canali ciclici dinamici basati su ATR
I canali rappresentano un ciclo inferiore e il suo superiore, l’ampiezza è data dal time frame osservato e calcolata sulla volatilità media (ATR).
La volatilità non è trattata come rumore, ma come componente strutturale del ciclo, utile per contestualizzare eccessi, compressioni ed espansioni.
Info Table e Quick Guide
Tabelle dinamiche collegano automaticamente SMA, timeframe e cicli temporali, fornendo una lettura immediata del contesto ciclico in corso.
Time Bands (Weekly / Daily)
La visualizzazione temporale aiuta a individuare pivot ciclici e transizioni di ritmo.
––––––––––––––––––––––––––––––––––––––––––––––––––––––––––––––––––––––
🔹 ECA 2 – Eccessi, Forza ed Energia del Mercato
ECA 2 analizza come il mercato si muove all’interno della struttura ciclica.
Eccessi e divergenze (Stochastic ciclico)
Oscillatore calibrato sulla stessa ratio ciclica della suite.
Gli incroci tra ciclo inferiore (blu) e superiore (rosso) segnalano potenziali cambi di fase; in area di eccesso, le divergenze certificano spesso la chiusura e ripartenza del ciclo.
Directional Movement System (DMS)
L’ADX misura la forza del movimento, mentre +DI e –DI ne indicano la direzione.
L’incrocio simultaneo di ADX, +DI e –DI segnala un’accelerazione imminente, anche in assenza di forza già espressa.
Market Pulse – Energia reale del mercato
Il Market Pulse misura quanta energia reale sta attraversando il mercato mettendo in relazione:
velocità del prezzo
volume normalizzato
volatilità (ATR rapportato al prezzo)
I tre fattori sono combinati in modo moltiplicativo: se uno manca, l’impulso si indebolisce.
La linea dello zero rappresenta una condizione di equilibrio energetico; valori sopra o sotto indicano uno sbilanciamento reale, rialzista o ribassista.
Il Market Pulse non è un oscillatore classico e non va interpretato in termini di ipercomprato o ipervenduto: serve a valutare la qualità energetica del movimento.
La massima efficacia operativa della suite ECA si ottiene quando tutti i moduli convergono sulla stessa fase di mercato.
Quando tempi ciclici, volatilità, struttura del prezzo, forza del trend ed energia del movimento risultano allineati, il contesto segnala una fase ad alta probabilità operativa.
È applicabile su qualunque time frame o asset perché non è vincolato a dogmatiche e soggettive interpretazioni di analisi tecnica - fondamentale ma sfrutta ciò che realmente sta accadendo sul mercato.
I principali pattern grafici e il Volume Profile (in questa suite tecnicamente non inseribili) forniscono ulteriori conferme e/o indicazioni.
In queste condizioni il segnale non nasce da un singolo indicatore, ma dalla coerenza dell’intero sistema: tempo, volatilità ed energia si muovono nella stessa direzione.
Gli ingressi vanno sempre accompagnati da una corretta gestione del rischio.

Clock&Flow: Elements of Cycle Analysis 1st partClock&Flow – Elements of Cycle Analysis (ECA) | Complete Suite
Elements of Cycle Analysis (ECA) is an advanced cyclic analysis suite designed to interpret the market through time, structure, strength, and energy, combining cycles, volatility, and participation into a single operational framework.
The suite consists of two complementary modules:
🔹 ECA 1 – Cycles, Structure, and Volatility (Overlay: True)
ECA 1 is dedicated to the structural and temporal analysis of the market.
Cyclic SMAs (Cyclic Ratio) Moving averages are calibrated according to nominal cycles and timeframes to monitor multiple cycles simultaneously (from the lower cycle to the upper cycles). Crossovers between fast and slow SMAs certify the closing or transition of the cycle related to the faster SMA. The specific cycle is identified in the Info Table at the bottom right (for 15m - 1h - 2h - 1D timeframes). You can select the number of cycles to observe and the asset type to apply them to:
Index: Standard quotes (e.g., Cash sessions).
Future: Extended quotes (24h).
50-200: Classic institutional references for the medium-long term.
ATR-based Dynamic Cyclic Channels The channels represent a lower cycle and its upper counterpart; their width is determined by the observed timeframe and calculated based on average volatility (ATR). Volatility is not treated as noise but as a structural component of the cycle, essential for contextualizing excesses, compressions, and expansions.
Info Table and Quick Guide Dynamic tables automatically link SMAs, timeframes, and time cycles, providing an immediate reading of the current cyclic context.
Time Bands (Weekly / Daily) Temporal visualization helps identify cyclic pivots and rhythm transitions.
🔹 ECA 2 – Market Excesses, Strength, and Energy
ECA 2 analyzes how the market moves within the cyclic structure.
Excesses and Divergences (Cyclic Stochastic) An oscillator calibrated on the same cyclic ratio as the suite. Crossovers between the lower cycle (blue) and upper cycle (red) signal potential phase changes. In areas of excess, divergences often confirm the closing and restart of a cycle.
Directional Movement System (DMS) The ADX measures the strength of the movement, while +DI and -DI indicate direction. A simultaneous crossover of ADX, +DI, and -DI signals imminent acceleration, even before the strength is fully expressed.
Market Pulse – Real Market Energy The Market Pulse measures the amount of real energy moving through the market by relating three factors:
Price Velocity
Normalized Volume
Volatility (ATR relative to price)
These three factors are combined multiplicatively: if one is missing, the impulse weakens. The zero line represents a state of energy equilibrium; values above or below indicate a real imbalance (bullish or bearish). Note: Market Pulse is not a classic oscillator and should not be interpreted as overbought or oversold; it is used to evaluate the energetic quality of a movement.
Operational Convergence
The maximum operational effectiveness of the ECA suite is achieved when all modules converge on the same market phase.
When cyclic timing, volatility, price structure, trend strength, and movement energy align, the context signals a high-probability operational phase. The system is applicable to any timeframe or asset because it is not bound by dogmatic or subjective interpretations of technical or fundamental analysis; instead, it leverages what is actually happening in the market. Major chart patterns and Volume Profile (technically not includable in this specific suite) provide further confirmation.
Under these conditions, the signal does not originate from a single indicator but from the consistency of the entire system: time, volatility, and energy moving in the same direction.
Entries should always be accompanied by proper risk management.
––––––––––––––––––––––––––––––––––––––––––––––––––––––––––––––––––––––––
Clock&Flow – Elements of Cycle Analysis (ECA) | Suite Completa
Elements of Cycle Analysis (ECA) è una suite avanzata di analisi ciclica progettata per leggere il mercato attraverso tempo, struttura, forza ed energia, combinando cicli, volatilità e partecipazione in un unico framework operativo.
La suite è composta da due moduli complementari:
🔹 ECA 1 – Cicli, Struttura e Volatilità (overlay true)
ECA 1 è dedicato all’analisi strutturale e temporale del mercato.
SMA cicliche (ratio ciclica)
Le medie mobili sono calibrate in funzione dei cicli nominali e del timeframe per monitorare più cicli simultaneamente (dal ciclo inferiore fino ai cicli superiori).
Gli incroci tra SMA veloci e lente certificano la chiusura o transizione del ciclo correlato alla SMA più veloce. Il ciclo in questione è segnalato nella info table in basso a destra (per i time frame 15’ - 1h - 2h - 1D) Puoi selezionare il numero dei cicli da osservare e su quali asset applicarle (Index = quotazioni standard / Future = quotazioni estese / 50-200 i classici riferimenti istituzionali per il medio-lungo periodo
Canali ciclici dinamici basati su ATR
I canali rappresentano un ciclo inferiore e il suo superiore, l’ampiezza è data dal time frame osservato e calcolata sulla volatilità media (ATR).
La volatilità non è trattata come rumore, ma come componente strutturale del ciclo, utile per contestualizzare eccessi, compressioni ed espansioni.
Info Table e Quick Guide
Tabelle dinamiche collegano automaticamente SMA, timeframe e cicli temporali, fornendo una lettura immediata del contesto ciclico in corso.
Time Bands (Weekly / Daily)
La visualizzazione temporale aiuta a individuare pivot ciclici e transizioni di ritmo.
––––––––––––––––––––––––––––––––––––––––––––––––––––––––––––––––––––––
🔹 ECA 2 – Eccessi, Forza ed Energia del Mercato
ECA 2 analizza come il mercato si muove all’interno della struttura ciclica.
Eccessi e divergenze (Stochastic ciclico)
Oscillatore calibrato sulla stessa ratio ciclica della suite.
Gli incroci tra ciclo inferiore (blu) e superiore (rosso) segnalano potenziali cambi di fase; in area di eccesso, le divergenze certificano spesso la chiusura e ripartenza del ciclo.
Directional Movement System (DMS)
L’ADX misura la forza del movimento, mentre +DI e –DI ne indicano la direzione.
L’incrocio simultaneo di ADX, +DI e –DI segnala un’accelerazione imminente, anche in assenza di forza già espressa.
Market Pulse – Energia reale del mercato
Il Market Pulse misura quanta energia reale sta attraversando il mercato mettendo in relazione:
velocità del prezzo
volume normalizzato
volatilità (ATR rapportato al prezzo)
I tre fattori sono combinati in modo moltiplicativo: se uno manca, l’impulso si indebolisce.
La linea dello zero rappresenta una condizione di equilibrio energetico; valori sopra o sotto indicano uno sbilanciamento reale, rialzista o ribassista.
Il Market Pulse non è un oscillatore classico e non va interpretato in termini di ipercomprato o ipervenduto: serve a valutare la qualità energetica del movimento.
La massima efficacia operativa della suite ECA si ottiene quando tutti i moduli convergono sulla stessa fase di mercato.
Quando tempi ciclici, volatilità, struttura del prezzo, forza del trend ed energia del movimento risultano allineati, il contesto segnala una fase ad alta probabilità operativa.
È applicabile su qualunque time frame o asset perché non è vincolato a dogmatiche e soggettive interpretazioni di analisi tecnica - fondamentale ma sfrutta ciò che realmente sta accadendo sul mercato.
I principali pattern grafici e il Volume Profile (in questa suite tecnicamente non inseribili) forniscono ulteriori conferme e/o indicazioni.
In queste condizioni il segnale non nasce da un singolo indicatore, ma dalla coerenza dell’intero sistema: tempo, volatilità ed energia si muovono nella stessa direzione.
Gli ingressi vanno sempre accompagnati da una corretta gestione del rischio.

WN 5-20-50 SMA Setup (Discrete Lines = SL TP) Multiple Entries Pretty Simple Script as I got this idea from a YouTuber that showed us how to use AI to make TradingView Indicators.
When the 5 day Simple Moving Average Goes Above the 20 day Simple Moving Average it issues a BUY Signal when the Trend itself is over the 50 day Simple Moving Average.
When the 5 day Simple Moving Average Goes Below the 20 day Simple Moving Average it issues a SELL Signal when the Trend itself is under the 50 day Simple Moving Average.
The Green Cloud Represents price over the 50 day Simple Moving Average. BUY signals will only show up in the green cloud.
The Red Cloud Represents price under the 50 day Simple Moving Average. SELL signals will only show up in the green cloud.
The lines represent Stop Loss and two Take Profit Levels. Take Profit 1 is 1.5x the stop loss and Take Profit 2 is 3x the Stop Loss.
This version of the Script has multiple Trend signals for entries so you can scale into a trade when the Trend is being aggressive.

Multi-Fractal Trading Plan [Gemini] v22Multi-Fractal Trading Plan
The Multi-Fractal Trading Plan is a quantitative market structure engine designed to filter noise and generate actionable daily strategies. Unlike standard auto-trendline indicators that clutter charts with irrelevant data, this system utilizes Fractal Geometry to categorize market liquidity into three institutional layers: Minor (Intraday), Medium (Swing), and Major (Institutional).
This tool functions as a Strategic Advisor, not just a drawing tool. It calculates the delta between price and structural pivots in real-time, alerting you when price enters high-probability "Hot Zones" and generating a live trading plan on your dashboard.
Core Features
1. Three-Tier Fractal Engine The algorithm tracks 15 distinct fractal lengths simultaneously, aggregating them into a clean hierarchy:
Minor Structure (Thin Lines): Captures high-frequency volatility for scalping.
Medium Structure (Medium Lines): Identifies significant swing points and intermediate targets.
Major Structure (Thick Lines): Maps the "Institutional" defense lines where trend reversals and major breakouts occur.
2. The Strategic Dashboard A dynamic data panel in the bottom-right eliminates analysis paralysis:
Floor & Ceiling Targets: Displays the precise price levels of the nearest Support and Resistance.
AI Logic Output: The script analyzes market conditions to generate a specific command, such as "WATCH FOR BREAKOUT", "Near Lows (Look Long?)", or "WAIT (No Setup)".
3. "Hot Zone" Detection Never miss a critical test of structure.
Dynamic Alerting: When price trades within 1% (adjustable) of a Major Trend Line, the indicator’s labels turn Bright Yellow and flash a warning (e.g., "⚠️ WATCH: MAJOR RES").
Focus: This visual cue highlights the exact moment execution is required, reducing screen fatigue.
4. The Quant Web & Markers
Pivot Validation: Deep blue fractal markers (▲/▼) identify the exact candles responsible for the structure.
Inter-Timeframe Web: Faint dotted lines connect Minor pivots directly to Major pivots, visualizing the "hidden" elasticity between short-term noise and long-term trend anchors.
5. Enterprise Stability Engine Engineered to solve the "Vertical Line" and "1970 Epoch" glitches common in Pine Script trend indicators. This engine is optimized for Futures (NQ/ES), Forex, and Crypto, ensuring stability across all timeframes (including gaps on ETH/RTH charts).
Operational Guide
Consult the Dashboard: Before executing, check the "Strategy" output. If it says "WAIT", the market is in chop. If it says "WATCH FOR BOUNCE", prepare your entry criteria.
Monitor Hot Zones: A Yellow Label indicates price is testing a major liquidity level. This is your signal to watch for a rejection wick or a high-volume breakout.
Utilize the Web: Use the faint web lines to find "confluence" where a short-term pullback aligns with a long-term trend line.
Configuration
Show History: Toggles "Ghost Lines" (Blue) to display historical structure and broken trends.
Fractal Points: Toggles the geometric pivot markers.
Hot Zone %: Adjusts the sensitivity of the Yellow Warning system (Default: 1%).
Max Line Length: A noise filter that removes stale or "spiderweb" lines that are no longer statistically relevant.

OCC Strategy Optimized (MA 5 + Delayed TSL)# OCC Strategy Optimized (MA 5 + Delayed TSL) - User Guide
## Introduction
The **OCC Strategy Optimized** is an enhanced version of the classic **Open Close Cross (OCC)** strategy. This strategy is designed for high-precision trend following, utilizing the crossover logic of Open and Close moving averages to identify market shifts. This optimized version incorporates advanced risk management, multi-timeframe analysis, and a variety of moving average types to provide a robust trading solution for modern markets.
>
> **Special Thanks:** This strategy is based on the original work of **JustUncleL**, a renowned Pine Script developer. You can find their work and profile on TradingView here: (in.tradingview.com).
---
## Key Features
### 1. Optimized Core Logic
- **MA Period (Default: 5):** The strategy is tuned with a shorter MA length to reduce lag and capture trends earlier.
- **Crossing Logic:** Signals are generated when the Moving Average of the **Close** crosses the Moving Average of the **Open**.
### 2. Multi-Timeframe (MTF) Analysis
- **Alternate Resolution:** Use a higher timeframe (Resolution Multiplier) to filter out noise. By default, it uses $3 \times$ your current chart timeframe to confirm the trend.
- **Non-Repainting:** Includes an optional delay offset to ensure signals are confirmed and do not disappear (repaint) after the bar closes.
### 3. Advanced Risk Management
This script features a hierarchical exit system to protect your capital and lock in profits:
- **Fixed Stop Loss (Initial):** Protects against sudden market reversals immediately after entry.
- **Delayed Trailing Stop Loss (TSL):**
- **Activation Delay:** The TSL only activates after the trade reaches a specific profit threshold (e.g., 1%). This prevents being stopped out too early in the trade's development.
- **Ratchet Trail:** Once activated, the stop loss "ratchets" up/down, never moving backward, ensuring you lock in profits as the trend continues.
- **Take Profit (TP):** A fixed percentage target to exit the trade at a pre-defined profit level.
### 4. Versatility
- **12 MA Types:** Choose from SMA, EMA, DEMA, TEMA, WMA, VWMA, SMMA, HullMA, LSMA, ALMA, SSMA, and TMA.
- **Trade Direction:** Toggle between Long-only, Short-only, or Both.
- **Visuals:** Optional bar coloring to visualize the trend directly on the candlesticks.
---
## User Input Guide
### Core Settings
- **Use Alternate Resolution?:** Enable this to use the MTF logic.
- **Multiplier for Alternate Resolution:** How many charts higher the "filter" timeframe should be.
- **MA Type:** Select your preferred moving average smoothing method.
- **MA Period:** The length of the Open/Close averages.
- **Delay Open/Close MA:** Use `1` or higher to force non-repainting behavior.
### Risk Management Settings
- **Use Trailing Stop Loss?:** Enables the TSL system.
- **Trailing Stop %:** The distance the stop follows behind the price (Optimized Default: 1.5%).
- **TSL Activation % (Delay):** The profit % required before the TSL starts moving. (Optimized Default: 2.0% to ensure 0.5% profit is locked immediately).
- **Initial Fixed Stop Loss %:** Your hard stop if the trade immediately goes against you.
- **Take Profit %:** Your ultimate profit target for the trade.
---
## How to Trade with This Strategy
1. **Identify the Trend:** Look for the Moving Average lines (Close vs Open) to cross.
2. **Wait for Confirmation:** If using MTF, ensure the higher timeframe also shows a trend change.
3. **Manage the Trade:** Let the TSL work. With the default **2.0% Activation** and **1.5% Trail**, the strategy will automatically lock in **0.5% profit** the moment the threshold is hit, then follow the price higher.
4. **Position Sizing:** Adjust the `Properties` tab in the script settings to match your desired capital allocation (Default is 10% of equity).
---
## Recommended Settings
1. Trialing < Activation
2. Check ranging
## Credits
Original Strategy by: **JustUncleL**
Optimized and Enhanced by: **Antigravity AI**

GODMODE V2.3 ULTIMATE══════════════════════════════════════════════════════════════
⚡ GODMODE V2.3 ULTIMATE ⚡
══════════════════════════════════════════════════════════════
Institutional-grade precision. Unmatched power.
The most advanced trading system ever built.
══════════════════════════════════════════════════════════════
█░█ █░░ ▀█▀ █ █▀▄▀█ ▄▀█ ▀█▀ █▀▀
█▄█ █▄▄ ░█░ █ █░▀░█ █▀█ ░█░ ██▄
────────────────────────────────
⚡ SMART MONEY CONCEPTS (SMC)
────────────────────────────────
✦ Order Block Detection
Auto-identifies bullish & bearish order blocks
Institutional buying/selling zones revealed
✦ Fair Value Gaps (FVG)
Automatically plots imbalance zones
High-probability reversal areas highlighted
✦ Break of Structure (BOS)
Real-time structure break detection
Trend continuation confirmation
✦ Change of Character (CHoCH)
Trend reversal early warning system
Catch reversals before they happen
✦ Liquidity Levels
Equal Highs/Lows detection (EQH/EQL)
Know where liquidity pools form
✦ Premium/Discount Zones
Daily range equilibrium plotted
Buy in discount, sell in premium
────────────────────────────────
📊 MULTI-TIMEFRAME ANALYSIS
────────────────────────────────
✦ 4-Timeframe Trend Dashboard
Current TF + 3 higher timeframes
Instant trend alignment visibility
✦ MTF Confluence Scoring
Signals only fire when timeframes align
Dramatically reduces false signals
✦ MTF Filter Toggle
Enable/disable for different strategies
Full control over signal filtering
✦ Custom Timeframe Selection
Choose your own MTF combination
Adapt to any trading style
────────────────────────────────
🎯 ADVANCED SIGNAL ENGINE
────────────────────────────────
✦ Multi-Confluence Buy/Sell Signals
5+ conditions must align to trigger
Institutional-quality entries
✦ RSI Confluence Filter
Eliminates overbought/oversold traps
Adjustable thresholds
✦ Volume Confirmation Filter
Validates signals with volume spikes
Customizable sensitivity
✦ MTF Trend Filter
Only trades with higher TF trend
Dramatically improves win rate
✦ Session Filter
Optional: Only signal during active hours
Avoid low-liquidity traps
✦ Signal Strength Score (0-100%)
Know exactly how strong each setup is
10+ factors calculated in real-time
✦ Anti-Repaint Mode
Signals only confirm on bar close
What you see is what you get
────────────────────────────────
🔮 PREDICTION SYSTEM
────────────────────────────────
✦ AI-Powered Prediction Line
Linear regression projection
Glowing trajectory visualization
✦ Dynamic Target Calculation
Updates with every tick
Adapts to volatility
✦ Directional Confidence
Bullish/Bearish/Neutral status
Clear actionable signals
────────────────────────────────
💰 MULTI-TARGET SYSTEM
────────────────────────────────
✦ TP1 / TP2 / TP3 Zones
Three take-profit levels
Scale out for maximum profit
✦ ATR-Based Calculations
Volatility-adjusted targets
Works on any market/timeframe
✦ Holographic Zone Display
Glowing TP/SL bands
Visually stunning presentation
✦ Customizable Multipliers
Set your own R:R preferences
Full control over risk
────────────────────────────────
🧮 POSITION SIZE CALCULATOR
────────────────────────────────
✦ Account Size Input
Enter your account balance
✦ Risk Percentage Setting
Define risk per trade (0.1-10%)
✦ Auto Position Sizing
Calculates exact position size
Based on SL distance
✦ Risk Amount Display
Shows dollar amount at risk
No more manual calculations
────────────────────────────────
📈 PERFORMANCE STATISTICS
────────────────────────────────
✦ Live Win Rate Tracker
Real-time accuracy percentage
Based on TP/SL hits
✦ Total Signals Counter
Track signal frequency
✦ Wins/Losses Display
Running W/L tally
✦ Current Streak
Track hot/cold streaks
Positive and negative
✦ Average R:R
Overall risk-reward performance
Measure your edge
────────────────────────────────
📊 KEY LEVELS
────────────────────────────────
✦ Previous Day High/Low (PDH/PDL)
Critical institutional levels
✦ Previous Week High/Low (PWH/PWL)
Swing trading reference points
✦ VWAP (Volume Weighted Average)
Institutional benchmark price
✦ Equilibrium Line
Daily range midpoint
Premium/Discount reference
────────────────────────────────
⏰ SESSIONS & KILLZONES
────────────────────────────────
✦ 4 Major Sessions
London • New York • Tokyo • Sydney
Color-coded backgrounds
✦ Killzone Highlighting
High-probability trading windows
London/NY overlap emphasized
✦ Session Dashboard Display
Current session shown in panel
Never miss prime trading hours
✦ Customizable Times
Adjust session hours to your zone
Full UTC time control
────────────────────────────────
🎨 5 PREMIUM COLOR THEMES
────────────────────────────────
✦ NEON (Default)
Cyan & Purple
Electric, vibrant aesthetic
✦ STEALTH
Grayscale tones
Minimal, professional look
✦ OCEAN
Blue spectrum
Cool, calming visuals
✦ SUNSET
Orange & Pink
Warm, energetic feel
✦ MATRIX
Green monochrome
Hacker aesthetic
────────────────────────────────
⚙️ 3 TRADING MODES
────────────────────────────────
✦ SCALP MODE
Fast MAs (9/21)
1m - 15m timeframes
Quick entries & exits
✦ SWING MODE
Balanced MAs (50/100)
1H - 4H timeframes
Ride the trends
✦ POSITION MODE
Slow MAs (100/200)
Daily+ timeframes
Long-term holds
────────────────────────────────
🎚️ 3 SIGNAL STYLES
────────────────────────────────
✦ AGGRESSIVE
More signals, faster triggers
For active traders
✦ BALANCED (Default)
Optimal signal frequency
Best risk/reward balance
✦ CONSERVATIVE
Fewer signals, higher quality
For patient traders
────────────────────────────────
💎 PREMIUM VISUALS
────────────────────────────────
✦ Neon Glow Moving Averages
Multi-layer glowing effect
Stunning trend visualization
✦ Breathing Gradient Ribbon
Opacity pulses with trend strength
Alive, dynamic display
✦ Trend Zone Background
Subtle chart tinting
Instant trend recognition
✦ Signal Burst Effects
Expanding rings on signals
Satisfying visual feedback
✦ Price Comet Trail
Fading dots follow price
Elegant motion effect
✦ Trend-Colored Candles
Candles match trend direction
Immersive chart experience
✦ Stealth Mode
Hide all visuals instantly
Clean chart when needed
────────────────────────────────
📱 TRIPLE DASHBOARD SYSTEM
────────────────────────────────
✦ MAIN DASHBOARD
12-row comprehensive panel
Trend, Power, RSI, Volume
Momentum, Session, Zone
Structure, Signal, Target
✦ MTF PANEL
4-timeframe trend arrows
Instant confluence check
✦ STATS PANEL
Win rate, W/L, Streak
Average R:R tracking
────────────────────────────────
🔔 ADVANCED ALERTS
────────────────────────────────
✦ Buy Signal Alert
✦ Sell Signal Alert
✦ Strong Buy (80%+ Power)
✦ Strong Sell (80%+ Power)
✦ BOS Bullish Alert
✦ BOS Bearish Alert
✦ CHoCH Bullish Alert
✦ CHoCH Bearish Alert
✦ Killzone Signal Alert
✦ MTF Confluence Alert
All alerts webhook-ready.
Compatible with trading bots.
────────────────────────────────
🛡️ SAFETY FEATURES
────────────────────────────────
✦ Anti-Repaint Mode
Signals confirm on bar close only
Guaranteed accuracy
✦ Stealth Mode
Instant minimal UI toggle
Clean charts when needed
✦ Customizable Everything
Every feature can be toggled
Make it yours
────────────────────────────────
🎬 ACTIVATION EXPERIENCE
────────────────────────────────
✦ Cinematic Startup Animation
"GODMODE V2.3 ULTIMATE ACTIVATED"
Pulsing gold & cyan text
✦ Mode & Theme Display
Shows your configuration
Premium onboarding experience
✦ Watermark Branding
Subtle bottom-left signature
Professional appearance
══════════════════════════════════════════════════════════════
█░█░█ █▀█ █▀█ █▄▀ █▀ █▀█ █▄░█
▀▄▀▄▀ █▄█ █▀▄ █░█ ▄█ █▄█ █░▀█
✓ All Markets (Forex, Crypto, Stocks, Futures, Indices)
✓ All Timeframes (1m to Monthly)
✓ TradingView Desktop & Mobile
✓ Works on Free & Paid TV accounts
══════════════════════════════════════════════════════════════
█▀▀ █▀█ █▀▄▀█ █▀█ ▄▀█ █▀█ █ █▀ █▀█ █▄░█
█▄▄ █▄█ █░▀░█ █▀▀ █▀█ █▀▄ █ ▄█ █▄█ █░▀█
┌─────────────────────────────────────────────────────────────┐
│ FEATURE │ PRO $50 │ ULTIMATE $99 │
├─────────────────────────────────────────────────────────────┤
│ Neon Glow Visuals │ ✓ │ ✓ │
│ Breathing Ribbon │ ✓ │ ✓ │
│ Signal Bursts │ ✓ │ ✓ │
│ Buy/Sell Signals │ ✓ │ ✓ │
│ RSI + Volume Filters │ ✓ │ ✓ │
│ TP/SL Zones │ Single │ TP1/TP2/TP3 │
│ Sessions │ Basic │ + Killzones │
│ Key Levels │ PDH/PDL │ + PWH/PWL │
│ Dashboard │ Standard │ Triple │
│ Modes │ 2 │ 3 │
│ Signal Styles │ — │ 3 │
│ Color Themes │ 1 │ 5 │
│ Smart Money (SMC) │ ✗ │ ✓ │
│ Order Blocks │ ✗ │ ✓ │
│ Fair Value Gaps │ ✗ │ ✓ │
│ BOS / CHoCH │ ✗ │ ✓ │
│ Liquidity Levels │ ✗ │ ✓ │
│ Premium/Discount │ ✗ │ ✓ │
│ Multi-Timeframe Analysis │ ✗ │ 4 TFs │
│ MTF Confluence Filter │ ✗ │ ✓ │
│ Position Size Calculator │ ✗ │ ✓ │
│ Performance Stats │ ✗ │ ✓ │
│ Win Rate Tracking │ ✗ │ ✓ │
│ VWAP │ ✗ │ ✓ │
│ Anti-Repaint Mode │ ✗ │ ✓ │
│ Stealth Mode │ ✗ │ ✓ │
│ MTF Panel │ ✗ │ ✓ │
│ Stats Panel │ ✗ │ ✓ │
│ Advanced Alerts │ 5 │ 10 │
│ Lifetime Updates │ ✗ │ ✓ │
│ Priority Support │ ✗ │ ✓ │
└─────────────────────────────────────────────────────────────┘
══════════════════════════════════════════════════════════════
█░█░█ █░█ ▄▀█ ▀█▀ █▄█ █▀█ █░█ █▀▀ █▀▀ ▀█▀
▀▄▀▄▀ █▀█ █▀█ ░█░ ░█░ █▄█ █▄█ █▄█ ██▄ ░█░
⚡ Lifetime access to GODMODE V2.3 ULTIMATE
⚡ All current features unlocked
⚡ All future updates FREE forever
⚡ Works on unlimited charts/symbols
⚡ Full customization control
⚡ Priority support via DM
⚡ Private Discord community access
⚡ Early access to V3.0
══════════════════════════════════════════════════════════════
█▀▀ ▄▀█ █▀█
█▀░ █▀█ ▀▀█
Q: Does this repaint?
A: No. Anti-Repaint Mode confirms signals on bar close only.
Q: What markets does this work on?
A: All markets — Forex, Crypto, Stocks, Futures, Indices, Commodities.
Q: What timeframe is best?
A: Scalp Mode for 1m-15m. Swing Mode for 1H-4H. Position Mode for Daily+.
Q: What are Smart Money Concepts?
A: Institutional trading strategies — Order Blocks, FVGs, BOS, CHoCH, Liquidity.
Q: How does MTF filtering work?
A: Signals only fire when your current timeframe aligns with 2+ higher timeframes.
Q: Can I customize everything?
A: Yes. Every visual, filter, level, and setting can be toggled and adjusted.
Q: Do I get future updates?
A: Yes. Lifetime updates included. V3.0 early access for ULTIMATE users.
Q: How do I get access?
A: After purchase, DM your TradingView username. Access granted within 24 hours.
Q: Is there a refund policy?
A: Due to digital nature, all sales are final. Test the PRO version first if unsure.
══════════════════════════════════════════════════════════════
▀█▀ █▀▀ █▀ ▀█▀ █ █▀▄▀█ █▀█ █▄░█ █ ▄▀█ █░░ █▀
░█░ ██▄ ▄█ ░█░ █ █░▀░█ █▄█ █░▀█ █ █▀█ █▄▄ ▄█
"Finally an indicator that actually looks as good as it performs.
The SMC features alone are worth $99."
"MTF confluence filter changed my trading. Win rate went from
45% to 67% in two weeks."
"Best purchase I've made for my trading. The dashboard tells
me everything I need at a glance."
══════════════════════════════════════════════════════════════
⚡ GODMODE V2.3 ULTIMATE — $99 ⚡
Lifetime access. Unlimited power.
Trade like an institution.
══════════════════════════════════════════════════════════════

GODMODE V2.3══════════════════════════════════════════════════════════════
⚡ GODMODE V2.3 PRO ⚡
══════════════════════════════════════════════════════════════
The most visually stunning & powerful trading indicator you'll ever use.
Stop guessing. Start trading with confidence.
══════════════════════════════════════════════════════════════
█▀▀ █▀▀ ▄▀█ ▀█▀ █░█ █▀█ █▀▀ █▀
█▀░ ██▄ █▀█ ░█░ █▄█ █▀▄ ██▄ ▄█
────────────────────────────────
🎯 SMART SIGNAL ENGINE
────────────────────────────────
✦ Multi-Confluence Buy/Sell Signals
Signals only fire when multiple conditions align
✦ RSI Confluence Filter
Eliminates overbought/oversold false signals
✦ Volume Confirmation
Validates signals with volume spikes
✦ Signal Strength Score (0-100%)
Know exactly how strong each setup is
✦ Momentum Detection
Confirms trend direction before entry
────────────────────────────────
🔮 PREDICTION SYSTEM
────────────────────────────────
✦ AI-Powered Prediction Line
Projects price direction with glowing trajectory
✦ Dynamic Target Calculation
Auto-updates with every tick
✦ Confidence Indicators
Visual cues for prediction strength
────────────────────────────────
💎 PREMIUM VISUALS
────────────────────────────────
✦ Neon Glow Moving Averages
5-layer glowing MAs that pulse with the trend
✦ Breathing Gradient Ribbon
Ribbon opacity intensifies with trend strength
✦ Trend Zone Highlighting
Background subtly tints with market direction
✦ Signal Burst Effects
Expanding rings on every buy/sell signal
✦ Price Comet Trail
Fading dots follow price like a shooting star
✦ Trend-Colored Candles
Candles change color based on trend direction
✦ GODMODE Activation Animation
Cinematic startup sequence when loaded
────────────────────────────────
📊 STRUCTURE & LEVELS
────────────────────────────────
✦ Previous Day High/Low (PDH/PDL)
Key institutional levels auto-plotted
✦ Auto Support/Resistance Zones
Algorithm detects and highlights key S/R
✦ Session Highlighting
London • New York • Tokyo sessions marked
with distinct colors
────────────────────────────────
🛡️ RISK MANAGEMENT
────────────────────────────────
✦ Holographic TP/SL Zones
Glowing target and stop loss bands
✦ ATR-Based Calculations
Volatility-adjusted levels for any market
✦ Risk:Reward Display
See your R:R ratio before entering
✦ Customizable Multipliers
Adjust TP/SL to match your style
────────────────────────────────
📈 LIVE DASHBOARD
────────────────────────────────
✦ Real-Time Trend Status
BULLISH / BEARISH / NEUTRAL indicator
✦ Power Gauge
Visual strength meter with percentage
✦ RSI Gauge
Animated RSI bar with value
✦ Volume Status
SPIKE / NORMAL volume indicator
✦ Momentum Tracker
STRONG / RISING / FALLING / WEAK status
✦ Session Display
Shows current active trading session
✦ Signal Direction
LONG / SHORT / WAIT recommendation
✦ Target Price
Live predicted target level
────────────────────────────────
⚙️ TRADING MODES
────────────────────────────────
✦ SCALP MODE
Fast signals with 9/21 MAs
Perfect for 1m-15m timeframes
✦ SWING MODE
Filtered signals with 50/100 MAs
Ideal for 1H-Daily timeframes
────────────────────────────────
🔔 SMART ALERTS
────────────────────────────────
✦ Buy Signal Alert
✦ Sell Signal Alert
✦ High Power Alert (80%+ confluence)
✦ Strong Buy Alert (signal + high power)
✦ Strong Sell Alert (signal + high power)
All alerts include ticker & price.
Compatible with webhooks for automation.
────────────────────────────────
🎨 CUSTOMIZATION
────────────────────────────────
✦ MA Type Selection (EMA/SMA/VWMA)
✦ Adjustable MA Lengths
✦ RSI Threshold Controls
✦ Volume Sensitivity
✦ TP/SL Multipliers
✦ Prediction Range
✦ Toggle Any Visual On/Off
✦ Dashboard Position Selection
✦ Session Time Customization
══════════════════════════════════════════════════════════════
█░█░█ █▀█ █▀█ █▄▀ █▀ █▀█ █▄░█
▀▄▀▄▀ █▄█ █▀▄ █░█ ▄█ █▄█ █░▀█
✓ All Markets (Forex, Crypto, Stocks, Indices)
✓ All Timeframes (1m to Monthly)
✓ TradingView (Desktop & Mobile)
══════════════════════════════════════════════════════════════
█░█░█ █░█ ▄▀█ ▀█▀ ▀ █▀ █ █▄░█ █▀▀ █░░ █░█ █▀▄ █▀▀ █▀▄
▀▄▀▄▀ █▀█ █▀█ ░█░ ░ ▄█ █ █░▀█ █▄▄ █▄▄ █▄█ █▄▀ ██▄ █▄▀
✦ Lifetime access to GODMODE V2.3 PRO
✦ All future updates included
✦ Works on unlimited charts
✦ Full customization options
✦ Priority support via DM
══════════════════════════════════════════════════════════════
█▀▀ ▄▀█ █▀█
█▀░ █▀█ ▀▀█
Q: Does this repaint?
A: Signals are confirmed on bar close. No repainting.
Q: What markets does this work on?
A: All markets — Forex, Crypto, Stocks, Futures, Indices.
Q: What timeframe is best?
A: Scalp Mode for 1m-15m. Swing Mode for 1H+. Works on all.
Q: Do I get updates?
A: Yes, all future updates are included free.
Q: How do I get access?
A: After purchase, send me your TradingView username.
Access granted within 24 hours (usually faster).
══════════════════════════════════════════════════════════════
⚡ GODMODE V2.3 PRO — $50 ⚡
══════════════════════════════════════════════════════════════

Udta Teer MKCIts normal vwap which is already available in TradingView. Now we have modified it with help of AI for bands

Udta Teer Its normal vwap which is already available in tradingview. But it has added bands with help of AI

ML Adaptive SuperTrend Strategy [trade_crush]# ML Adaptive SuperTrend Strategy - User Guide
## Introduction
The **ML Adaptive SuperTrend Strategy** is a sophisticated trading tool that combines traditional trend-following logic with **Machine Learning (K-Means Clustering)** to dynamically adapt to market volatility. Unlike standard SuperTrend indicators that use a fixed ATR, this strategy analyzes historical volatility to categorize the current market into distinct clusters, providing more precise entries and exits.
>
> **Special Thanks:** This strategy is based on the innovative work of **AlgoAlpha**. You can explore their extensive library of high-quality indicators and strategies on TradingView: (www.tradingview.com).
---
## Machine Learning Engine (K-Means)
The core of this strategy is its ability to "learn" from recent market behavior.
- **K-Means Clustering**: The script takes the last $N$ bars of ATR data and runs an iterative clustering algorithm to find three "centroids" representing **High**, **Medium**, and **Low** volatility.
- **Adaptive ATR**: Based on the current volatility, the strategy selects the nearest centroid to use as the ATR value for the SuperTrend calculation. This ensures the trailing stop tightens during low volatility and widens during high volatility to avoid "noise".
---
## Key Features
### 1. Non-Repainting Signals
- **Confirm Signals**: When enabled, signals are only triggered after a bar closes. This ensures that the arrows and entries you see on the chart are permanent and reliable for backtesting.
### 2. Intelligent Risk Management
- **Multiple SL/TP Types**: Choose between **Percentage** based stops or **ATR** based stops for both Stop Loss and Take Profit.
- **Trailing Stop Loss (TSL)**:
- Supports both Percentage and ATR modes.
- **Activation Offset**: Only activates the trailing mechanism after the price has moved a certain percentage in your favor, protecting early-stage trades.
### 3. Risk-Based Position Sizing
- **Dynamic Quantity**: If enabled, the strategy automatically calculates the trade size based on your **Risk % Per Trade** and the distance to your **Stop Loss**. This ensures you never lose more than your defined risk on a single trade.
---
## User Input Guide
### SuperTrend & ML Settings
- **ATR Length**: The window used to calculate market volatility.
- **SuperTrend Factor**: The multiplier that determines the distance of the trailing stop from the price.
- **Use ML Adaptive ATR**: Toggle between the ML-enhanced logic and standard ATR.
- **Training Data Length**: How many historical bars the ML engine analyzes to find clusters.
### Risk Management
- **Stop Loss Type**: Set to Percentage, ATR, or None.
- **TS Activation Offset**: The profit buffer required before the trailing stop starts following the price.
- **Use Risk-Based Sizing**: Toggle this to let the script manage your position size automatically.
---
## How to Trade with This Strategy
1. **Monitor the Dashboard**: Check the top-right table to see which volatility cluster the market is currently in.
2. **Observe the Fills**: The adaptive fills (green/red) visualize the "breathing room" the strategy is giving the price.
3. **Execution**: The strategy enters on "ML Bullish" (Triangle Up) and "ML Bearish" (Triangle Down) signals.
4. **Exits**: The script will automatically exit based on your SL, TP, or Trailing Stop settings.
---
## Credits
Original Concept: **AlgoAlpha**
Strategy Conversion & Enhancements: **Antigravity AI**

Antigravity OCC Strategy (MA 5 + Delayed TSL)# OCC Strategy Optimized (MA 5 + Delayed TSL) - User Guide
## Introduction
The **OCC Strategy Optimized** is an enhanced version of the classic **Open Close Cross (OCC)** strategy. This strategy is designed for high-precision trend following, utilizing the crossover logic of Open and Close moving averages to identify market shifts. This optimized version incorporates advanced risk management, multi-timeframe analysis, and a variety of moving average types to provide a robust trading solution for modern markets.
>
> **Special Thanks:** This strategy is based on the original work of **JustUncleL**, a renowned Pine Script developer. You can find their work and profile on TradingView here: (in.tradingview.com).
---
## Key Features
### 1. Optimized Core Logic
- **MA Period (Default: 5):** The strategy is tuned with a shorter MA length to reduce lag and capture trends earlier.
- **Crossing Logic:** Signals are generated when the Moving Average of the **Close** crosses the Moving Average of the **Open**.
### 2. Multi-Timeframe (MTF) Analysis
- **Alternate Resolution:** Use a higher timeframe (Resolution Multiplier) to filter out noise. By default, it uses $3 \times$ your current chart timeframe to confirm the trend.
- **Non-Repainting:** Includes an optional delay offset to ensure signals are confirmed and do not disappear (repaint) after the bar closes.
### 3. Advanced Risk Management
This script features a hierarchical exit system to protect your capital and lock in profits:
- **Fixed Stop Loss (Initial):** Protects against sudden market reversals immediately after entry.
- **Delayed Trailing Stop Loss (TSL):**
- **Activation Delay:** The TSL only activates after the trade reaches a specific profit threshold (e.g., 1%). This prevents being stopped out too early in the trade's development.
- **Ratchet Trail:** Once activated, the stop loss "ratchets" up/down, never moving backward, ensuring you lock in profits as the trend continues.
- **Take Profit (TP):** A fixed percentage target to exit the trade at a pre-defined profit level.
### 4. Versatility
- **12 MA Types:** Choose from SMA, EMA, DEMA, TEMA, WMA, VWMA, SMMA, HullMA, LSMA, ALMA, SSMA, and TMA.
- **Trade Direction:** Toggle between Long-only, Short-only, or Both.
- **Visuals:** Optional bar coloring to visualize the trend directly on the candlesticks.
---
## User Input Guide
### Core Settings
- **Use Alternate Resolution?:** Enable this to use the MTF logic.
- **Multiplier for Alternate Resolution:** How many charts higher the "filter" timeframe should be.
- **MA Type:** Select your preferred moving average smoothing method.
- **MA Period:** The length of the Open/Close averages.
- **Delay Open/Close MA:** Use `1` or higher to force non-repainting behavior.
### Risk Management Settings
- **Use Trailing Stop Loss?:** Enables the TSL system.
- **Trailing Stop %:** The distance the stop follows behind the price.
- **TSL Activation % (Delay):** The profit % required before the TSL starts moving.
- **Initial Fixed Stop Loss %:** Your hard stop if the trade immediately goes against you.
- **Take Profit %:** Your ultimate profit target for the trade.
---
## How to Trade with This Strategy
1. **Identify the Trend:** Look for the Moving Average lines (Close vs Open) to cross.
2. **Wait for Confirmation:** If using MTF, ensure the higher timeframe also shows a trend change.
3. **Manage the Trade:** Let the TSL work. Once the trade hits the activation threshold, the TSL will take over, protecting your runner.
4. **Position Sizing:** Adjust the `Properties` tab in the script settings to match your desired capital allocation (Default is 10% of equity).
---
## Credits
Original Strategy by: **JustUncleL**
Optimized and Enhanced by: **Antigravity AI**

KINETIC GOLD NQ Velocity Breakout [Ash_TheTrader]
🚀 Stop Guessing. Start Scalping with Physics.
Introducing the KINETIC GOLD NQ ⚡ VELOCITY BREAKOUT System
Author: Ash_TheTrader
Assets: Gold (XAUUSD), Nasdaq (US100), Bitcoin (BTC)
Style: High-Frequency Scalping (M1/M5)
---
🛑 The Problem: Why Most Indicators Fail
You’ve been there. The RSI says "Oversold," so you buy. But price keeps crashing. The Moving Average crosses over, so you enter. But the trend is already over.
Why? Because those indicators are lagging . They tell you what happened 10 candles ago.
⚡ The Solution: The "Physics" of Price
Markets move like objects in the real world. They have Velocity (Speed) and Momentum (Mass).
The Kinetic Velocity Breakout (KMB) system doesn't look at "Overbought" or "Oversold." It looks for FORCE .
It answers one simple question: Is the market moving fast enough to pay me?
---
🧠 The 4 "Smart Logic" Features
1. The Velocity Speedometer 🏎️
Most candles are "noise." This system ignores them. It uses a Normalized Volatility Engine to detect when price hits "WARP SPEED".
• Blue: Slow (Cruising). Don't touch.
• Yellow: Accelerating. Get ready.
• Red: WARP SPEED. Institutional money is entering.
2. The 1.5x Impulse Rule 💥
The algorithm strictly enforces the "1.5x Law." A signal ONLY fires if the breakout candle is 1.5 times larger than the average of the last 3 candles.
• Result? No more fakeouts. We only trade real expansions.
3. "Smart Mode" AI Dashboard 🖥️
A heads-up display (HUD) lives on your chart, auto-detecting your trading environment:
• Auto-Session: Tells you if you are in London, New York, or Asia.
• Risk Mode: Shows if you are using "Aggressive" or "Normal" logic.
• Status: Gives you a text readout like "READY ⚡" or "WAIT..."
4. Auto-Pilot Risk Management 🛡️
Scalping is fast. You don't have time to calculate Pips.
• The script draws the lines for you.
• As soon as a "ROCKET" signal appears, a Green TP Line (2x Reward) and Red SL Line appear instantly.
---
🎮 How to Trade: The 3-Step "Kinetic" Strategy
This strategy is designed for Gold (XAUUSD) and Nasdaq (US100) on the 5-Minute Timeframe .
Step 1: The "Yellow" Warning ⚠️
Watch the Smart Structure Lines (Dashed Lines).
• If the candles turn Yellow or the Dashboard says "FAST" , wake up.
• This means pressure is building against a key level.
Step 2: The "Warp" Trigger 🚀
Wait for a Confirmed Breakout . You are looking for:
1. A candle closes OUTSIDE the dashed structure line.
2. The candle color is NEON CYAN (Bullish) or NEON MAGENTA (Bearish).
3. The Signal Label appears: "ROCKET" (Buy) or "DROP" (Sell).
👉 Rule: No Label? No Trade. The 1.5x Logic saves you from bad trades.
Step 3: The Execution 💰
1. Enter at the close of the signal candle.
2. Stop Loss: Place it exactly on the Red Line provided by the indicator.
3. Take Profit: Place it on the Green Line .
4. Walk away. Let the physics work.
---
⚙️ Customizing Your Style
The script comes with two built-in "Personalities":
🛡️ Normal Scalper (Default)
• Best for: New traders, Funded Accounts.
• Logic: Waits for strong confirmation. High Win Rate.
• Risk: 1:2 Risk/Reward.
⚠️ QuickScalper (Aggressive)
• Best for: Gold M1, Volatility Hunters.
• Logic: Enters earlier on 1.2x Impulse. More signals, faster exits.
• Risk: 1:1.5 Risk/Reward (Grab the cash and go).
---
👇 Get the Code
Search for: KINETIC ⚡ in the TradingView library.
"Markets are physics. Trade the Velocity, not the noise." — @Ash_TheTrader
