AI Probabilistic OrderFlow Scalper⭐ Description:
📌 AI Probabilistic OrderFlow Scalper
This script combines Order Flow, Auction Market Theory, Volume Imbalance, Market Structure (HH/LL), RSI bias filtering, and a probability-based direction model inspired by AI and statistics.
It produces high-precision scalping entries designed for fast markets such as Futures, while remaining compatible with all markets (indices, crypto, forex, metals).
This is not a typical indicator — it is a probabilistic predictive model engineered to provide sniper entries, a tick-based Take Profit, a volatility-adaptive ATR Stop Loss, and optional Value Area levels (VAH/VAL/POC).
⭐ Main Features:
🔥 Directional probability model (AI-style weighted scoring)
📊 Order Flow imbalance (delta-like logic)
📈 HH/LL market structure detection
🎯 Smart RSI bias filter
🚀 One signal per trend shift (anti-spam)
🎯 Tick-based Take Profit (perfect for NQ / futures)
🛡️ ATR-based dynamic Stop Loss
📉 Value Area display: VAH, VAL, POC
🔊 Volume confirmation filter
📡 Directional probability plot
✔️ Works for Futures, Crypto, Forex, Indices
🧠 Probabilistic AI Approach
The model uses a 3-factor scoring system:
Order Flow imbalance
Market structure (HH/LL)
RSI trend bias
Each validated condition = 1 point.
The total score is converted into Buy/Sell probabilities, and the higher-probability direction is selected.
When probability exceeds the threshold (e.g. 80%), the system triggers a high-confidence sniper signal.
This mirrors Revenue Management logic:
→ Only take a decision when probability of success is maximized.
🎯 Buy/Sell Signals (Sniper Entries)
🔵 Green triangle under the candle = high-probability Buy
🔴 Red triangle above the candle = high-probability Sell
✔️ Only one signal per directional shift
✔️ Signals appear only when all strict filters are satisfied
📌 Automatic TP / SL
TP: fixed tick-based (e.g. 100 ticks for NQ scalping)
SL: ATR-based, adapts to volatility
TP/SL display can be enabled or disabled
Perfectly calibrated for high-speed scalping.
📘 How to Use
Use on every timeframe
Adjust probability threshold (75–90 recommended)
Enable strict mode for maximum precision
Let the model filter entries automatically
Choose a TP suitable for your market
Optionally display VAH/VAL/POC for Auction Theory context
Always test using backtesting before going live
🏆 Advantages
Extremely fast for scalping
High win-rate potential via probabilistic filtering
Clean signals (no noise or spam)
Combines the strongest trading frameworks:
Order Flow
Market Structure
Statistical modeling
Volume profiling
Automated risk management
Search in scripts for "ai"

AI Trend Signal + Auto TrendLines [NinjADeviL]📈 AI Trend Signal + Auto TrendLines
The AI Trend Signal + Auto TrendLines indicator combines smart automatic trendline detection with AI-based market structure analysis to deliver precise real-time entry and exit signals.
🧠 Key Features:
🔹 Automatically detects upward and downward trendlines based on dynamic swing analysis.
🔹 Highlights breakout zones with clear visual alerts.
🔹 Built-in AI engine to forecast early trend reversals.
🔹 Integrates Smart Money Concepts (BOS / CHoCH).
🔹 Dynamic background and color-coded visualization for bullish/bearish trends.
🔹 Works across all timeframes and asset classes — stocks, forex, indices, and crypto.
⚙️ Fully Customizable:
Adjust colors, sensitivity, line styles, and alerts to fit your personal trading strategy and chart style.
💡 Perfect For:
Traders looking to identify high-probability breakouts, trend reversals, and key structural points in the market with clarity and accuracy.

Ai BTC Signals Buy & Whales / Liquidation - Strategy [Ai Whales]Dear Trader,
The development involved professional analysts and incorporated AI to adapt signals to the modern, constantly changing, and highly volatile BTCUSD market, also taking into account the presence and actions of large institutional players — the so-called "Whales." The strategy allows you to instantly evaluate any configuration you set within the indicator and see the results reflected in professional performance metrics aligned with your chosen strategy.
The indicator displays several signals on the chart:
1) Buy signal (not sell signals)
2) Take profit line and price
3) Stop loss line and price
4) Manipulations & Liquidations observed in the market
5) Whale activity—buying in small, medium, and large amounts
The indicator does not repaint because it is based on showing signals only after the candle closes, so the calculations are true and not distorted.
Recommended pair: BTCUSD ; BTCUSDT ; BTCUSDTP and same.
The indicator can show R/R - 0.5:1 1:1 1:2 1:3 1:4
Recommended timeframes for use: from 4 hours up to 1 week, with the ideal being 1 day. However, you are free to experiment with other near timeframes.
Possible trading modes: spot or futures.
Some methods used in the calculations of the indicator:
- statistical patterns that have the ability to repeat in the future. Bitcoin cycles in different market phases that also have the ability to repeat and are included in the indicator,
- miners' capitulation and hashrate level are also taken into account by the indicator,
- candle volumes and their deltas are taken into account in the calculations,
- as well as other bases such as RSI and its divergence, the crossing of EMA of various configurations and etc.
**How the strategy calculates positions:**
A position opens at the Buy signal level and is fixed at the level of the thick green line, which serves as the primary take profit target. Pyramiding (adding to positions) can be enabled in the settings.
The size of each position is adjustable via the settings. Importantly, each signal creates its own take profit lines. When pyramiding is enabled, all positions are eventually closed at the nearest take profit level generated by any of the pyramiding signals. This approach minimizes potential losses if the price doesn’t reach the maximum take profit levels initially set; the strategy closes positions at the closest available take profit level. This conservative method for strategy reduces risk, although ideally, each position in the pyramid should be closed at an individual take-profit level, which would lead to even better results during deep backtesting.
The strategy includes alerts that can be configured based on your platform’s capabilities. Alerts trigger on the chart when "Buy" or "Whale" signals are detected.
**Settings Overview:**
- Inside the strategy: default platform options.
- Inside the indicato have some filters:
1) allows traders to choose display modes
2) position entries based on market phase—rising or falling
3) can also select whether to trade after manipulations and liquidations
4) can also select whether to trade after whale activity (small medium or big amounts of whales).
You can manually adjust take profit and stop loss levels via simple method selections, making these flexible yet user-friendly. The indicator offers three main styles:
- "Universal" (standard levels)
- "Aggressive"
- "Conservative"
**Performance and caveats:**
Deep Backtested from day one of Bitcoin’s listing on various exchanges under specific conditions (no liquidations, certain settings), the indicator has shown a maximum drawdown of about 5-15%, with final returns surpassing "buy and hold" more than 1000000% and WinRate 93-100% However, it’s crucial to understand that such spectacular past performance does not guarantee future results.
If you are serious about your investments, remember that geopolitical events, institutional shifts, or other unforeseen factors can significantly impact Bitcoin’s price—or even its existence. Unfortunately, AI has not yet learned to fully account for these macro conditions within its adaptive mechanisms.
Trade wisely, and use this powerful tool responsibly.
Best regards,

AI KNN-Dual SuperTrend MTF - by Trading Pine Lab🇬🇧
The AI KNN-Dual SuperTrend MTF is a next-generation trading strategy that merges two higher-timeframe SuperTrends with dual KNN (K-Nearest Neighbors) classifiers, an ADX/DMI filter, and a Pivot Percentile bias module. This layered architecture ensures stronger signal confirmation by requiring consensus across AI models, multi-timeframe SuperTrends, and statistical filters.
Entries occur only when both SuperTrends align with bullish or bearish KNN labels, while the ADX/DMI filter validates momentum. Exits are managed dynamically with adaptive trailing stops (ST ± ATR × factor) or when market conditions flip according to percentile bias.
All parameters are fully configurable:
-Trading direction filter: Long / Short / Both.
-KNN classifiers: neighbors (K), dataset size (N), smoothing lengths.
-Dual SuperTrend: higher timeframes, ATR length, ATR factor, baseline type.
-ADX/DMI filter: customizable length and timeframe.
-Pivot Percentile module: multi-scale statistical bias.
-Visualization: AI markers, ribbons, aura lines, and per-trend coloring.

AI Volume-KNN SuperTrend - by Trading Pine Lab🇬🇧 English
The AI Volume-KNN SuperTrend is an advanced trading strategy that combines the robustness of the SuperTrend indicator with a machine-learning inspired KNN (K-Nearest Neighbors) model. The baseline is built from a volume-weighted moving average with ATR-based bands, while the KNN classifier validates trend direction in real time. This dual-layer approach reduces false signals and improves trend confirmation.
Entries are triggered when the SuperTrend flips direction and the KNN classifier confirms the move as bullish or bearish. Exits are managed with a dynamic trailing stop, automatically adjusting to SuperTrend ± ATR × factor. The strategy includes visual markers for AI start/continuation signals, as well as customizable coloring for bullish, bearish, and neutral phases.
All parameters are fully configurable:
-Trading direction filter: Long / Short / Both.
-KNN settings: number of neighbors (K), dataset size (N).
-Label smoothing: price and SuperTrend smoothing lengths (WMAs).
-SuperTrend settings: length, ATR factor, and moving average source.
-Visualization: trend markers and per-trend coloring.

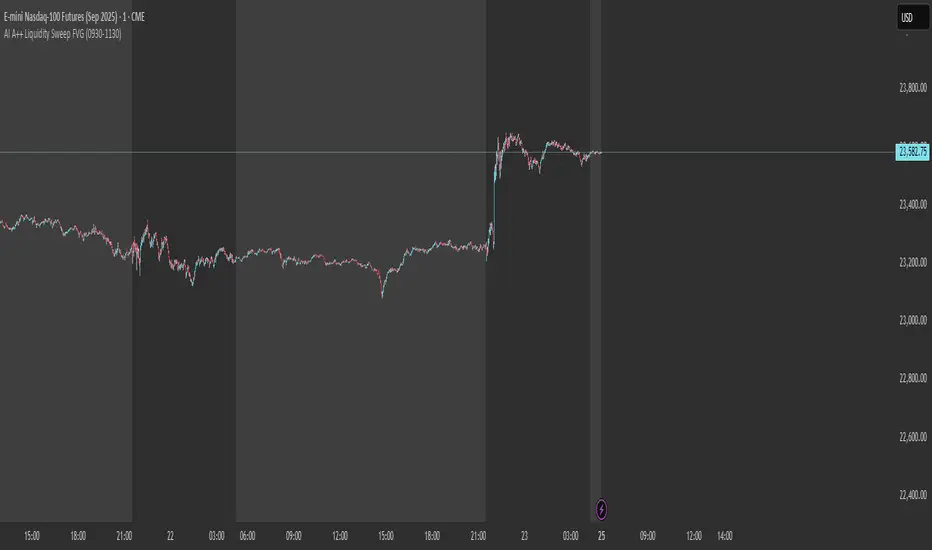
AI A++ Liquidity Sweep FVGThat is a critical question. For the "AI A++ Liqu-idity Sweep FVG" indicator to work exactly as designed, you must have your chart set to the:
1-Minute (1m) Timeframe
The Reason:
The logic of the script is built to analyze the very specific, rapid price action that occurs in the first few minutes of the New York session open.
FVG Detection: A Fair Value Gap is a three-candle pattern. On the 1-minute chart, this allows us to see the rapid imbalances created by the opening burst of volume. On a higher timeframe like the 5-minute or 15-minute, these subtle but powerful gaps would be smoothed over and might not even be visible.
Liquidity Sweep Precision: The script is looking for a quick "stop hunt" that pierces the pre-market high or low and then immediately reverses. This action is most clearly and accurately seen on the 1-minute chart.
Using any other timeframe will cause the indicator to analyze the market incorrectly and either miss valid setups or provide false signals.
So, to confirm your setup for Monday morning:
Instrument: MNQ (Micro E-mini Nasdaq-100 Futures)
Timeframe: 1-Minute
Indicator: "AI A++ Liquidity Sweep FVG" active on the chart.
Alert: Alert set up for the indicator.
You are now perfectly set up to catch the exact A++ setup we are waiting for.
AI Trend Momentum SniperThe AI Trend Momentum Sniper is a powerful technical analysis tool designed for day trading. This strategy combines multiple momentum and trend indicators to identify high-probability entry and exit points. The indicator utilizes a combination of Supertrend, MACD, RSI, ATR (Average True Range), and On-Balance Volume (OBV) to generate real-time signals for buy and sell opportunities.
Key Features:
Supertrend for detecting market direction (bullish or bearish).
MACD for momentum confirmation, highlighting changes in market momentum.
RSI to filter out overbought/oversold conditions and ensure high-quality trades.
ATR as a volatility filter to adjust for changing market conditions.
OBV (On-Balance Volume) to confirm volume strength and trend validity.
Dynamic Stop-Loss & Take-Profit based on ATR to manage risk and lock profits.
This indicator is tailored for intraday traders looking for quick market moves, especially in volatile and high liquidity assets like Bitcoin (BTC) and Ethereum (ETH). It helps traders capture short-term trends with efficient risk management tools.
How to Apply:
Set Your Chart: Apply the AI Trend Momentum Sniper to a 5-minute (M5) or 15-minute (M15) chart for optimal performance.
Buy Signal: When the indicator generates a green arrow below the bar, it indicates a buy signal based on positive trend and momentum alignment.
Sell Signal: A red arrow above the bar signals a sell condition when the trend and momentum shift bearish.
Stop-Loss and Take-Profit: The indicator automatically calculates dynamic stop-loss and take-profit levels based on the ATR value for each trade, ensuring proper risk management.
Alerts: Set up custom alerts for buy or sell signals, and get notified instantly when opportunities arise.
Best Markets for Use:
BTC/USDT, ETH/USDT – High liquidity and volatility.
Major altcoins with sufficient volume.
Avoid using it on low-liquidity assets where price action may become erratic.
Timeframes:
This indicator is best suited for lower timeframes (5-minute to 15-minute charts) to capture quick price movements in trending markets.

AI InfinityAI Infinity – Multidimensional Market Analysis
Overview
The AI Infinity indicator combines multiple analysis tools into a single solution. Alongside dynamic candle coloring based on MACD and Stochastic signals, it features Alligator lines, several RSI lines (including glow effects), and optionally enabled EMAs (20/50, 100, and 200). Every module is individually configurable, allowing traders to tailor the indicator to their personal style and strategy.
Important Note (Disclaimer)
This indicator is provided for educational and informational purposes only.
It does not constitute financial or investment advice and offers no guarantee of profit.
Each trader is responsible for their own trading decisions.
Past performance does not guarantee future results.
Please review the settings thoroughly and adjust them to your personal risk profile; consider supplementary analyses or professional guidance where appropriate.
Functionality & Components
1. Candle Coloring (MACD & Stochastic)
Objective: Provide an immediate visual snapshot of the market’s condition.
Details:
MACD Signal: Used to identify bullish and bearish momentum.
Stochastic: Detects overbought and oversold zones.
Color Modes: Offers both a simple (two-color) mode and a gradient mode.
2. Alligator Lines
Objective: Assist with trend analysis and determining the market’s current phase.
Details:
Dynamic SMMA Lines (Jaw, Teeth, Lips) that adjust based on volatility and market conditions.
Multiple Lengths: Each element uses a separate smoothing period (13, 8, 5).
Transparency: You can show or hide each line independently.
3. RSI Lines & Glow Effects
Objective: Display the RSI values directly on the price chart so critical levels (e.g., 20, 50, 80) remain visible at a glance.
Details:
RSI Scaling: The RSI is plotted in the chart window, eliminating the need to switch panels.
Dynamic Transparency: A pulse effect indicates when the RSI is near critical thresholds.
Glow Mode: Choose between “Direct Glow” or “Dynamic Transparency” (based on ATR distance).
Custom RSI Length: Freely adjustable (default is 14).
4. Optional EMAs (20/50, 100, 200)
Objective: Utilize moving averages for trend assessment and identifying potential support/resistance areas.
Details:
20/50 EMA: Select which one to display via a dropdown menu.
100 EMA & 200 EMA: Independently enabled.
Color Logic: Automatically green (price > EMA) or red (price < EMA). Each EMA’s up/down color is customizable.
Configuration Options
Candle Coloring:
Choose between Gradient or Simple mode.
Adjust the color scheme for bullish/bearish candles.
Transparency is dynamically based on candle body size and Stochastic state.
Alligator Lines:
Toggle each line (Jaw/Teeth/Lips) on or off.
Select individual colors for each line.
RSI Section:
RSI Length can be set as desired.
RSI lines (0, 20, 50, 80, 100) with user-defined colors and transparency (pulse effect).
Additional lines (e.g., RSI 40/60) are also available.
Glow Effects:
Switch between “Dynamic Transparency” (ATR-based) and “Direct Glow”.
Independently applied to the RSI 100 and RSI 0 lines.
EMAs (20/50, 100, 200):
Activate each one as needed.
Each EMA’s up/down color can be customized.
Example Use Cases
Trend Identification:
Enable Alligator lines to gauge general trend direction through SMMA signals.
Timing:
Watch the Candle Colors to spot potential overbought or oversold conditions.
Fine-Tuning:
Utilize the RSI lines to closely monitor important thresholds (50 as a trend barometer, 80/20 as possible reversal zones).
Filtering:
Enable a 50 EMA to quickly see if the market is trading above (bullish) or below (bearish) it.

AI Crypto Signals BTCUSD 15m Ultimate ScriptBYBIT:BTCUSD
Hello everyone! Sky First Capital in partnership with AI Crypto Signals is proud to introduce the AI Crypto Signals 15M BTCUSD Ultimate Script . This script works well on the 15M, 30M, 45M and 1HR chart using traditional candles. This means no false data or inaccurate entry/exit points such as with the ones using HA candles.
The script is based upon an initial strategy developed by user Bunghole here on TradingView, but we have optimized it, back-tested it with ideal settings, and added alerts that you can use to connect with your trading bot such as Alertatron, Cornix, etc. This script uses BB (Bollinger Bands) and RSI (Relative Strength Index) as indicators for signals.
Back-testing data for the 15M chart from 7/1/2021 to 10/15/2021 showed a 51.19% profit.
Back-testing data for the 1HR chart from 7/1/2021 to 10/15/2021 showed a 191% profit.
This script does not repaint.
Ideal use is to enter and exit at the close of the candle and take-profit/stop-loss once per candle.
This script has Entry/Exit/Take-Profit/Stop-Loss alerts.
We offer consulting and training services if you need help on using this script or getting it configured with an automated trading system.
We offer a 24 hour free trial of the script, send us a message to request access.


AI Reversal Signals Custom [wjdtks255]📊 Indicator Overview: AI Reversal Signals Custom
This indicator is a comprehensive trend-following and reversal detection tool. It combines the long-term trend bias of a 200 EMA with highly sensitive RSI-based reversal signals and momentum visualization. It is designed to capture market bottoms and tops by identifying exhaustion points in price action.
Key Features
200 EMA (Trend Filter): A gold line representing the long-term institutional trend. It helps traders distinguish between "buying the dip" and "catching a falling knife."
Reversal Buy/Sell Labels: Real-time signals that appear when the market recovers from extreme overbought or oversold conditions.
Dynamic Background Clouds: Visual indicators of trend strength changes, highlighting potential entry zones.
Momentum Histogram: Internal calculations mimic the "Bottom Bars" seen in professional suites to track the velocity of price movement.
📈 Trading Strategy (How to Trade)
1. High-Probability Long Setup (Buy)
Trend Confirmation: Price should ideally be trading above the 200 EMA for the highest success rate.
Signal: Wait for the "BUY" label to appear below the candle.
Momentum: Confirm with the Light Green background or histogram shift indicating recovery.
Entry: Enter on the close of the signal candle.
2. High-Probability Short Setup (Sell)
Trend Confirmation: Price should ideally be trading below the 200 EMA.
Signal: Wait for the "SELL" label to appear above the candle.
Momentum: Confirm with the Red background or histogram fading from green to red.
Entry: Enter on the close of the signal candle.
3. Risk Management
Stop Loss: Place your Stop Loss slightly below the recent swing low for Buy orders, or above the recent swing high for Sell orders.
Take Profit: Exit when the price reaches a major support/resistance level or when an opposing signal appears.
💡 Professional Tip
For the best results, use this indicator on the 15-minute or 1-hour timeframes. The most powerful "Ultimate Reversal" signals occur when there is a Bullish Divergence (Price making lower lows while the RSI makes higher lows) followed by a confirmed "BUY" label.

AI Kernel Regression StrategyHow to Use This Strategy
Paste the Code: Open the Pine Editor, paste the code, and click "Add to chart".
Look for Reversals:
BUY Signal: The price dipped below the green band (oversold) and snapped back up. The script identifies this as a high-probability bounce.
SELL Signal: The price spiked above the red band (overbought) and snapped back down.
Adjust the "Lookback Window":
In the settings (gear icon), if you change Lookback Window to a higher number (e.g., 15-20), the lines become smoother (better for trends).
If you lower it (e.g., 3-5), it becomes very reactive (better for scalping).
Important Note on "Repainting"
This script uses a technique called Regression. In live trading, it works perfectly (the signal appears when the candle closes). However, be aware that "AI" scripts like this are heavy on calculations. If you refresh your browser, the historical lines might shift slightly to fit the data better. Always wait for the candle to close before taking the trade to ensure the signal is locked in.

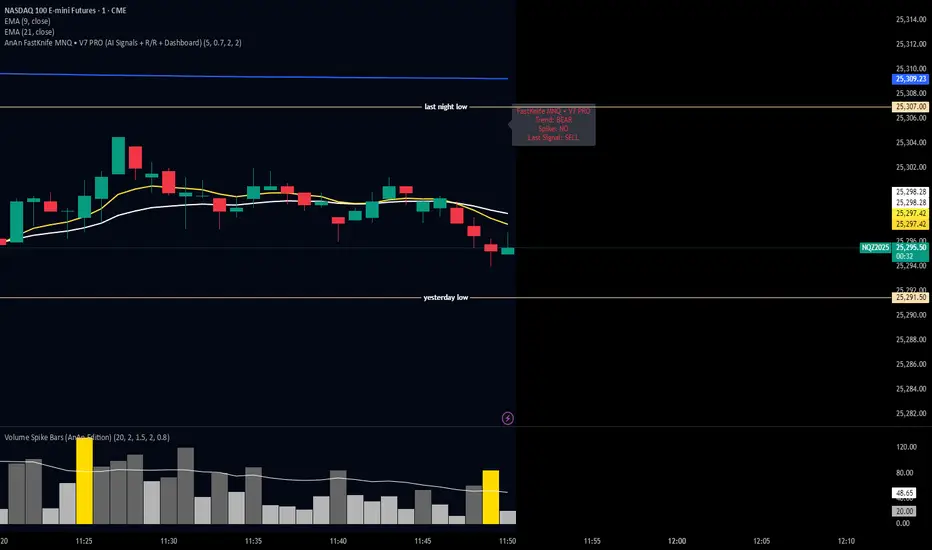
AnAn FastKnife MNQ • V7 PRO (AI Signals + R/R + Dashboard)ai script developed to test the market and the speed and the volatility an the important signals
AI INSTITUTIONAL ENGINE + PATTERNS + VOLUME DASHBOARD📈 AI Institutional Engine – Pattern + Volume Dashboard
© 2025 MJ VIOLET PRO FX – all rights reserved
What it does
Auto-plots yesterday’s high / low / mid plus dynamic swing S/R
Detects 17 classical candle patterns on a higher-time-frame (default Daily)
Scans volume delta in real time and flags when today’s tape is ≥ 1.5 × 20-period average
Boosts pattern confidence if signal occurs inside NYSE hours (09:30 – 16:00 ET)
Paints an “HTF volume candle” so you see institutional-size footprints without changing charts
Fires audible / pop-up alerts only when pattern + volume + session line up
Why traders like it
One glance: trend emoji, pattern name, exact entry / exit prices, key level, stop distance
No repainting: all calculations close on the bar close; alerts fire once per bar
Fully customizable: toggle levels, labels, dashboard position, colours, text size, line length
Works on every symbol and timeframe (crypto, FX, equities, futures)
Lightweight code: < 500 drawing objects, no security() leaks, compatible with free TradingView accounts
How to read the dashboard
Buy Vol / Sell Vol / Delta – session-totals reset at the daily candle
Current Day – live bull / bear / doji emoji
Yesterday’s Range – the exact numbers the algo uses for breakout logic
Typical workflow
Add indicator
Wait for “High+” or “High” confidence pattern (green / orange label)
Check breakout box: close above resistance = long trigger, close below support = short trigger
Use suggested entry / stop in the label or place limit orders at the printed levels
Move stop to breakeven when price reaches 1:1 R:R or when opposite signal prints
Inputs you can tweak
Candle Time-frame for patterns (default D, but 4 h / 12 h / W work too)
Session filter time-zone (already set to “America/New_York”)
Volume multiplier (default 1.5 × MA)
Dashboard & table position, text sizes, colours, line style / length
Alert on / off for patterns and / or breakout levels only
Disclaimer
This tool is for educational and informational purposes only. It is not investment advice, an offer or solicitation to buy / sell any security, or a recommendation of any trading strategy. MJ VIOLET PRO FX is not a registered advisor. Futures, FX and CFDs are leveraged products; losses can exceed deposits. Always do your own due diligence and consult a licensed professional before risking capital.

AI Bot Regime Feed (v6) — stableThis indicator generates real-time, structured JSON alerts for external trading bots or automation systems.
It combines multiple technical layers to identify market regimes and high-probability buy/sell events, and sends them to any webhook endpoint (e.g., a FastAPI or Zapier listener).

AI Trading Alerts v6 — SL/TP + Confidence + Panel (Fixed)Overview
This Pine Script is designed to identify high-probability trading opportunities in Forex, commodities, and crypto markets. It combines EMA trend filters, RSI, and Stochastic RSI, with automatic stop-loss (SL) & take-profit (TP) suggestions, and provides a confidence panel to quickly assess the trade setup strength.
It also includes TradingView alert conditions so you can set up notifications for Long/Short setups and EMA crosses.
⚙️ Features
EMA Trend Filter
Uses EMA 50, 100, 200 for trend confirmation.
Bull trend = EMA50 > EMA100 > EMA200
Bear trend = EMA50 < EMA100 < EMA200
RSI Filter
Bullish trades require RSI > 50
Bearish trades require RSI < 50
Stochastic RSI Filter
Prevents entries during overbought/oversold extremes.
Bullish entry only if %K and %D < 80
Bearish entry only if %K and %D > 20
EMA Proximity Check
Price must be near EMA50 (within ATR × adjustable multiplier).
Signals
Continuation Signals:
Long if all bullish conditions align.
Short if all bearish conditions align.
Cross Events:
Long Cross when price crosses above EMA50 in bull trend.
Short Cross when price crosses below EMA50 in bear trend.
Automatic SL/TP Suggestions
SL size adjusts depending on asset:
Gold/Silver (XAU/XAG): 5 pts
Bitcoin/Ethereum: 100 pts
FX pairs (default): 20 pts
TP = SL × Risk:Reward ratio (default 1:2).
Confidence Score (0–4)
Based on conditions met (trend, RSI, Stoch, EMA proximity).
Labels:
Strongest (4/4)
Strong (3/4)
Medium (2/4)
Low (1/4)
Visual Panel on Chart
Shows ✅/❌ for each condition (trend, RSI, Stoch, EMA proximity, signal now).
Confidence row with color-coded strength.
Alerts
Long Setup
Short Setup
Long Cross
Short Cross
🖥️ How to Use
1. Add the Script
Open TradingView → Pine Editor.
Paste the full script.
Click Add to chart.
Save as "AI Trading Alerts v6 — SL/TP + Confidence + Panel".
2. Configure Inputs
EMA Lengths: Default 50/100/200 (works well for swing trading).
RSI Length: 14 (standard).
Stochastic Length/K/D: Default 14/3/3.
Risk:Reward Ratio: Default 2.0 (can change to 1.5, 3.0, etc.).
EMA Proximity Threshold: Default 0.20 × ATR (adjust to be stricter/looser).
3. Read the Panel
Top-right of chart, you’ll see ✅ or ❌ for:
Trend → Are EMAs aligned?
RSI → Above 50 (bull) or below 50 (bear)?
Stoch OK → Not extreme?
Near EMA50 → Close enough to EMA50?
Above/Below OK → Price position vs. EMA50 matches trend?
Signal Now → Entry triggered?
Confidence row:
🟢 Green = Strongest
🟩 Light green = Strong
🟧 Orange = Medium
🟨 Yellow = Low
⬜ Gray = None
4. Alerts Setup
Go to TradingView Alerts (⏰ icon).
Choose the script under “Condition”.
Select alert type:
Long Setup
Short Setup
Long Cross
Short Cross
Set notification method (popup, sound, email, mobile).
Click Create.
Now TradingView will notify you automatically when signals appear.
5. Example Workflow
Wait for Confidence = Strong/Strongest.
Check if market session supports volatility (e.g., XAU in London/NY).
Review SL/TP suggestions:
Long → Entry: current price, SL: close - risk_pts, TP: close + risk_pts × RR.
Short → Entry: current price, SL: close + risk_pts, TP: close - risk_pts × RR.
Adjust based on your own price action analysis.
📊 Best Practices
Use on H1 + D1 combo → align higher timeframe bias with intraday entries.
Risk only 1–2% of account per trade (position sizing required).
Filter with market sessions (Asia, Europe, US).
Strongest signals work best with trending pairs (e.g., XAUUSD, USDJPY, BTCUSD).

AI-Powered Breakout with Advanced FeaturesDescription
This script is designed to detect breakout moments in financial markets using a combination of traditional breakout detection methods and adaptive moving averages. By leveraging elements of artificial intelligence, the script provides a more dynamic and responsive approach to identifying potential entry and exit points in trading.
Usefulness
This script stands out by integrating a traditional breakout finder with an adaptive moving average component. The adaptive moving average adjusts dynamically based on the differences between fast and slow exponential moving averages (EMAs), offering a more flexible and responsive detection of support and resistance levels. This combination aims to reduce false signals and enhance the reliability of breakout detections, making it a valuable tool for traders seeking to capture market movements more effectively.
Features
1. Breakout Detection: Utilizes pivot highs and lows to identify significant breakout points over a user-defined period. This method helps in capturing the essential support and resistance levels that are critical in breakout trading.
2. AI Machine Learning Component - Adaptive Moving Average: Implements an adaptive moving average using two exponential moving averages (EMAs). adaptiveMA is dynamically adjusted based on the difference between a fast average and a slow average.
3. Buy/Sell Signals: The script generates buy and sell signals when bullish and bearish breakouts occur, respectively. These signals are visually represented on the chart, helping traders to quickly identify potential trading opportunities.
4. Visualization: Draws horizontal lines at identified breakout levels and plots shapes (arrows) on the chart to indicate buy/sell signals. This makes it easy for traders to see where significant breakout points are and where to consider entering or exiting trades.
Underlying Concepts
1. Breakout Finder Logic: The script uses pivot points (highs and lows) to detect breakout levels. It stores these pivot points in arrays and monitors them for persistence, ensuring that the detected breakouts are significant and reliable.
2. Adaptive Moving Average (AMA): The AMA is a key component that enhances the script's responsiveness. By calculating the differences between fast and slow EMAs, the AMA adapts to changing market conditions, providing a more accurate measure of trends and potential reversals.
How to Use
• Adjustable Parameters: The script includes several user-adjustable parameters:
o Lookback Length: Defines the period over which the script calculates the highest high and lowest low for breakout detection.
o Multiplier for Adaptive MA: Adjusts the sensitivity of the adaptive moving average.
o Period for Pivots: Sets the period for detecting pivot highs and lows.
o Max Breakout Length: Specifies the maximum length for breakout consideration.
o Threshold Rate: Determines the threshold rate for breakout validation.
o Minimum Number of Tests: Sets the minimum number of tests required to validate a breakout.
o Colors and Line Style: Customize the colors and line styles for breakout levels.
Interpreting Signals
o Green Arrows: Indicate a bullish breakout signal, suggesting a potential buy opportunity.
o Red Arrows: Indicate a bearish breakout signal, suggesting a potential sell opportunity.
o Horizontal Lines: Show the breakout levels, helping to visualize support and resistance areas.
By combining traditional breakout detection with advanced adaptive moving averages, this script aims to provide traders with a robust tool for identifying and capitalizing on market breakouts.
Credits
Parts of this script were inspired and adapted from the "Breakout Finder" script by LonesomeTheBlue. Significant improvements include the integration of the adaptive moving average component and enhancements to the breakout detection logic.

AI SuperTrend - Strategy [presentTrading]
█ Introduction and How it is Different
The AI Supertrend Strategy is a unique hybrid approach that employs both traditional technical indicators and machine learning techniques. Unlike standard strategies that rely solely on traditional indicators or mathematical models, this strategy integrates the power of k-Nearest Neighbors (KNN), a machine learning algorithm, with the tried-and-true SuperTrend indicator. This blend aims to provide traders with more accurate, responsive, and context-aware trading signals.
*The KNN part is mainly referred from @Zeiierman.
BTCUSD 8hr performance
ETHUSD 8hr performance
█ Strategy, How it Works: Detailed Explanation
SuperTrend Calculation
Volume-Weighted Moving Average (VWMA): A VWMA of the close price is calculated based on the user-defined length (len). This serves as the central line around which the upper and lower bands are calculated.
Average True Range (ATR): ATR is calculated over a period defined by len. It measures the market's volatility.
Upper and Lower Bands: The upper band is calculated as VWMA + (factor * ATR) and the lower band as VWMA - (factor * ATR). The factor is a user-defined multiplier that decides how wide the bands should be.
KNN Algorithm
Data Collection: An array (data) is populated with recent n SuperTrend values. Corresponding labels (labels) are determined by whether the weighted moving average price (price) is greater than the weighted moving average of the SuperTrend (sT).
Distance Calculation: The absolute distance between each data point and the current SuperTrend value is calculated.
Sorting & Weighting: The distances are sorted in ascending order, and the closest k points are selected. Each point is weighted by the inverse of its distance to the current point.
Classification: A weighted sum of the labels of the k closest points is calculated. If the sum is closer to 1, the trend is predicted as bullish; if closer to 0, bearish.
Signal Generation
Start of Trend: A new bullish trend (Start_TrendUp) is considered to have started if the current trend color is bullish and the previous was not bullish. Similarly for bearish trends (Start_TrendDn).
Trend Continuation: A bullish trend (TrendUp) is considered to be continuing if the direction is negative and the KNN prediction is 1. Similarly for bearish trends (TrendDn).
Trading Logic
Long Condition: If Start_TrendUp or TrendUp is true, a long position is entered.
Short Condition: If Start_TrendDn or TrendDn is true, a short position is entered.
Exit Condition: Dynamic trailing stops are used for exits. If the trend does not continue as indicated by the KNN prediction and SuperTrend direction, an exit signal is generated.
The synergy between SuperTrend and KNN aims to filter out noise and produce more reliable trading signals. While SuperTrend provides a broad sense of the market direction, KNN refines this by predicting short-term price movements, leading to a more nuanced trading strategy.
Local picture
█ Trade Direction
The strategy allows traders to choose between taking only long positions, only short positions, or both. This is particularly useful for adapting to different market conditions.
█ Usage
ToolTips: Explains what each parameter does and how to adjust them.
Inputs: Customize values like the number of neighbors in KNN, ATR multiplier, and moving average type.
Plotting: Visual cues on the chart to indicate bullish or bearish trends.
Order Execution: Based on the generated signals, the strategy will execute buy/sell orders.
█ Default Settings
The default settings are selected to provide a balanced approach, but they can be modified for different trading styles and asset classes.
Initial Capital: $10,000
Default Quantity Type: 10% of equity
Commission: 0.1%
Slippage: 1
Currency: USD
By combining both machine learning and traditional technical analysis, this strategy offers a sophisticated and adaptive trading solution.

AI Driven OBOS Analyzer (Zeiierman)█ Overview
AI Driven OBOS Analyzer (Zeiierman) reframes price into an adaptive Overbought/Oversold (OBOS) regime map. Rather than relying on a single oscillator threshold, it uses a responsive price function and an instance-based learner that classifies the current state by comparing it to its most similar historical states. The result is a forward-useful view of where participation is likely imbalanced (buyers dominating vs. sellers dominating), rendered as colored candles, regime boxes, and automatically drawn equilibrium lines.
⚪ Why This One Is Unique
This system stands out because its pricing engine adapts to market behavior rather than relying on a fixed formula. Rather than committing to a single filtering function or reaction speed, it reshapes its internal price view in real time, creating an OBOS framework that moves with the market’s rhythm and offers a more natural sense of when pressure is building on either side.
Its regime detection is equally distinct. Instead of static thresholds, it relies on similarity-based evaluation, comparing the current state to historically comparable periods and letting those past states vote on whether the market currently sits in a bull- or bear-leaning regime. Separate controls for how many comparisons matter and how large the reference cohort should be allow you to adjust for responsiveness or stability. As dominance phases emerge, structural regions build and then lock, creating a clear visual map of where participation meaningfully shifted between buyers and sellers.
█ Main feature
⚪ Overbought/Oversold Layer
The OBOS layer highlights when the market enters a buyer-dominant or seller-dominant phase and preserves those phases as structural reference levels. When the learner identifies a bull-dominant state , candles and a green regime box appear from the start of that dominance; once the regime concludes, the tool places an equilibrium line, a forward-projected level representing the regime’s internal balance point.
Bear-dominant phases follow the same logic with red boxes and bearish equilibrium lines. These equilibrium zones act as the anchor for the entire overbought/oversold structure, functioning as balanced points where market pressure previously shifted. A price above equilibrium often favors a bullish bias, while a price below equilibrium tends to favor a bearish bias. Traders can watch how the price behaves when revisiting these lines, such as retests, holds, reclaims, or failures, to gauge whether previous dominance levels are being respected, rejected, or flipped, turning past regime behavior into meaningful, trade-relevant context.
█ How to Use
⚪ Overbought/Oversold Trading
Overbought and oversold trading is one of the most recognized setups in technical analysis. It signals when the market has moved too far or too fast in one direction, creating an overextended move and a clear imbalance between buyers and sellers. These imbalances tend to “rebalance” through pullbacks or reversals as price fills the displaced area. Because of this, overbought and oversold zones become natural regions where traders look for turning points or counter-moves. These areas are also great spots to secure partial profits if you’re already in a position.
Reversal trading
Reversal trading based on overbought and oversold conditions can work extremely well in ranging markets. But you still need proper market context before going contrarian. Don’t rely on overbought or oversold signals in isolation.
Profit-taking
Profit-taking is about locking in gains as the market moves in your favor. Overbought and oversold zones create natural spots to secure partial profits, and when these zones end, that shift is a great moment to take some profit off the table.
⚪ Buying and Selling Pressure Trading
When overbought or oversold conditions appear, they reflect a strong dominance in buying or selling pressure. Overbought means buyers are in control; oversold means sellers are in control. These conditions can extend for some time, and the price can continue moving in that direction until buying and selling pressure finally equalize again.
Buying-Pressure
When the market enters an overbought zone, traders can look for entries aligned with that pressure to ride the momentum until it fades. A common approach is to identify an overbought imbalance on a higher timeframe, such as the 1-hour chart, and then switch to a lower timeframe, such as the 1-minute chart, to locate oversold pockets. These lower-timeframe oversold areas offer attractive long entries, assuming the higher-timeframe buying pressure continues to drive prices.
Selling-Pressure
Selling-pressure trading works the same way but in reverse. When the market enters an oversold zone, sellers dominate. Traders can use a higher-timeframe oversold imbalance as the directional bias and then look at lower timeframes for small overbought zones to enter short. These micro overbought areas become efficient entry points to ride the broader selling pressure until it resolves.
⚪ Equilibrium Trading
Overbought and oversold zones generate an equilibrium line once the zone completes. This line represents the core shift in buying or selling pressure within that regime. When price revisits an equilibrium line, retests and reversals are common. If the price holds above an equilibrium line, traders can lean toward a bullish bias; if it holds below, a bearish bias becomes more likely. These equilibrium levels act as clean, reliable reference points for directional confirmation and timing.
█ How It Works
⚪ Responsive Price Function
Price is reframed through an adaptive transformation that behaves like a dynamic response surface, adjusting its sensitivity to volatility, curvature, and micro-structure noise. Instead of a fixed smoothing rule, the engine applies an elastic filtering function that adapts in real time, preserving meaningful structure while reducing transient distortions. The outcome is a stable yet agile price backbone that drives all regime evaluation.
Calculation: Employs a parameterized smoothing functional that adjusts its horizon dynamically, reducing distortion around turning points and keeping the model’s internal state closely aligned with actual price movement.
⚪ Instance-Based Regime Classifier
Each bar is embedded into a feature space defined by its behavior relative to the model’s adaptive price state. The system then performs a similarity search across a broad historical cohort, identifying the closest structural analogs and allowing them to vote on the current bar’s regime identity. This instance-driven process avoids rigid thresholds and instead adapts fluidly to the market’s prevailing volatility conditions and structural rhythm.
Calculation: Executes an enhanced weighted nearest-neighbor inference process where similarity scores shape probabilistic voting, concentrating influence on the most contextually relevant examples to yield a stable bull or bear regime classification.
⚪ Regime Boxes & Exit Equilibrium Lines
Active regimes accumulate their structural boundaries as the market evolves, forming a real-time “regime envelope” that expresses the spatial footprint of buyer or seller dominance. When the regime ends, the segment is sealed, and an equilibrium line is projected from its internal centroid. This equilibrium expresses the pressure balance point of the regime and acts as a durable reference level for future reactions, reclaims, or breaks.
Calculation: Utilizes event-based segmentation with stateful envelope aggregation and centroid extraction, converting each completed regime into a persistent equilibrium marker that carries forward as a reactive structural level.
-----------------
Disclaimer
The content provided in my scripts, indicators, ideas, algorithms, and systems is for educational and informational purposes only. It does not constitute financial advice, investment recommendations, or a solicitation to buy or sell any financial instruments. I will not accept liability for any loss or damage, including without limitation any loss of profit, which may arise directly or indirectly from the use of or reliance on such information.
All investments involve risk, and the past performance of a security, industry, sector, market, financial product, trading strategy, backtest, or individual's trading does not guarantee future results or returns. Investors are fully responsible for any investment decisions they make. Such decisions should be based solely on an evaluation of their financial circumstances, investment objectives, risk tolerance, and liquidity needs.

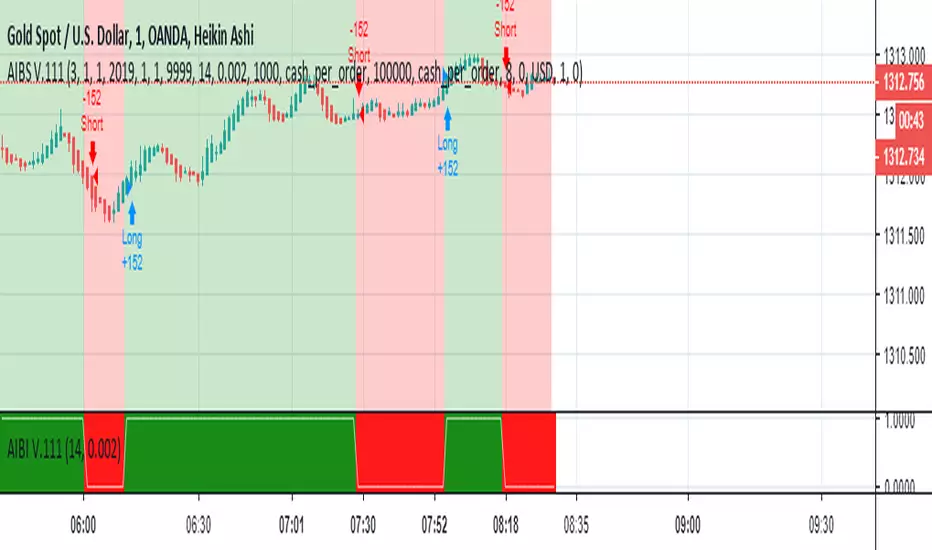
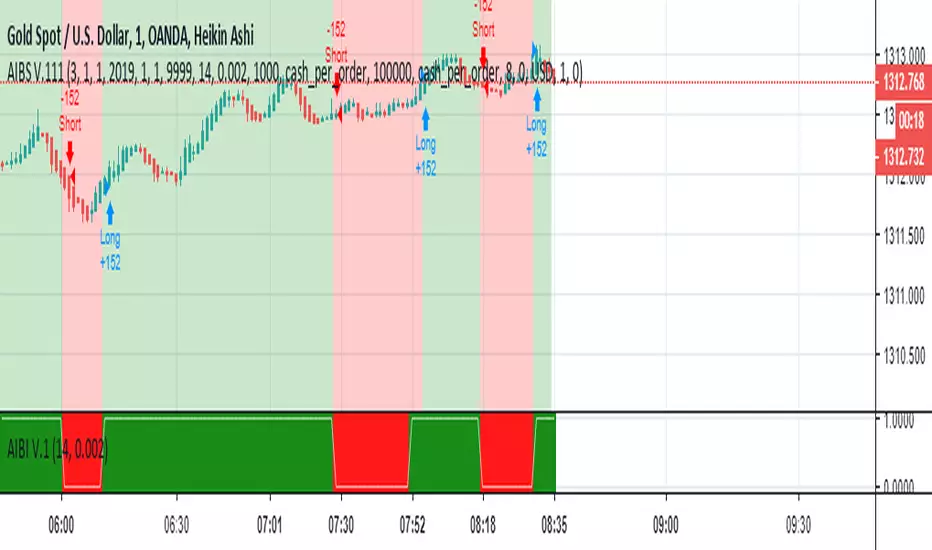
AI-Based Indicator V.1.01This is a Strategy based on Artificial Intelligence (AI) algorithms which can be used as a decision support system. In this version I use Heikin Ashi chart and reduce input parameters.
How to use:
1- Select the Heikin Ashi chart.
2- The default values of T for BTCUSD in "30m chart" is 0.12. It can be changed to achieve the best performance for BTCUSD or other tickers in arbitrary time frames.
3. When the background is green buy, and when the background is red sell.
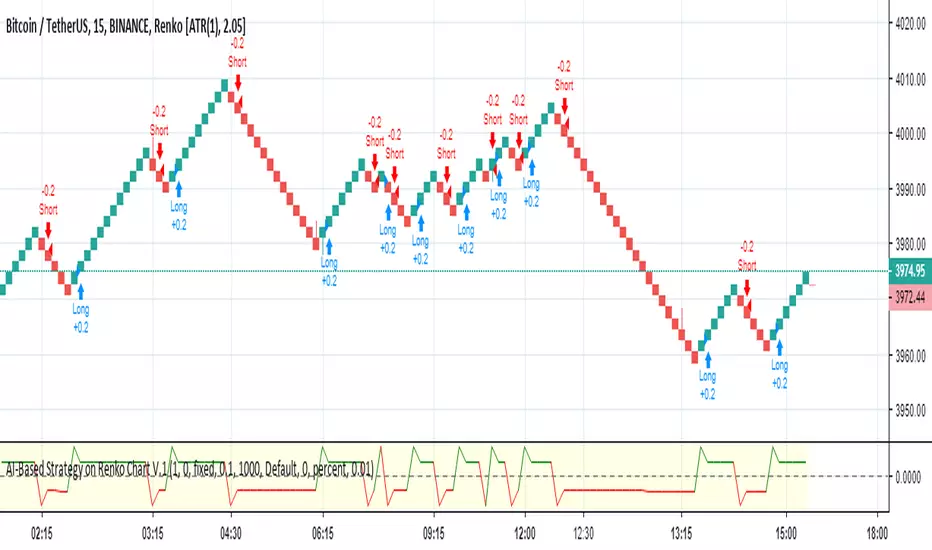
AI-Based Strategy on Renko Chart V.1This is a Strategy based on Artificial Intelligence (AI) algorithms which can be used as a decision support system.
How to use:
1- Select the Renko chart.
2- Set "ATR Length" on settings window to "1". Settings can be seen after right click on the chart.
3- Use arbitrary time frame.
AI-Based Strategy V.1
This is a Strategy based on Artificial Intelligence (AI) algorithms which can be used (alone or along with other strategies) as a decision support system.
How to use:
1- The default values of Input 1, Input 2, R, and T for ETHUSDT are “Close”, “ohlc4”, 180, and 0.1325 respectively. They can be changed to achieve the best performance for ETHUSDT or other symbols.
2- Use one of the time frames 15 to 3m.
3. When the background is green buy, and when the background is red sell.