New RSI📌 New RSI
The New RSI is a modern, enhanced version of the classic RSI created in 1978 — redesigned for today’s fast-moving markets, where algorithmic trading and AI dominate price action.
This indicator combines:
Adaptive RSI: Adjusts its calculation length in real time based on market volatility, making it more responsive during high volatility and smoother during calm periods.
Dynamic Bands: Upper and lower bands calculated from historical RSI volatility, helping you spot overbought/oversold conditions with greater accuracy.
Trend & Regime Filters: EMA and ADX-based detection to confirm signals only in favorable market conditions.
Volume Confirmation: Signals appear only when high trading volume supports the move — green volume for bullish setups and red volume for bearish setups — filtering out weak and unreliable trades.
💡 How it works:
A LONG signal appears when RSI crosses above the lower band and the volume is high with a bullish candle.
A SHORT signal appears when RSI crosses below the upper band and the volume is high with a bearish candle.
Trend and higher timeframe filters (optional) can help improve precision and adapt to different trading styles.
✅ Best Use Cases:
Identify high-probability reversals or pullbacks with strong momentum confirmation.
Avoid false signals by trading only when volume validates the move.
Combine with your own support/resistance or price action strategy for even higher accuracy.
⚙️ Fully Customizable:
Adjustable RSI settings (length, volatility adaptation, smoothing)
Dynamic band sensitivity
Volume threshold multiplier
Higher timeframe RSI filter
Color-coded background for market regime visualization
This is not just another RSI — it’s a complete, next-gen momentum tool designed for traders who want accuracy, adaptability, and confirmation in every signal.
Search in scripts for "ai"
Prime NumbersPrime Numbers highlights prime numbers (no surprise there 😅), tokens and the recent "active" feature in "input".
🔸 CONCEPTS
🔹 What are Prime Numbers?
A prime number (or a prime) is a natural number greater than 1 that is not a product of two smaller natural numbers.
Wikipedia: Prime number
🔹 Prime Factorization
The fundamental theorem of arithmetic states that every integer larger than 1 can be written as a product of one or more primes. More strongly, this product is unique in the sense that any two prime factorizations of the same number will have the same number of copies of the same primes, although their ordering may differ. So, although there are many different ways of finding a factorization using an integer factorization algorithm, they all must produce the same result. Primes can thus be considered the "basic building blocks" of the natural numbers.
Wikipedia: Fundamental theorem of arithmetic
Math Is Fun: Prime Factorization
We divide a given number by Prime Numbers until only Primes remain.
Example:
24 / 2 = 12 | 24 / 3 = 8
12 / 3 = 4 | 8 / 2 = 4
4 / 2 = 2 | 4 / 2 = 2
|
24 = 2 x 3 x 2 | 24 = 3 x 2 x 2
or | or
24 = 2² x 3 | 24 = 2² x 3
In other words, every natural/integer number above 1 has a unique representation as a product of prime numbers, no matter how the number is divided. Only the order can change, but the factors (the basic elements) are always the same.
🔸 USAGE
The Prime Numbers publication contains two use cases:
Prime Factorization: performed on "close" prices, or a manual chosen number.
List Prime Numbers: shows a list of Prime Numbers.
The other two options are discussed in the DETAILS chapter:
Prime Factorization Without Arrays
Find Prime Numbers
🔹 Prime Factorization
Users can choose to perform Prime Factorization on close prices or a manually given number.
❗️ Note that this option only applies to close prices above 1, which are also rounded since Prime Factorization can only be performed on natural (integer) numbers above 1.
In the image below, the left example shows Prime Factorization performed on each close price for the latest 50 bars (which is set with "Run script only on 'Last x Bars'" -> 50).
The right example shows Prime Factorization performed on a manually given number, in this case "1,340,011". This is done only on the last bar.
When the "Source" option "close price" is chosen, one can toggle "Also current price", where both the historical and the latest current price are factored. If disabled, only historical prices are factored.
Note that, depending on the chosen options, only applicable settings are available, due to a recent feature, namely the parameter "active" in settings.
Setting the "Source" option to "Manual - Limited" will factorize any given number between 1 and 1,340,011, the latter being the highest value in the available arrays with primes.
Setting to "Manual - Not Limited" enables the user to enter a higher number. If all factors of the manual entered number are in the 1 - 1,340,011 range, these factors will be shown; however, if a factor is higher than 1,340,011, the calculation will stop, after which a warning is shown:
The calculated factors are displayed as a label where identical factors are simplified with an exponent notation in superscript.
For example 2 x 2 x 2 x 5 x 7 x 7 will be noted as 2³ x 5 x 7²
🔹 List Prime Numbers
The "List Prime Numbers" option enables users to enter a number, where the first found Prime Number is shown, together with the next x Prime Numbers ("Amount", max. 200)
The highest shown Prime Number is 1,340,011.
One can set the number of shown columns to customize the displayed numbers ("Max. columns", max. 20).
🔸 DETAILS
The Prime Numbers publication consists out of 4 parts:
Prime Factorization Without Arrays
Prime Factorization
List Prime Numbers
Find Prime Numbers
The usage of "Prime Factorization" and "List Prime Numbers" is explained above.
🔹 Prime Factorization Without Arrays
This option is only there to highlight a hurdle while performing Prime Factorization.
The basic method of Prime Factorization is to divide the base number by 2, 3, ... until the result is an integer number. Continue until the remaining number and its factors are all primes.
The division should be done by primes, but then you need to know which one is a prime.
In practice, one performs a loop from 2 to the base number.
Example:
Base_number = input.int(24)
arr = array.new()
n = Base_number
go = true
while go
for i = 2 to n
if n % i == 0
if n / i == 1
go := false
arr.push(i)
label.new(bar_index, high, str.tostring(arr))
else
arr.push(i)
n /= i
break
Small numbers won't cause issues, but when performing the calculations on, for example, 124,001 and a timeframe of, for example, 1 hour, the script will struggle and finally give a runtime error.
How to solve this?
If we use an array with only primes, we need fewer calculations since if we divide by a non-prime number, we have to divide further until all factors are primes.
I've filled arrays with prime numbers and made libraries of them. (see chapter "Find Prime Numbers" to know how these primes were found).
🔹 Tokens
A hurdle was to fill the libraries with as many prime numbers as possible.
Initially, the maximum token limit of a library was 80K.
Very recently, that limit was lifted to 100K. Kudos to the TradingView developers!
What are tokens?
Tokens are the smallest elements of a program that are meaningful to the compiler. They are also known as the fundamental building blocks of the program.
I have included a code block below the publication code (// - - - Educational (2) - - - ) which, if copied and made to a library, will contain exactly 100K tokens.
Adding more exported functions will throw a "too many tokens" error when saving the library. Subtracting 100K from the shown amount of tokens gives you the amount of used tokens for that particular function.
In that way, one can experiment with the impact of each code addition in terms of tokens.
For example adding the following code in the library:
export a() => a = array.from(1) will result in a 100,041 tokens error, in other words (100,041 - 100,000) that functions contains 41 tokens.
Some more examples, some are straightforward, others are not )
// adding these lines in one of the arrays results in x tokens
, 1 // 2 tokens
, 111, 111, 111 // 12 tokens
, 1111 // 5 tokens
, 111111111 // 10 tokens
, 1111111111111111111 // 20 tokens
, 1234567890123456789 // 20 tokens
, 1111111111111111111 + 1 // 20 tokens
, 1111111111111111111 + 8 // 20 tokens
, 1111111111111111111 + 9 // 20 tokens
, 1111111111111111111 * 1 // 20 tokens
, 1111111111111111111 * 9 // 21 tokens
, 9999999999999999999 // 21 tokens
, 1111111111111111111 * 10 // 21 tokens
, 11111111111111111110 // 21 tokens
//adding these functions to the library results in x tokens
export f() => 1 // 4 tokens
export f() => v = 1 // 4 tokens
export f() => var v = 1 // 4 tokens
export f() => var v = 1, v // 4 tokens
//adding these functions to the library results in x tokens
export a() => const arraya = array.from(1) // 42 tokens
export a() => arraya = array.from(1) // 42 tokens
export a() => a = array.from(1) // 41 tokens
export a() => array.from(1) // 32 tokens
export a() => a = array.new() // 44 tokens
export a() => a = array.new(), a.push(1) // 56 tokens
What if we could lower the amount of tokens, so we can export more Prime Numbers?
Look at this example:
829111, 829121, 829123, 829151, 829159, 829177, 829187, 829193
Eight numbers contain the same number 8291.
If we make a function that removes recurrent values, we get fewer tokens!
829111, 829121, 829123, 829151, 829159, 829177, 829187, 829193
//is transformed to:
829111, 21, 23, 51, 59, 77, 87, 93
The code block below the publication code (// - - - Educational (1) - - - ) shows how these values were reduced. With each step of 100, only the first Prime Number is shown fully.
This function could be enhanced even more to reduce recurrent thousands, tens of thousands, etc.
Using this technique enables us to export more Prime Numbers. The number of necessary libraries was reduced to half or less.
The reduced Prime Numbers are restored using the restoreValues() function, found in the library fikira/Primes_4.
🔹 Find Prime Numbers
This function is merely added to show how I filled arrays with Prime Numbers, which were, in turn, added to libraries (after reduction of recurrent values).
To know whether a number is a Prime Number, we divide the given number by values of the Primes array (Primes 2 -> max. 1,340,011). Once the division results in an integer, where the divisor is smaller than the dividend, the calculation stops since the given number is not a Prime.
When we perform these calculations in a loop, we can check whether a series of numbers is a Prime or not. Each time a number is proven not to be a Prime, the loop starts again with a higher number. Once all Primes of the array are used without the result being an integer, we have found a new Prime Number, which is added to the array.
Doing such calculations on one bar will result in a runtime error.
To solve this, the findPrimeNumbers() function remembers the index of the array. Once a limit has been reached on 1 bar (for example, the number of iterations), calculations will stop on that bar and restart on the next bar.
This spreads the workload over several bars, making it possible to continue these calculations without a runtime error.
The result is placed in log.info() , which can be copied and pasted into a hardcoded array of Prime Number values.
These settings adjust the amount of workload per bar:
Max Size: maximum size of Primes array.
Max Bars Runtime: maximum amount of bars where the function is called.
Max Numbers To Process Per Bar: maximum numbers to check on each bar, whether they are Prime Numbers.
Max Iterations Per Bar: maximum loop calculations per bar.
🔹 The End
❗️ The code and description is written without the help of an LLM, I've only used Grammarly to improve my description (without AI :) )

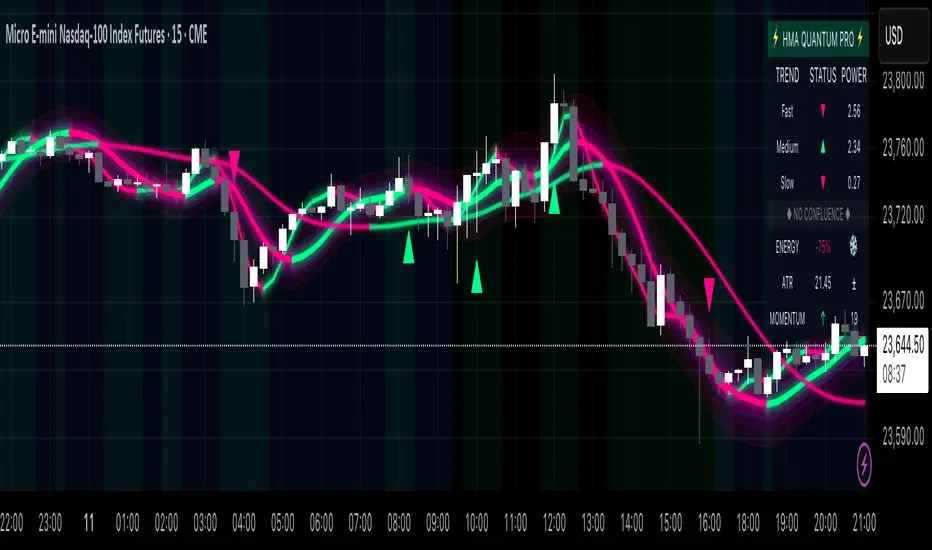
Hull Moving Average Quantum Pro - Advanced Trading SystemThe Hull Moving Average Quantum Pro is a next-generation technical analysis tool that combines the legendary smoothness of Alan Hull's HMA formula with advanced quantum field visualization technology. This professional-grade indicator features three synchronized Hull Moving Average periods working in harmony to identify high-probability trading opportunities.
🎯 KEY FEATURES:
• Multi-Timeframe HMA Confluence - Triple HMA system (9, 21, 55 periods) for comprehensive trend analysis
• Quantum Field Visualization - Fibonacci-based dynamic support/resistance bands with 0.618, 1.0, and 1.618 ratios
• Energy Flow Momentum - Real-time visual representation of market momentum and directional bias
• Confluence Zone Detection - Automatically highlights areas where multiple HMAs converge for high-probability setups
• Professional Holographic Dashboard - Real-time trend strength, momentum, and market status display
• Three Visual Themes - Dark Intergalactic (Quantum Trading), Light Minimal (Clean Charts), Pro Modern (Low Saturation)
⚡ WHAT MAKES IT UNIQUE:
Unlike traditional moving average indicators, the HMA Quantum Pro eliminates lag while maintaining smoothness, providing traders with faster signals without sacrificing reliability. The quantum field visualization adds a new dimension to price action analysis by creating dynamic zones that adapt to market volatility.
📊 PERFECT FOR:
• Day Trading & Scalping - Fast HMA (9) provides quick entry/exit signals
• Swing Trading - Medium HMA (21) confirms trend continuation
• Position Trading - Slow HMA (55) identifies major trend changes
• All Markets - Forex, Stocks, Crypto, Futures, Indices
🔧 ADVANCED SETTINGS:
• Customizable HMA periods for any trading style
• Adjustable confluence threshold for precision filtering
• Visual intensity control for optimal chart clarity
• Field transparency settings for multi-indicator setups
💡 HOW TO USE:
1. Strong Bullish Signal - All three HMAs aligned upward with price above quantum fields
2. Strong Bearish Signal - All three HMAs aligned downward with price below quantum fields
3. Confluence Zones - High probability reversal/continuation areas
4. Energy Flow - Confirms momentum direction and strength
⭐ FREE VERSION FEATURES:
This free version includes all visual features and calculations. Premium version (coming soon) will add advanced alerts, multi-timeframe analysis, and AI-powered trade suggestions.
Created by professional traders for serious market participants. The Hull Moving Average formula was created by Alan Hull to reduce lag while maintaining smoothness - this indicator enhances that foundation with modern visualization technology.
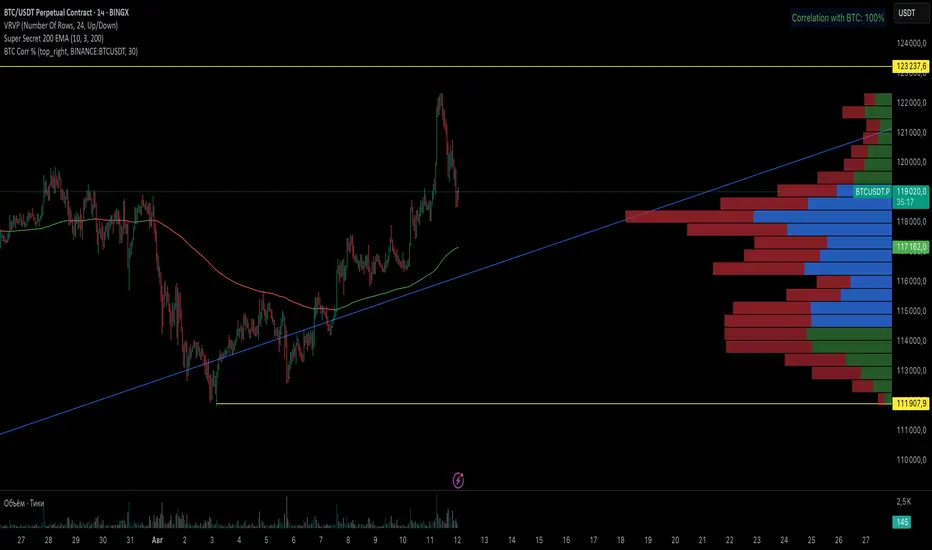
BTC Correlation PercentagePurpose
This indicator displays the correlation percentage between the current trading instrument and Bitcoin (BTC/USDT) as a text label on the chart. It helps traders quickly assess how closely an asset's price movements align with Bitcoin's fluctuations.
Key Features
Precise Calculation: Shows correlation as a percentage with one decimal place (e.g., 25.6%).
Customizable Appearance: Allows adjustment of colors, position, and calculation period.
Clean & Simple: Displays only essential information without cluttering the chart.
Universal Compatibility: Works on any timeframe and with any trading pair.
Input Settings
Core Parameters:
BTC Symbol – Ticker for Bitcoin (default: BINANCE:BTCUSDT).
Correlation Period – Number of bars used for calculation (default: 50 candles).
Show Correlation Label – Toggle visibility of the correlation label.
Visual Customization:
Text Color – Label text color (default: white).
Background Color – Label background color (default: semi-transparent blue).
Border Color – Border color around the label (default: gray).
Label Position – Where the label appears on the chart (default: top-right).
Interpreting Correlation Values
70% to 100% → Strong positive correlation (asset moves in sync with BTC).
30% to 70% → Moderate positive correlation.
-30% to 30% → Weak or no correlation.
-70% to -30% → Moderate negative correlation (asset moves opposite to BTC).
-100% to -70% → Strong negative correlation.
Practical Use Cases
For Altcoins: A correlation above 50% suggests high dependence on Bitcoin’s price action.
For Futures Trading: Helps assess systemic risks tied to BTC movements.
During High Volatility: Determines whether an asset’s price change is driven by its own factors or broader market trends.
How It Works
The indicator recalculates automatically with each new candle. For the most reliable results, it is recommended for use on daily or higher timeframes.
This tool provides traders with a quick, visual way to gauge Bitcoin’s influence on other assets, improving decision-making in crypto markets. 🚀
This response is AI-generated, for reference only.
New chat
ADVANCED EMA RIBBON SUITE PRO [Multi-Timeframe + Alerts + Dash]🎯 ADVANCED EMA RIBBON SUITE PRO
📊 DESCRIPTION:
The most comprehensive EMA Ribbon indicator on TradingView, featuring 14 customizable
EMAs (5-200), multi-timeframe analysis, gradient ribbon visualization, smart alerts,
and a real-time dashboard. Perfect for trend following, scalping, and swing trading.
🔥 KEY FEATURES:
• 14 EMAs with Fibonacci sequence option (5, 8, 13, 21, 34, 55, 89, 144, 200)
• Multi-Timeframe (MTF) analysis - see higher timeframe trends
• Dynamic gradient ribbon with trend-based coloring
• Golden Cross & Death Cross detection with alerts
• Professional themes (Dark/Light) with 6 visual styles
• Real-time information dashboard
• Customizable transparency and colors
• Trend strength visualization
• Price position analysis
• Smart alert system for all major crossovers
📈 USE CASES:
• Trend Identification: Ribbon expansion/contraction shows trend strength
• Entry/Exit Signals: EMA crossovers provide clear trade signals
• Support/Resistance: EMAs act as dynamic S/R levels
• Multi-Timeframe Confluence: Combine timeframes for higher probability trades
• Scalping: Use faster EMAs (5-20) for quick trades
• Swing Trading: Focus on 50/200 EMAs for position trades
🎯 TRADING STRATEGIES:
1. Ribbon Squeeze: Trade breakouts when ribbon contracts
2. Golden/Death Cross: Major trend reversals at 50/200 crosses
3. Price Above/Below: Long when price above most EMAs, short when below
4. MTF Confluence: Trade when multiple timeframes align
5. Dynamic S/R: Use EMAs as trailing stop levels
⚡ OPTIMAL SETTINGS:
• Scalping: 5, 8, 13, 21 EMAs on 1-5 min charts
• Day Trading: Full ribbon on 15-60 min charts
• Swing Trading: Focus on 50, 100, 200 EMAs on daily charts
• Position Trading: Use weekly timeframe with monthly MTF
📌 KEYWORDS:
EMA, Exponential Moving Average, Ribbon, Multi-Timeframe, MTF, Golden Cross,
Death Cross, Trend Following, Scalping, Swing Trading, Dashboard, Alerts,
Support Resistance, Fibonacci, Professional, Advanced, Suite, Indicator
*Created using PineCraft AI (Link in Bio)

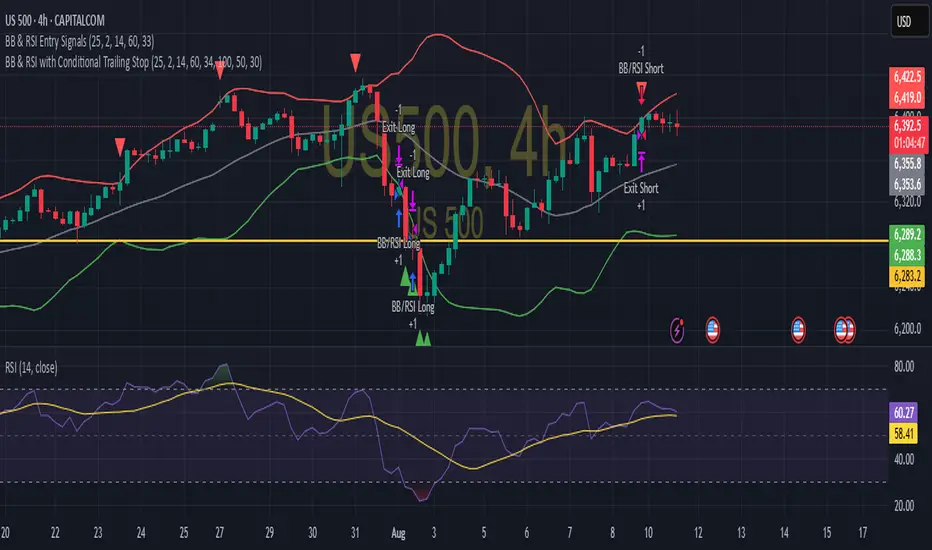
BB & RSI Trailing Stop StrategySimple BB & RSI generated using AI, gets 60% on S&P 500 with the right settings
KIT_ALL_VOTE_INDICADORIndicator developed to consolidate and display the voting results of multiple neural networks in real time on the chart.
It calculates the number of buy and sell signals from various AI instances and presents a consolidated view to assist in decision-making.
Ideal for algorithmic trading strategies and monitoring EAs that use voting logic.
Main features:
Displays the total count of buy and sell votes on the chart.
Automatically updates on each new candle or tick.
Can be used together with the SuperNeural1 EA or other systems based on voting.
Recommended asset: XAUUSD or any pair with high volatility.
Suggested timeframe: M1 to H1.

Monthly High/Low & % Move By Ai Trade LabYou can have idea How much it moved Monthly. Just Change it to Monthly

Multi-Timeframe SFP + SMTImportant: Please Read First
This indicator is not a "one size fits all" solution. It is a professional and complex tool that requires you to learn how to use it, in addition to backtesting different settings to discover what works best for your specific trading style and the assets you trade. The default settings provided are my personal preferences for trading higher-timeframe setups, but you are encouraged to experiment and find your own optimal configuration.
Please note that while this initial version is solid, it may still contain small errors or bugs. I will be actively working on improving the indicator over time. Also, be aware that the script is not written for maximum efficiency and may be resource-intensive, but this should not pose a problem for most users.
The source code for this indicator is open. If you truly want to understand precisely how all the logic works, you can copy and paste the code into an AI assistant like Gemini or ChatGPT and ask it to explain any part of the script to you.
Author's Preferred Settings (Guideline)
As a starting point, here are the settings I personally use for my trading:
SFP Timeframe: 4-Hour (Strength: 5-5)
Max Lookback: 35 Bars
Raid Expiration: 1 Bar
SFP Lines Limit: 1
SMT Timeframe 1: 30-Minute (Strength: 2-2) with 3-Minute LTF Detection.
SMT Timeframe 2: 15-Minute (Strength: 3-3) with 3-Minute LTF Detection.
SMT Timeframe 3: 1-Hour (Strength: 1-1) with 3-Minute LTF Detection.
SMT Timeframe 4: 15-Minute (Strength: 1-1) with 3-Minute LTF Detection.
Multi-Timeframe SMT: An Overview
This indicator is a powerful tool designed to identify high-probability trading setups by combining two key institutional concepts: Swing Failure Patterns (SFP) on a higher timeframe and Smart Money Technique (SMT) divergences on a lower timeframe. A key feature is the ability to configure and run up to four independent SMT analyses simultaneously, allowing you to monitor for divergences across multiple timeframes (e.g., 15m, 1H, 4H) from a single indicator.
Its primary purpose is to generate automated signals through TradingView's alert system. By setting up alerts, the script runs server-side, monitoring the market for you. When a setup presents itself, it will send a push notification to your device, allowing you to personally evaluate the trade without being tied to your screen.
The Strategy: HTF Liquidity Sweeps into LTF SMT
The core strategy is built on a classic institutional trading model:
Wait for a liquidity sweep on a significant high timeframe (e.g., 4-hour, Daily).
Once liquidity is taken, look for a confirmation of a shift in market structure on a lower timeframe.
This indicator uses an SMT divergence as that confirmation signal, indicating that smart money may be stepping in to reverse the price.
How It Works: The Two-Step Process
The indicator's logic follows a precise two-step process to generate a signal:
Step 1: The Swing Failure Pattern (SFP)
First, the indicator identifies a high-timeframe liquidity sweep. This is configured in the "Swing Failure Pattern (SFP) Timeframe" settings.
It looks for a candle that wicks above a previous high (or below a previous low) but then closes back within the range of that pivot. This action is known as a "raid" or a "swing failure," suggesting the move failed to find genuine momentum.
Step 2: The SMT Divergence
The moment a valid SFP is confirmed, the indicator's multiple SMT engines activate.
Each engine begins monitoring the specific SMT timeframe you have configured (e.g., "SMT Timeframe 1," "SMT Timeframe 2," etc.) for a Smart Money Technique (SMT) divergence.
An SMT divergence occurs when two closely correlated assets fail to move in sync. For example, after a raid on a high, Asset A makes a new high, but Asset B fails to do so. This disagreement suggests weakness and a potential reversal.
When the script finds this divergence, it plots the SMT line and triggers an alert.
The Power of Alerts
The true strength of this indicator lies in its alert capabilities. You can create alerts for both unconfirmed and confirmed SMTs.
Enable Alerts LTF Detection: These alerts trigger when an unconfirmed, potential SMT is spotted on the lower "LTF Detection" timeframe. While not yet confirmed, these early alerts can notify you of a potential move before it fully happens, allowing you to be ahead of the curve and find the best possible trade entries.
Enable Alerts Confirmed SMT: These alerts trigger only when a permanent, confirmed SMT line is plotted on your chosen SMT timeframe. These signals are more reliable but occur later than the early detection alerts.
Key Concepts Explained
What is Pivot Strength?
Pivot Strength determines how significant a high or low needs to be to qualify as a valid structural point. A setting of 5-5, for example, means that for a candle's high to be considered a valid pivot high, its high must be higher than the highs of the 5 candles to its left and the 5 candles to its right.
Higher Strength (e.g., 5-5, 8-8): Creates fewer, but more significant, pivots. This is ideal for identifying major structural highs and lows on higher timeframes.
Lower Strength (e.g., 2-2, 3-3): Creates more pivots, making it suitable for identifying the smaller shifts in momentum on lower timeframes.
Raid Expiration & Validity
An SFP signal is not valid forever. The "Raid Expiration" setting determines how many SFP timeframe bars can pass after a raid before that signal is considered "stale" and can no longer be used to validate an SMT. This ensures your SMT divergences are always in response to recent liquidity sweeps.
Why You Must Be on the Right Chart Timeframe to See SMT Lines
Pine Script™ has a fundamental rule: an indicator running on a chart can only "see" the bars of that chart's timeframe or higher.
When the SMT logic is set to the 15-minute timeframe, it calculates its pivots based on 15-minute data. To accurately plot lines connecting these pivots, you must be on a 15-minute chart or lower (e.g., 5-minute, 1-minute).
If you are on a higher timeframe chart, like the 1-hour, the 15-minute bars do not exist on that chart, so the indicator has no bars to draw the lines on.
This is precisely why the alert system is so powerful. You can set your alert to run on the 15-minute timeframe, and TradingView's servers will monitor that timeframe for you, sending a notification regardless of what chart you are currently viewing.

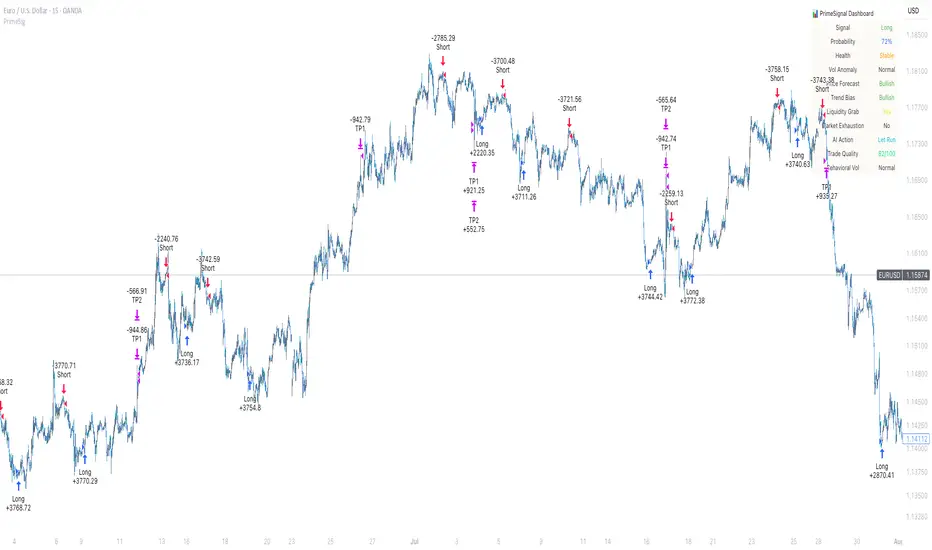
PrimeSignal ProPrimeSignal Pro is a premium-grade, AI-augmented trading system tailored for professionals. It combines advanced multi-timeframe analysis, dynamic volume behavior modeling, and precision signal tracking—delivered through a luxury-grade customizable dashboard.
Built for serious traders who demand performance, clarity, and edge.
⚠️ Currently free — future access may be subscription-based as features evolve.
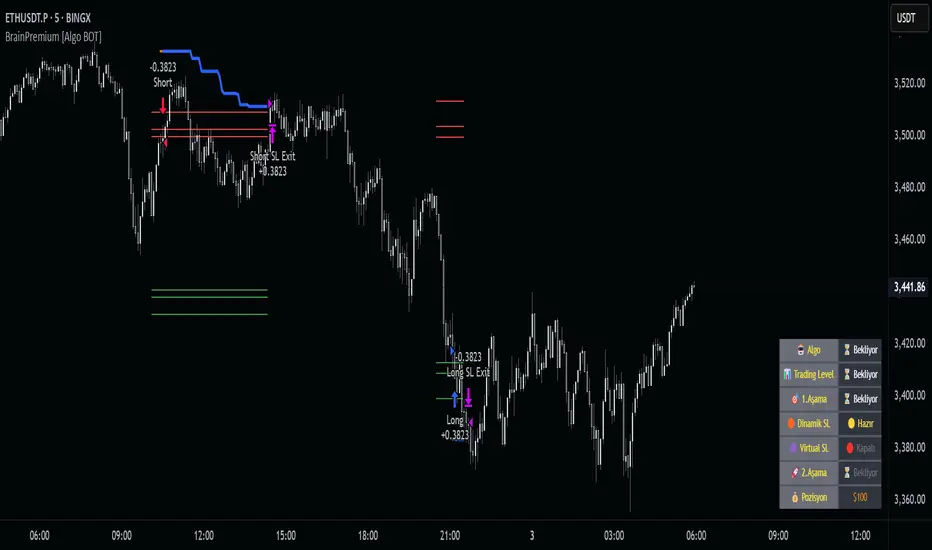
Brain Premium [ALGO]💡 Brain Premium ALGO
Brainpremium ALGO is a strategy algorithm that analyzes a two-phase regional liquidity structure and only opens positions on price breakouts occurring within these liquidity zones.
This system is developed based on the market experience of manual traders and automatically executes trade decisions using AI-like rules and specific triggers.
💡 Two-Phase Liquidity-Based Entry Strategy
This strategy operates by detecting liquidity sweep zones and confirmed reversal signals:
🔹 Phase 1 – Liquidity Sweep:
Price is expected to sweep areas where equal highs/lows or liquidity clusters exist. These zones are considered potential reversal levels.
🔹 Phase 2 – Confirmed Entry:
After liquidity is swept, entries are triggered only by confirmed reversal signals such as structural breaks, inside bars, or breakouts in the opposite direction.
✅ Entries are triggered only when liquidity and reversal confirmation occur simultaneously.
🎯 This approach targets high-probability, low-risk trades.
⚙️ Key Features
🔍 Dynamic Liquidity Detection — Automatically identifies liquidity zones.
🧩 Modular Entry Options (1–2–3) — Allows opening positions via different strategy paths.
🛡️ Dynamic Stop Loss System — Stop Loss adjusts as price moves favorably.
📈 Advanced Risk Management — Adjustable Take Profit, Stop Loss, leverage, balance, and mode.
🔔 JSON Alert Support — Connects to platforms like BingX via webhook.
🧾 Information Panel — Displays real-time trade data and strategy status.
📊 Backtest & Default Settings
Strategy tests are conducted with realistic and sustainable parameters:
Parameter Value
Trading Balance: $100 (%10 of total wallet)
Leverage: 10x
Stop Loss: 1%
Take Profit Type : High TP (optional: Low and Risky also available)
Entry Option 1 (optional: 2 and 3 also available)
Mode: NORMAL
Commission 0.05%
Dynamic Stop Loss: Enabled
Timeframe: 5 minute
Pair ETH/USDT
Duration: 30 days
🧭 Usage Instructions
Add Brain Premium ALGO to your TradingView chart.
Set position size, leverage, and SL/TP levels from the settings panel.
Select entry option (1, 2, or 3).
Activate backtesting and alert systems to monitor the strategy.
⚠️ Disclaimer
This strategy is not financial advice. Past performance does not guarantee future results. Trade only with capital you can afford to risk and always test thoroughly in a demo environment first.
Lorentzian Key Support and Resistance Level Detector [mishy]🧮 Lorentzian Key S/R Levels Detector
Advanced Support & Resistance Detection Using Mathematical Clustering
The Problem
Traditional S/R indicators fail because they're either subjective (manual lines), rigid (fixed pivots), or break when price spikes occur. Most importantly, they don't tell you where prices actually spend time, just where they touched briefly.
The Solution: Lorentzian Distance Clustering
This indicator introduces a novel approach by using Lorentzian distance instead of traditional Euclidean distance for clustering. This is groundbreaking for financial data analysis.
Data Points Clustering:
🔬 Why Euclidean Distance Fails in Trading
Traditional K-means uses Euclidean distance:
• Formula: distance = (price_A - price_B)²
• Problem: Squaring amplifies differences exponentially
• Real impact: One 5% price spike has 25x more influence than a 1% move
• Result: Clusters get pulled toward outliers, missing real support/resistance zones
Example scenario:
Prices: ← flash spike
Euclidean: Centroid gets dragged toward 150
Actual S/R zone: Around 100 (where prices actually trade)
⚡ Lorentzian Distance: The Game Changer
Our approach uses Lorentzian distance:
• Formula: distance = log(1 + (price_difference)² / σ²)
• Breakthrough: Logarithmic compression keeps outliers in check
• Real impact: Large moves still matter, but don't dominate
• Result: Clusters focus on where prices actually spend time
Same example with Lorentzian:
Prices: ← flash spike
Lorentzian: Centroid stays near 100 (real trading zone)
Outlier (150): Acknowledged but not dominant
🧠 Adaptive Intelligence
The σ parameter isn't fixed,it's calculated from market disturbance/entropy:
• High volatility: σ increases, making algorithm more tolerant of large moves
• Low volatility: σ decreases, making algorithm more sensitive to small changes
• Self-calibrating: Adapts to any instrument or market condition automatically
Why this matters: Traditional methods treat a 2% move the same whether it's in a calm or volatile market. Lorentzian adapts the sensitivity based on current market behavior.
🎯 Automatic K-Selection (Elbow Method)
Instead of guessing how many S/R levels to draw, the indicator:
• Tests 2-6 clusters and calculates WCSS (tightness measure)
• Finds the "elbow" - where adding more clusters stops helping much
• Uses sharpness calculation to pick the optimal number automatically
Result: Perfect balance between detail and clarity.
How It Works
1. Collect recent closing prices
2. Calculate entropy to adapt to current market volatility
3. Cluster prices using Lorentzian K-means algorithm
4. Auto-select optimal cluster count via statistical analysis
5. Draw levels at cluster centers with deviation bands
📊 Manual K-Selection Guide (Using WCSS & Sharpness Analysis)
When you disable auto-selection, use both WCSS and Sharpness metrics from the analysis table to choose manually:
What WCSS tells you:
• Lower WCSS = tighter clusters = better S/R levels
• Higher WCSS = scattered clusters = weaker levels
What Sharpness tells you:
• Higher positive values = optimal elbow point = best K choice
• Lower/negative values = poor elbow definition = avoid this K
• Measures the "sharpness" of the WCSS curve drop-off
Decision strategy using both metrics:
K=2: WCSS = 150.42 | Sharpness = - | Selected =
K=3: WCSS = 89.15 | Sharpness = 22.04 | Selected = ✓ ← Best choice
K=4: WCSS = 76.23 | Sharpness = 1.89 | Selected =
K=5: WCSS = 73.91 | Sharpness = 1.43 | Selected =
Quick decision rules:
• Pick K with highest positive Sharpness (indicates optimal elbow)
• Confirm with significant WCSS drop (30%+ reduction is good)
• Avoid K values with negative or very low Sharpness (<1.0)
• K=3 above shows: Big WCSS drop (41%) + High Sharpness (22.04) = Perfect choice
Why this works:
The algorithm finds the "elbow" where adding more clusters stops being useful. High Sharpness pinpoints this elbow mathematically, while WCSS confirms the clustering quality.
Elbow Method Visualization:
Traditional clustering problems:
❌ Price spikes distort results
❌ Fixed parameters don't adapt
❌ Manual tuning is subjective
❌ No way to validate choices
Lorentzian solution:
☑️ Outlier-resistant distance metric
☑️ Entropy-based adaptation to volatility
☑️ Automatic optimal K selection
☑️ Statistical validation via WCSS & Sharpness
Features
Visual:
• Color-coded levels (red=highest resistance, green=lowest support)
• Optional deviation bands showing cluster spread
• Strength scores on labels: Each cluster shows a reliability score.
• Higher scores (0.8+) = very strong S/R levels with tight price clustering
• Lower scores (0.6-0.7) = weaker levels, use with caution
• Based on cluster tightness and data point density
• Clean line extensions and labels
Analytics:
• WCSS analysis table showing why K was chosen
• Cluster metrics and statistics
• Real-time entropy monitoring
Control:
• Auto/manual K selection toggle
• Customizable sample size (20-500 bars)
• Show/hide bands and metrics tables
The Result
You get mathematically validated S/R levels that focus on where prices actually cluster, not where they randomly spiked. The algorithm adapts to market conditions and removes guesswork from level selection.
Best for: Traders who want objective, data-driven S/R levels without manual chart analysis.
Credits: This script is for educational purposes and is inspired by the work of @ThinkLogicAI and an amazing mentor @DskyzInvestments . It demonstrates how Lorentzian geometrical concepts can be applied not only in ML classification but also quite elegantly in clustering.


Pro Reversal Strategie - FinalCore Functionality Description
The "Pro Reversal Strategy" script is a comprehensive and highly customizable trading system for TradingView. Its core idea is based on a mean-reversion strategy, which aims to capitalize on price extremes where the price is likely to revert to its statistical mean. This script ist full AI generated. There ist no support and no financial advice.
To identify entry points, the script combines classic indicators like the RSI (to detect overbought and oversold conditions) and Bollinger Bands (to measure volatility extremes).
However, the script's strength lies in its confluence logic: a simple RSI or Bollinger Band signal is not enough to trigger a trade. Instead, a series of filters are applied to enhance the quality of the trade signals. These include:
Trend Filter: Trades are only taken in the direction of the higher-level trend (defined by a 200-period Moving Average).
Volatility and Volume Filter: ADX and volume analysis ensure that the market has sufficient momentum for a move.
Market Structure Analysis: Concepts like Fair Value Gaps (FVG), liquidity zones, and the Volume Profile (VRVP/POC) are used to place trades in high-probability zones.
Momentum Filter: Special "Vector Candles" confirm the strength of buyers or sellers at the moment of the signal.
Furthermore, the script offers advanced features for risk and trade management, including automatic position sizing based on a percentage risk and dynamic exit strategies like a breakeven stop and a trailing stop-loss (Chandelier ATR).
A detailed info panel visualizes all key metrics in real-time directly on the chart. Thanks to its versatile configuration options, the script can be adapted for various trading styles, including swing trading, day trading, and scalping.
Core Strategies & Filters (English)
Here is a breakdown of the specific strategies and confirmation filters used within the script:
RSI Mean Reversion: Uses the Relative Strength Index (RSI) to identify overbought (> rsiSellShort) and oversold (< rsiBuyLong) conditions, which serve as the primary trigger for a potential price reversal.
Bollinger Bands (BB) Volatility Filter: Trades are confirmed when the price touches or exceeds the outer Bollinger Bands. This indicates a move to a statistical extreme in terms of volatility, reinforcing the reversal thesis.
Trend Filter (200 SMA): Ensures that long trades are only considered in a general uptrend (price > SMA 200) and short trades in a downtrend (price < SMA 200), preventing trades against the dominant market direction.
ADX Trend Strength Filter: Utilizes the Average Directional Index (ADX) to confirm that a market is trending with sufficient strength. Trades are filtered out during weak or non-trending phases (adx < adxThreshold).
Volume Profile (VRVP / POC): Analyzes volume at specific price levels to identify high-volume nodes (Point of Control - POC). This acts as a filter to avoid entering trades directly into a zone of strong support or resistance.
Vector Candle Filter: Identifies "Vector Candles" – large, high-volume candles that close strongly near their high (bullish) or low (bearish). This custom filter confirms strong conviction behind the initial reversal signal.
Market Structure (FVG & Liquidity): Incorporates advanced price action concepts. It looks for entries after a liquidity zone above a previous high/low has been tapped (Liquidity Grab) or when price enters a Fair Value Gap (FVG), adding a layer of institutional trading logic.
Chart Pattern Recognition: Optionally identifies classic chart patterns like "W-Patterns" (Double Bottom), "M-Patterns" (Double Top), and Ascending Triangles to provide additional visual confirmation for traders.
Position Sizing (Risk %): Automatically calculates the trade size based on a user-defined percentage of the total equity (riskPct) and the distance to the stop-loss, ensuring consistent risk management for every trade.
Dynamic Exit Management: Implements advanced exit strategies beyond a fixed take-profit. This includes moving the stop-loss to Breakeven after a certain risk-to-reward ratio is met and using a Trailing Stop-Loss (e.g., Chandelier ATR) to lock in profits as a trade develops.

WaverVanir Alpha Reversal Scalper [ETF Eval Bot]🧠 Strategy Overview:
The WaverVanir Alpha Reversal Scalper is a precision-engineered futures trading bot designed to pass prop firm evaluations, specifically Elite Trader Funding (ETF) via Tradovate integration.
This scalping engine was developed after analyzing over 100+ evaluation trades, and is powered by institutional logic, volume behavior, and adaptive VWAP-based confluence.
🔍 Core Logic:
Directional Bias: Trades long only based on VWAP slope confirmation (to avoid funding-damaging shorts)
Entry Conditions:
Price deviates below VWAP standard deviation
Volume spike exceeds 1.5× 20-period average
Bullish reversal wick detected (smart money pattern)
Exit Management:
Stop Loss: 10-tick precision SL below local low
Take Profit: 2.5R static or dynamic trailing stop
Session Filter: Trades only between 9:00–14:00 ET, avoiding lunch and close traps
📊 Backtest Summary (ESU2025)
Metric Result
Net Profit $9,487.50
Profit Factor 1.66 (longs)
Sharpe Ratio 0.03
Sortino Ratio 0.042
Winning Bias Long-Only
Max Drawdown Under $3,000
Commissions $0 (sim tested)
🧪 Tested across March–July 2025 on CME Mini ES (ESU2025)
🔒 Short trades disabled after review: Net −$7,312.50 loss on shorts alone
✅ Profit factor improves > 60% post-optimization
🔄 Recent Optimizations
❌ Disabled unprofitable short setups
✅ VWAP slope filter added for institutional alignment
✅ Trailing stop logic added (activates after 1.5R)
⏱️ Session filter to reduce market noise
🧠 Designed For:
Passing ETF funding challenges quickly
Avoiding drawdown breaches with controlled risk
Running on TradingView with direct Tradovate integration
🚀 Execution-Ready
This bot runs natively on TradingView. Simply:
Add the Pine Script to your chart
Use a tradable symbol (e.g., ESU2025)
Create an alert using “Order fills”
✅ Enable auto-trading to Tradovate
📡 Learn More
🔗 Powered by VolanX Protocol, the AI-driven infrastructure layer of
🌐 WaverVanir International LLC – where institutional logic meets retail precision.
—
🧠 Want to upgrade this bot to include macros, adaptive entries, or launch in NQ/CL?
💬 Drop a comment or message — let’s build your funding empire.
#ES #Futures #ETF #Funding #PropFirm #TradingBot #VWAP #VolumeProfile #AlphaScalper #WaverVanir #VolanX


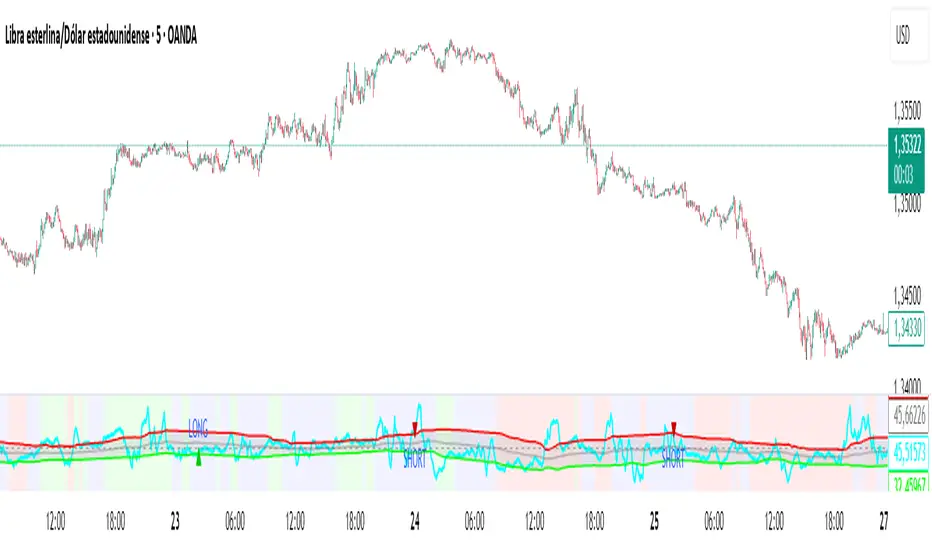
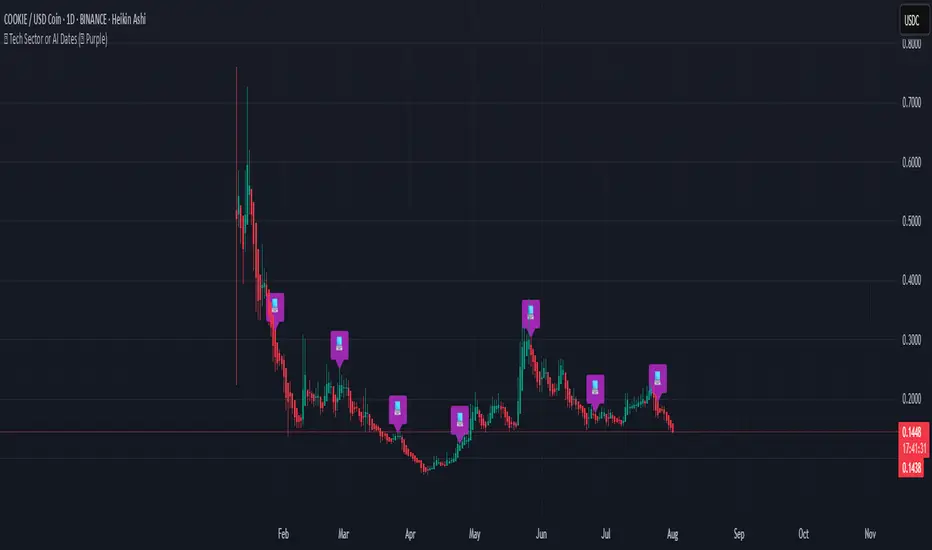
Market sentiment and cryptocurrency narratives📈 IDRA + PFLA: Crypto Market Sentiment & Narrative Flow
Uncover hidden opportunities and navigate the dynamic crypto landscape with IDRA + PFLA (Intraday Dynamic Risk Assessment + Public Flow & Liquidity Analysis). This powerful, two-in-one indicator suite is meticulously designed to provide you with a comprehensive understanding of market sentiment and identify active cryptocurrency narratives across different timeframes.
IDRA: Intraday Dynamic Risk Assessment (Daily & 4-Hour)
The IDRA component offers a unique perspective on overall market sentiment, helping you gauge risk appetite within the altcoin space.
Daily Sentiment Plot: Visualize the daily macro sentiment with a dedicated plot that fluctuates between zones of "High Risk (Euphoria)," "Low Risk (Opportunity)," "Very Low Risk (Panic/Opportunity)," and "Absolute Bottom (Max Despair)." Transparent zone fills make it easy to interpret the prevailing market mood.
Bitcoin/Altcoin Season Bar (4-Hour): At the bottom right of your chart, a dynamic bar visually represents the "Bitcoin Season" to "Altcoin Season" spectrum. This intuitive bar, updated every 4 hours, provides real-time insights into which side of the market is currently attracting more capital and attention. A white indicator line moves across the gradient, showing the current IDRA reading on a normalized 0-100 scale.
Customizable Normalization: Adjust the normalization period to fine-tune IDRA's sensitivity to historical market behavior.
Actionable Alerts: Set up alerts for IDRA's key levels (High, Low, Very Low, Absolute Bottom) to be notified of significant shifts in market sentiment, allowing you to react promptly to potential opportunities or threats.
PFLA: Public Flow & Liquidity Analysis (Daily)
The PFLA component provides a detailed breakdown of capital flows and dominance within key crypto narratives. It acts as a daily snapshot, showing you where the money is moving across different crypto sectors.
Ecosystem Performance: Track the daily performance of major ecosystems like Ethereum, Solana, and BNB Chain, observing their dominance and 24-hour capital flow changes.
Trending Categories: Stay ahead of the curve by monitoring the capital movements and dominance of hot narratives such as DePIN, AI, RWA, and MEME coins.
Layer 1 Insights: Gain a clear understanding of the broader Layer 1 landscape.
Consensus Mechanism Analysis : Compare the performance of Proof-of-Work (PoW) and Proof-of-Stake (PoS) coins.
Stablecoin Dominance: Keep an eye on the overall Stablecoin Dominance within the total crypto market, a crucial indicator of risk aversion or appetite.
Daily Snapshot : Each category displays its current dominance, today's capitalization (in billions), and the daily percentage change, all clearly color-coded (green for positive, red for negative).
Ideal for 4-Hour and Daily Timeframes
This indicator is specifically optimized for use on 4-hour and daily charts, providing both intraday and longer-term perspectives on market sentiment and narrative shifts. The IDRA bar updates every 4 hours for more immediate insights, while the PFLA table provides a daily comprehensive overview.
💡 How to Use It
Bias Confirmation: Use the IDRA plot to confirm your general bias on whether the altcoin market is in a phase of euphoria, fear, or panic.
Opportunity Identification: The "Opportunity" and "Extreme Panic" zones of the IDRA plot can signal opportune moments for accumulation.
Risk Management: The "High Risk/Euphoria" zone of the IDRA plot alerts you to be more cautious or consider profit-taking.
Capital Flow Analysis: The PFLA table instantly shows you which ecosystems and narratives are attracting or losing capital today, helping you identify the strongest trends or areas under pressure.
Bitcoin vs. Altcoin Season: The IDRA Bitcoin/Altcoin Season Bar visually indicates the current market phase.
When the white indicator line is closer to "Bitcoin Season" (left side of the bar), it suggests Bitcoin is outperforming altcoins, and capital is flowing into BTC or larger-cap assets for stability. This might be a time to prioritize Bitcoin trades or be cautious with altcoins.
When the white indicator line is closer to "Altcoin Season" (right side of the bar), it indicates altcoins are outperforming Bitcoin, and capital is rotating into the broader altcoin market, often in search of higher returns. This could signal a more favorable environment for altcoin trading.
Use this bar to quickly assess the broader market's risk appetite: generally, Bitcoin Season implies more risk-off sentiment, while Altcoin Season suggests more risk-on.
Customizable Alerts: Configure alerts on IDRA to receive notifications when the index enters or exits its key zones.
The "IDRA & PFLA Integrated" is an indispensable tool for any cryptocurrency investor or trader seeking a deep understanding of capital flow and altcoin market sentiment.
IDRA + PFLA empowers you with the data you need to make more informed trading and investment decisions in the fast-paced world of cryptocurrencies. Gain a distinct edge by understanding where the smart money is flowing and which narratives are gaining traction.
Please note: This indicator is private and requires an invitation to access.

Multi-Equity Performance TableThis indicator tracks 5 equities/stocks/crytpo across multiple timeframes: 24h, 1W, 1M, 3M, 6M, 1Y. You can use AI to modify the code to track more equities but then you will need to use less timeframes. I used Claude.ai to configure this code.

Inflection PointInflection Point - The Adaptive Confluence Reversal Engine
This is not just another peak and valley indicator; it is a complete and total reimagining of how market turning points are detected, qualified, and acted upon. Born from the foundational concepts explored in systems like my earlier creation, DAFE - Turning Point, Inflection Point is a ground-up engineering feat designed for the modern trader. It moves beyond static rules and simple pattern recognition into the realm of dynamic, multi-factor confluence analysis and adaptive machine learning.
Where other indicators provide a guess, Inflection Point provides a probability. It meticulously analyzes the market's deepest currents—momentum, exhaustion, and reversal velocity—and fuses them into a single, unified "Confluence Score." This is not a simple combination of indicators; it is an intelligent, weighted system where each component works in concert, creating an analytical engine that is orders of magnitude more sophisticated and reliable than any standard reversal tool.
Furthermore, Inflection Point learns. Through its advanced Adaptive Learning Engine, it constantly monitors its own performance, adjusting its confidence and selectivity in real-time based on its recent success rate. This allows it to adapt its behavior to any security, on any timeframe, with remarkable success.
Theoretical Foundation - Confluence Core
Inflection Point's predictive power does not come from a single, magical formula. It comes from the intelligent synthesis of three critical market phenomena, weighted and scored in real-time to generate a single, high-conviction probability rating.
1. Factor One: Pre-Reversal Momentum State (RSI Analysis)
Instead of reacting to a simple RSI cross, Inflection Point proactively scans for the build-up of momentum that precedes a reversal.
• Formulaic Concept: It measures the highest RSI value over a lookback period for peaks and the lowest RSI for valleys. A signal is only considered valid if significant momentum has been established before the turn, indicating a stretched market condition ripe for reversal.
• Asymmetric Sophistication: The engine uses different, optimized thresholds for bull and bear momentum, recognizing that markets often fall faster than they rise.
2. Factor Two: Volatility Exhaustion (Bollinger Band Analysis)
A true reversal often occurs when price makes a final, exhaustive push into unsustainable territory.
• Formulaic Concept: The engine detects when price has significantly pierced the outer Bollinger Bands. This is not just a touch, but a statistical deviation from the mean that signals volatility exhaustion, where the energy for the current move is likely depleted.
3. Factor Three: Reversal Strength (Rate of Change Analysis)
The character of a reversal matters. A sharp, decisive turn is more significant than a slow, meandering one.
• Formulaic Concept: Using a short-term Rate of Change (ROC), the engine measures the velocity of the reversal itself. A higher ROC score adds significant weight to the final probability, confirming that the new direction has conviction.
4. The Final Calculation: The Adaptive Learning Engine
This is the system's "brain." It maintains a history of its past signals and calculates its real-time win rate. This hitRate is then used to generate an adaptiveMultiplier.
• Self-Correction: In "Quality Control" mode, a high win rate makes the indicator more selective, demanding a higher probability score to issue a signal, thereby protecting streaks. A lower win rate makes it slightly less selective to ensure it continues learning from new market conditions.
• The result is a system that is not static, but a living, breathing tool that adapts its personality to the unique rhythm of any chart.
Why Inflection Point is a Paradigm Shift
Inflection Point is fundamentally different from other reversal indicators for three key reasons:
Confluence Over Isolation: Standard indicators look at one thing (e.g., RSI > 70). Inflection Point simultaneously analyzes momentum, volatility, and velocity, understanding that true reversals are a product of multiple converging factors. It answers not just "if," but "why" a reversal is likely.
Probabilistic Over Binary: Other tools give you a simple "yes" or "no." Inflection Point provides a probability score from 0-100, allowing you to gauge the conviction of every potential signal. This empowers you to differentiate between a weak setup and an A+ opportunity.
Adaptive Over Static: Every other indicator uses the same rules forever. Inflection Point's Adaptive Engine means it is constantly refining its own logic based on what is actually working in the current market, on the specific asset you are trading. It is tailored to the now.
The Inputs Menu - Your Command Center
Every setting is a lever of control, allowing you to tune the engine to your precise trading style and market focus.
🧠 Neural Core Engine
Analysis Depth: This is the primary lookback for the Bollinger Band and other core calculations. A shorter depth makes the indicator faster and more sensitive, ideal for scalping. A longer depth makes it slower and more stable, ideal for swing trading.
Minimum Probability %: This is your master signal filter. It sets the minimum Confluence Score required to plot a signal. Higher values (85-95) will give you only the highest-conviction A+ setups. Lower values (70-80) will show more potential opportunities.
🤖 Adaptive Neural Learning
Enable Adaptive Learning Engine: Toggles the entire learning system. Disabling it will make the indicator's logic static.
Peak/Valley Success Threshold (ATR): This defines what constitutes a "successful" trade for the learning engine. A value of 1.5 means price must move 1.5x the ATR in your favor for the signal to be marked as a win. Adjust this to match your personal take-profit strategy.
Adaptive Mode: This dictates how the engine uses its hitRate. "Quality Control" is recommended for its intelligent filtering. "Aggressive" will always boost signal scores, useful for finding more setups in a known, trending environment.
Asymmetric Balance: Allows you to apply a "boost" to either peak (short) or valley (long) signals. If you find the market you're trading has stronger long reversals, you can increase the "Valley Signal Boost" to catch them more effectively.
🛡️ Elite Filters
Market Noise Filter: An exceptional tool for avoiding choppy markets. It counts the number of directional changes in the last 5 bars. If the market is whipping back and forth too much, it will block the signal. Lower the "Max Direction Changes" to be extremely selective.
Volume Filter: Requires signal confirmation from a significant volume spike. The "Volume Multiplier" dictates how large this spike must be (e.g., 1.2 = 20% above average volume). This is invaluable for filtering out low-conviction moves in stocks and crypto.
The Dashboard - Your Analytical Co-Pilot
The dashboard is not just a set of numbers; it is a holistic overview of the market's health and the engine's current state.
Unified AI Score: This section provides the most critical, at-a-glance information. "Total Score" is the current probability reading, while "Quality" gives you a human-readable interpretation. "Win Rate" shows the real-time performance of the Adaptive Engine.
Order Flow (OFPI): This measures the "weight" of money behind recent price moves by analyzing price change relative to volume. A high positive OFPI suggests strong buying pressure, while a high negative value suggests strong selling pressure. It gives you a peek into the market's underlying flow.
Component Analysis: This allows you to see the individual "Peak" and "Valley" confidence scores before they are filtered, giving you insight into building momentum before a signal forms.
Market Structure: This panel assesses the broader environment. "HTF Trend" tells you the direction of the larger trend (based on EMAs), while "Vol Regime" tells you if the market is in a high, medium, or low volatility state. Use this to align your signals with the broader market context.
Filter & Engine Statistics: Available on the "Large" dashboard, this provides deep insight into how many signals are being blocked by your filters and the current status of the Adaptive Engine's multiplier.
The Visual Interface - A Symphony of Data
Every visual element on the chart is designed for instant interpretation and insight.
Signal Markers: Simple, clean triangles mark the exact bar of a valid signal. A box is drawn around the high/low of the signal bar to highlight the precise point of inflection.
Dynamic Support/Resistance Zones: These are the glowing lines on your chart. They are not static lines; they are dynamic levels that represent the current battlefield between buyers and sellers.
Cyber Cyan (Valley Blue): This is the current Support Zone. This is the price level the market is currently trying to defend.
Neural Pink (Peak Red): This is the current Resistance Zone. This is the price level the market is currently trying to break through.
Grey (Next Level): This line is a projection, based on the current momentum and the size of the S/R range, of where the next major level of conflict will likely be. It acts as a potential price target.
Development & Philosophy
Inflection Point was not assembled; it was engineered. It represents hundreds of hours of research into market dynamics, statistical analysis, and machine learning principles. The goal was to create a tool that moves beyond the limitations of traditional technical analysis, which often fails in modern, algorithm-driven markets. By building a system based on multi-factor confluence and self-adaptive logic, Inflection Point provides a quantifiable, statistical edge that is simply unattainable with simpler tools. This is the result of a relentless pursuit of a better, more intelligent way to trade.
Universal Applicability
The principles of momentum, exhaustion, and velocity are universal to all freely traded markets. Because of its adaptive core and robust filtering options, Inflection Point has proven to be exceptionally effective on any security (stocks, crypto, forex, indices, futures) and on any timeframe (from 1-minute scalping charts to daily swing trading charts).
" Markets are constantly in a state of uncertainty and flux and money is made by discounting the obvious and betting on the unexpected. "
— George Soros
Trade with insight. Trade with anticipation.
— Dskyz, for DAFE Trading Systems

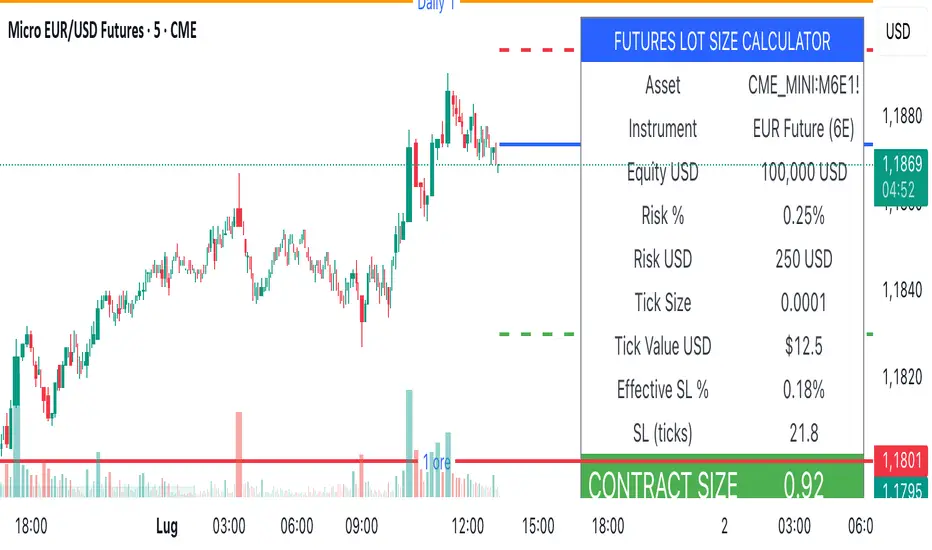
Lot Size Calculator (SL Percentage) - Futures ⚠️ IMPORTANT DISCLAIMER
This indicator is provided for educational and informational purposes only. The author assumes no responsibility for any financial losses, code errors, calculation mistakes, or trading decisions based on this tool. Use at your own risk and responsibility. Always manually verify calculations before opening real positions.
Contract size calculations are based on standard full-size futures contracts, not micro contracts (even though micro contracts are supported for identification).
Description
Money management tool for automatic calculation of optimal contract size (lot size) in futures trading. Supports over 50 futures instruments with pre-configured tick sizes and pip values for CME and other exchanges.
Supported Instruments
Currency Futures: 6J, 6E, 6B, 6A, 6C, 6S, 6N
Index Futures: ES, NQ, YM, RTY, MES, MNQ, MYM, M2K, NKD
Energy: CL, NG, HO, RB, QM
Metals: GC, SI, HG, MGC, SIL
Agricultural: ZC, ZS, ZW, HE, LE, ZO, ZR, ZM, ZL
Interest Rates: ZN, ZB, ZT, ZF
Crypto: MBT, MET
Others: VX
Main Parameters
Equity : Total available capital
Risk : Maximum risk percentage per trade
Stop Loss : Percentage distance of stop loss
Risk/Reward Ratio: Ratio to calculate take profit
Entry Price: Entry price (0 = current price)
Stop Loss Modes
Percentage Stop Loss (Use SL in % = ON):
Automatically calculates SL level as percentage from entry price
Example: Entry 100, SL 2% → Long SL at 98, Short SL at 102
Manual Stop Loss (Use SL in % = OFF):
Enter exact stop loss price directly
Greater precision for specific technical levels (support/resistance)
Interactive feature: You can drag the red stop loss line directly on the chart to modify the level in real-time
How to Use
Set equity and risk % according to your trading plan
Choose direction (Long/Short) and stop loss (percentage or price)
Enter entry price (optional)
Read the CONTRACT SIZE in the green table
Verify levels Entry/SL/TP on the graphic lines
Output
Information table with all parameters and highlighted CONTRACT SIZE
Graphic lines: Entry (blue), Stop Loss (red), Take Profit (green)
Configurable alerts with calculated values
Advantages
✅ Automatic calculation of optimal size
✅ Precise tick sizes for each instrument
✅ Systematic risk management
✅ Clear visual interface
✅ Multi-asset support on futures
Warnings
⚠️ Always verify that the instrument is recognized (no orange warning)
⚠️ Manually check calculations before trading
⚠️ Test in demo before using with real money
⚠️ Update regularly for any contract modifications
⚠️ DISCLAIMER IMPORTANTE
Questo indicatore è fornito esclusivamente a scopo educativo e informativo. L'autore non si assume alcuna responsabilità per eventuali perdite finanziarie, errori nel codice, calcoli errati o decisioni di trading basate su questo strumento. L'utilizzo è a proprio rischio e responsabilità. Si raccomanda di verificare sempre manualmente i calcoli prima di aprire posizioni reali.
I calcoli della dimensione del contratto sono basati su contratti futures standard full-size, non micro contratti (anche se i micro contratti sono supportati per l'identificazione).
Descrizione
Strumento di money management per il calcolo automatico della dimensione ottimale del contratto (lot size) nel trading di futures. Supporta oltre 50 strumenti futures con tick size e pip value pre-configurati per mercati CME e altri exchange.
Strumenti Supportati
Currency Futures: 6J, 6E, 6B, 6A, 6C, 6S, 6N
Index Futures: ES, NQ, YM, RTY, MES, MNQ, MYM, M2K, NKD
Energy: CL, NG, HO, RB, QM
Metals: GC, SI, HG, MGC, SIL
Agricultural: ZC, ZS, ZW, HE, LE, ZO, ZR, ZM, ZL
Interest Rates: ZN, ZB, ZT, ZF
Crypto: MBT, MET
Altri: VX
Parametri Principali
Equity : Capitale totale disponibile
Risk : Percentuale massima di rischio per trade
Stop Loss : Distanza percentuale dello stop loss
Risk/Reward Ratio: Rapporto per calcolare il take profit
Entry Price: Prezzo di entrata (0 = prezzo corrente)
Modalità Stop Loss
Stop Loss Percentuale (Use SL in % = ON):
Calcola automaticamente il livello SL come percentuale dal prezzo di entrata
Esempio: Entry 100, SL 2% → SL Long a 98, SL Short a 102
Stop Loss Manuale (Use SL in % = OFF):
Inserisci direttamente il prezzo esatto dello stop loss
Maggiore precisione per livelli tecnici specifici (supporti/resistenze)
Funzione interattiva: Puoi trascinare direttamente la linea rossa dello stop loss sul grafico per modificare il livello in tempo reale
Come Usare
Imposta equity e risk % secondo il tuo piano di trading
Scegli direzione (Long/Short) e stop loss (percentuale o prezzo)
Inserisci entry price (opzionale)
Leggi il CONTRACT SIZE nella tabella verde
Verifica i livelli Entry/SL/TP sulle linee grafiche
Output
Tabella informativa con tutti i parametri e il CONTRACT SIZE evidenziato
Linee grafiche: Entry (blu), Stop Loss (rosso), Take Profit (verde)
Alert configurabile con i valori calcolati
Vantaggi
✅ Calcolo automatico della size ottimale
✅ Tick size precisi per ogni strumento
✅ Risk management sistematico
✅ Interfaccia visiva chiara
✅ Supporto multi-asset su futures
Avvertenze
⚠️ Verifica sempre che lo strumento sia riconosciuto (no warning arancione)
⚠️ Controlla manualmente i calcoli prima di tradare
⚠️ Testa in demo prima dell'uso con denaro reale
⚠️ Aggiorna regolarmente per eventuali modifiche ai contratti
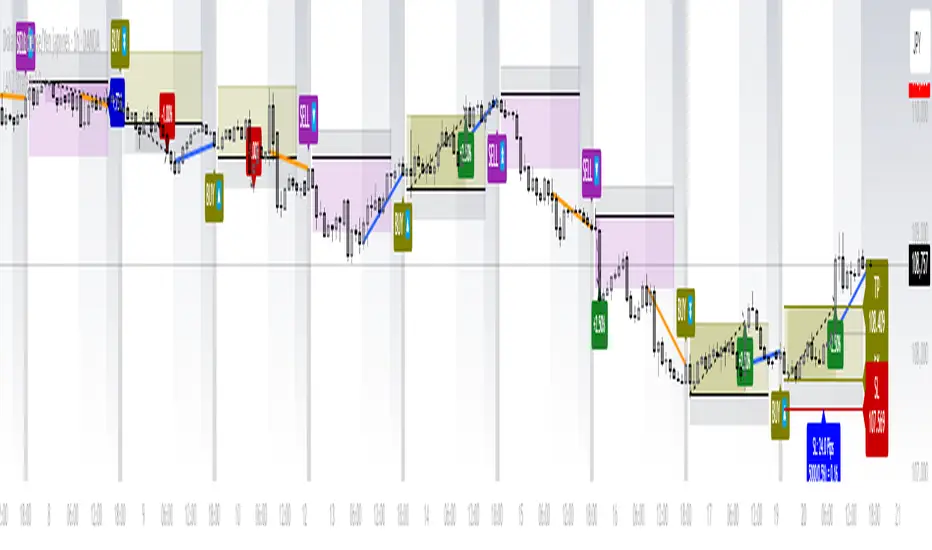
LANZ Strategy 1.0 [Backtest]🔷 LANZ Strategy 1.0 — Time-Based Session Trading with Smart Reversal Logic and Risk-Controlled Limit Orders
This backtest version of LANZ Strategy 1.0 brings precision to session-based trading by using directional confirmation, pre-defined risk parameters, and limit orders that execute overnight. Designed for the 1-hour timeframe, it allows traders to evaluate the system with configurable SL, TP, and risk settings in a fully automated environment.
🧠 Core Strategy Logic:
1. Directional Confirmation at 18:00 NY:
At 18:00 NY, the system compares the 08:00 open vs the 18:00 close:
If the direction matches the previous day, the signal is reversed.
If the direction differs, the current day's trend is kept.
This logic is designed to avoid momentum exhaustion and capture corrective reversals.
2. Entry Level Definition:
Based on the confirmed direction:
For BUY, the Low of the day is used as Entry Point (EP).
For SELL, the High of the day becomes EP.
The system plots a Stop Loss and Take Profit based on user-defined pip inputs (default: SL = 18 pips, TP = 54 pips → RR 1:3).
3. Time-Limited Entry Execution (LIMIT Orders):
Orders are sent after 18:00 NY and can be triggered anytime between 18:00 and 08:00 NY.
If EP is not touched before 08:00, the order is automatically cancelled.
4. Manual Close Feature:
If the trade is still open at the configured hour (default 09:00 NY), the system closes all positions, simulating realistic intraday exit scenarios.
5. Lot Size Calculation Based on Risk:
Lot size is dynamically calculated using the account size, risk percentage, and SL distance.
This ensures consistent risk exposure regardless of market volatility.
⚙️ Step-by-Step Flow:
08:00 NY → Captures the open of the day.
18:00 NY → Confirms direction and defines EP, SL, and TP.
After 18:00 NY → If conditions are met, a LIMIT order is placed at EP.
Between 18:00–08:00 NY → If price touches EP, the trade is executed.
At 08:00 NY → If EP wasn’t touched, the order is cancelled.
At Configured Manual Close Time (default 09:00 NY) → All open positions are force-closed if still active.
🧪 Backtest Settings:
Timeframe: 1-hour only
Order Type: strategy.entry() with limit=
SL/TP Configurable: Yes, in pips
Risk Input: % of capital per trade
Manual Close Time: Fully adjustable (default 09:00 NY)
👨💻 Credits:
Developed by LANZ
Strategy logic and trading concept built with clarity and precision.
Code structure and documentation by Kairos, your AI trading assistant.
Designed for high-confidence execution and clean backtesting performance.

LANZ Strategy 1.0🔷 LANZ Strategy 1.0 — Session-Based Directional Logic with Visual Multi-Account Risk Management
LANZ Strategy 1.0 is a structured and disciplined trading strategy designed for the 1-hour timeframe, operating during the NY session and executing trades overnight. It uses the directional behavior between 08:00 and 18:00 New York time to define precise limit entries for the following night. Ideal for traders who prefer time-based execution, clear visuals, and professional risk management across multiple accounts.
🧠 Core Components:
1. Session Direction Confirmation:
At 18:00 NY, the system evaluates the market direction by comparing the open at 08:00 vs the close at 18:00:
If the direction matches the previous day, it is reversed.
If it differs, the current day’s direction is kept.
This logic is designed to avoid trend exhaustion and favor potential reversal opportunities.
2. EP Level & Risk Definition:
Once direction is defined:
For BUY, EP is set at the Low of the session.
For SELL, EP is set at the High of the session.
The system automatically plots:
SL fixed at 18 pips from EP
TP at 3.00× the risk → 54 pips from EP
All levels (EP, SL, TP) are shown with visual lines and price labels.
3. Time-Restricted Entry Execution:
The entry is only valid if price touches the EP between 19:00 and 08:00 NY.
If EP is not touched before 08:00 NY, the trade is automatically cancelled.
4. Multi-Account Lot Sizing:
Traders can configure up to five different accounts, each with its own capital and risk percentage.
The system calculates and displays the lot size per account, based on SL distance and pip value, in a dynamic floating label.
5. Outcome Tracking:
If TP is hit, a +3.00% profit label is displayed along with a congratulatory alert.
If SL is hit, a -1.00% label appears with a loss alert.
If the trade is still open by 09:00 NY, it is manually closed, and the result is shown as a percentage of the initial risk.
📊 Visual Features:
Custom-colored angle and guide lines.
Dynamic angle line starts at 08:00 NY and tracks price until 18:00.
Shaded backgrounds for key time zones (e.g., 08:00, 18:00, 19:00).
BUY/SELL signals shown at 19:00 based on match/divergence logic.
Label panel showing risk metrics and lot size for each active account.
⚙️ How It Works:
08:00 NY: Marks the session open and initiates a dynamic angle line.
18:00 NY: Evaluates the session direction and calculates EP/SL/TP based on outcome.
19:00 NY: Activates limit order monitoring.
During the night (until 08:00 NY): If EP is touched, the trade is triggered.
At 08:00 NY: If no touch occurred, trade is cancelled.
Overnight: TP/SL logic is enforced, showing percentage outcomes.
At 09:00 NY: If still open, trade is closed manually and result is labeled visually.
🔔 Alerts:
🚀 EP execution alert when touched
💢 Stop Loss hit alert
⚡ Take Profit hit alert
✅ Manual close at 09:00 NY with performance result
🔔 Daily reminder at 19:00 NY to configure and prepare the trade
📝 Notes:
Strategy is exclusive to the 1-hour timeframe.
Works best on assets with clean NY session movement.
Perfect for structured, semi-automated swing/overnight trading styles.
Fully visual, self-explanatory, and backtest-friendly.
👨💻 Credits:
Developed by LANZ
A strategy created with precision, discipline, and a vision for traders who value time-based entries, clean execution logic, and visual confidence on the chart.
Special thanks to Kairos — your AI assistant — for the detailed structure, scripting, and documentation of the strategy.