MarketGodx for Tradingview - Strategy TestMarketGodx for Tradingview
Version = MarketGodx²
Indicator Description
MarketGodx weighs the probability of a given scenario and the outcome associated to prior events before sequentially weighing the impact of a probable move by the significance of the timeframe and its corresponding close sequence relative to other TFs, The indicator combines several components of classical technical analysis and then provides a Buy or Sell alert to traders, which is then acted upon by the user. There are modifications made to alerts to manipulate them in the alternating appearance as the visual above shows.
MarketGod can be applied to any market, with any time-frame associated to it. The signals relay the alert at the close of the period, and the painted alert is then available to users to see on the chart or even set notifications for via tradingview's alert system. We recommend that users implement marketgod on their preferred time frames for trading, which for us is the 1h, 4h, 6h, 1D and above TFs.
Indicator Components
Gann Trend Analysis
Stochastic K
Stochastic D
KDJ Calculation
MACD
SlowRSI
Bollinger Band
Keltner Channels
Ichimoku Cloud
HHLL Trend Detector
MarketGod EMA , WMA , SMA , HullMA
Accumulation + Distribution
Suggested Uses
MarketGod will inevitably produce false positives. We've taken steps to reduce this but we highly suggest you add this as a component of your strategy, not an end all be all
That said, please do not feel the need to fire a trade based solely on a marketgod signal, or to every signal it fires.
MarketGod users should backtest their strategy using OHLC candles for best results
Heikin Ashi candles were recomended in the past, and we have eliminated the need for them, meaning that traditional candlestick inputs will yield the highest results.
MarketGod will always give stronger alerts on higher TF's. If the 1-Day has fired a given signal and the 30 min or similar fire the opposite signal, know that the overall trend is still likely downward. Same concept applies to all timeframes on this tool.
Adjusting the Filter Settings
This tool has a noise filter for users to adjust.
The filter is a percentage based calculation, between significant points in time. The filter ranges between .5 and 25, with .5 increments
For lower TFs (IE Intraday), keep the filter set between .5-5
Mid-TFs (4H,6H,12H,1D), the recommended range is between 5.5-10
Higher TFs (3D and Higher), look for approx 11-20 range
Customizations
Customize the indicator by adjusting the colors in the style pane. Additionally, users can change the plots into labels with the price of close added to them, or a few other label text options, listed in the 'inputs' panel, below the filter adjustments. Users can also opt to turn the strategy orders as well, as this version will have them printed.
Strategy Performance Interpretation
Its important to understand the only metric that should be relevant is not the win %, as many may initially think. Alternatively, the only metric that matters in the end is your take home profit... meaning the profit one fees and taxes are accounted for. In our example here, the % brought back since the beginning of our window of 2018 is around 47% for $10,000 initial capital and 10% traded per position. Many are ignorant to the take home profit aspect as they focus solely on the winning %, which is ultimately incorrect approach to trading as a whole. as long as we maintain +30% (our goal minimum), the outcome being in the green, is our goal.
Access MarketGod for Tradingview
Learn more about how to access this tool by following the links in our signature below.
Search in scripts for "macd"

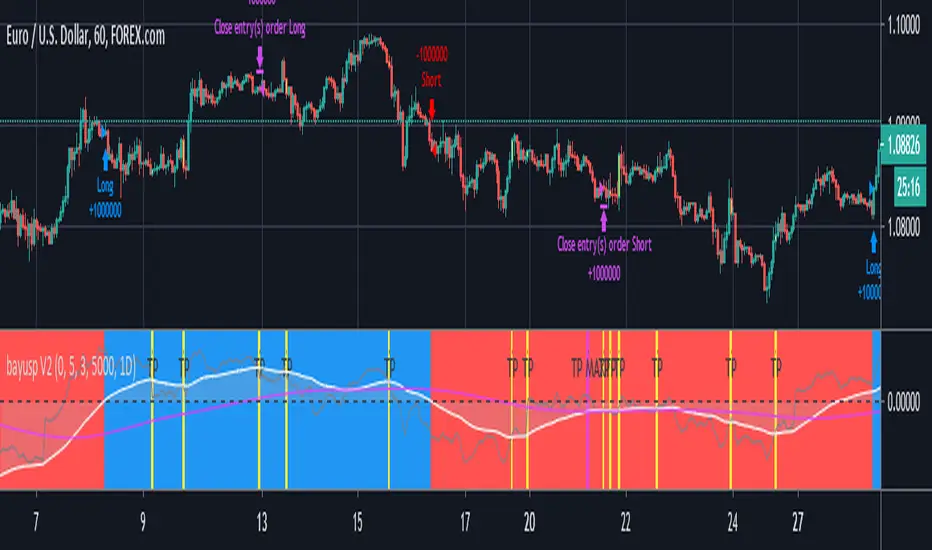
bayusp V2Using multi source like RSI , MACD , Stochastic , SMA , EMA and Huge Noural Network to Predicted Open Position.
The MATRIX: Ultimate Crypto Position StrategyHi all,
We are cryptocurrency miners and 'hodlers’ since 2013, with unwavering confidence in the technology behind it. We’d always thought that it would be a life-changing êvent. And we were right. We went from “broke” to making shit loads of money and all the way back to bitter nothing. If you are lucky, you probably haven’t experienced what if feels to be high on cash and then fall very deep low, but let me reassure you, it is a nasty feeling.
Then we wondered, what the hell did we do wrong? Or better say, what didn’t we do right! The answer was dead simple: We had no experience in trading, we were overwhelmed by emotions and we didn't use any trading strategy. Hence, we were doomed to fail from the beginning.
In order to build an all-in-one profitable trading strategy, we had to start from zero. The one thing we learned is that your goal for financial gain cannot be achieved without discipline and consistency. Our prime focus was to absorb as much info as possible regarding trading and coding by doing an extensive self-study, which consequentially took us to the next level.
One of the secrets to being successful from a trading perspective is to have an indefatigable and undying thirst for information and knowledge. As Bruce Lee once said: “Learning is never cumulative; it is a movement of knowing which has no beginning nor end”. So, we adapted what was useful, rejected what was useless, and added our own preferences based on our mindset. We were totally committed to be the best. Our goal was never to lose money again! Of course, this is an illusion, as no single strategy is correct all of the time.
Therefore, the final trading strategy was based on the following key elements:
• The avoidance of risk is more important than absolute profit. Do not anticipate and do not move without market confirmation. Being a little late in your trade is your indication if you are right or wrong.
• Offering simplicity and practicality, for those that do not have the time to trade 24/7.
• Believe in analysis and not in forecasting. Trading is a skill for those who are smart and gambling for those who are not.
In conclusion, we are absolutely thrilled to finally release this trading strategy after one year of extensive back testing and optimization. The script was supposed to be for personal use only, but because Tradingview has helped us a lot in this process, we want to share it with all of you and give something back to this amazing community. If you learned something new today and found value, please give us a like to show your support! We’d really appreciate it.
***The script is invite-only, message us to get script access***
-------------------------------------------------------------------------------------------------
The MATRIX: Ultimate Crypto Position Strategy should be used as follows:
• The trading strategy was designed and optimized for trading cryptocurrencies only ; furthermore it works best on established high market cap cryptocurrencies that have a clear trend such as:
BTCUSD
ETHUSD
LTCUSD
XRMUSD
EOSUSD
ADAUSD
DASHUSD
ETCUSD
• The trading strategy is based on swing/position methodology. The script must therefore be used on daily timeframe candles only (1D) .
• Use USD trading pairs only (e.g. use ETHUSD instead of the ETHBTC) since the individual trend is captured more effectively and therefore gives better results.
-------------------------------------------------------------------------------------------------
The MATRIX:Ultimate Crypto Position Strategy is based on the following indicators:
• Ichimoku Cloud ; acts as the leading indicator.
• Volume ; without strong volume , a market move is not valid.
• MACD and Vortex ; both being used as confirmation indicators.
• Choppiness index ; avoids trading in choppy markets.
• Bullish/ Bearish Regular Divergences in combination with RSI to spot tops and bottoms.
• Simple and Exponential Moving Averages ; prêvents trading against the trend.
The trading strategy is easy to use, trend based and without repainting, meaning once a signal has been made it is permanent and that no future data is used in the decision making. It detects the trend and filters out market noise based on more than 10 technical indicators. ONLY when all indicators align with each other the algorithm prints a BUY or SELL signal. The trading strategy provides high probability trading signals and minimizes risk! This script aims to capture the profit from longer term trending moves and by doing so filters out non-substantial trends and avoids the associated risks with these trades.
-------------------------------------------------------------------------------------------------
The MATRIX: Ultimate Crypto Position Strategy has the following features:
• Automatically generated Buy / Sell alerts in the form of a label.
• NO Repaint once candle is closed.
• SAFEGUARD ; custom built-in security prevẹnts trading when the price is out of equilibrium.
• Customizable Display for the Ichimoku cloud indicator display.
-------------------------------------------------------------------------------------------------
Below are the backtest results. Keep in mind that this strategy is quite conservative resulting in few long positions. These results are therefore no guarantee for the future.
Back test results: (only Long trades, signal to signal, order size: 100% of equity, commision fee 0.1%, period: start of chart)
Exchange-----Asset---------Timeframe---Percent Profitable----Profit Factor-----Total Trades----Max Drawdown---Average bars in trade-----Net Profit
Coinbase-----BTC/USD---------1D----------------100----------------N/A------------------10---------------0.00---------------------54-------------------6183.6
Coinbase-----ETH/USD---------1D----------------100----------------N/A------------------7----------------0.00---------------------46-------------------11673.0
Coinbase-----LTC/USD---------1D-----------------100---------------N/A-------------------7----------------0.00---------------------46------------------4727.0
Bínance------EOS/USD---------1D-----------------100---------------N/A-------------------3----------------0.00---------------------34------------------42.8
Bínance------ADA/USD---------1D-----------------100---------------N/A-------------------2----------------0.00---------------------40------------------118.4
Coinbase-----XTZ/USD---------1D-----------------100---------------N/A-------------------1----------------0.00---------------------36------------------34.4
Bínance------BNB/USD---------1D-----------------66.7--------------10.8-------------------6---------------24.22--------------------38------------------1488.8
Bínance------ETC/USD---------1D-----------------100---------------N/A-------------------2----------------0.00---------------------33------------------94.9
Bínance------XMR/USD---------1D-----------------100---------------N/A-------------------3----------------0.00---------------------43------------------74.2
Bínance------ICX/USD----------1D-----------------100---------------N/A-------------------2----------------0.00---------------------29------------------215.3
-------------------------------------------------------------------------------------------------
Reminder: Use this trading strategy at your own risk and trade responsibly. We are not responsible for any financial loss using this strategy.
***The script is invite-only, message us to get script access***

Gekko DEMA StrategyThis script is based upon the Gekko trading strategy.
This strategy uses Exponential Moving Average crossovers to determine the current trend the market is in. Using this information it will suggest to ride the trend. Note that this is not MACD because it just checks whether the longEMA and shortEMA are % removed from each other.
* short is the short EMA that moves closer to the real market (including noise)
* long is the long EMA that lags behind the market more but is also more resistant to noise.
* the down threshold and the up threshold tell Gekko how big the difference in the lines needs to be for it to be considered a trend. If you set these to 0 each line cross would trigger new advice.
The base strategy has had money management logic added and has been tested for best results. Once you have access, you can modify these settings to find what works best for you.
Access to this strategy is FREE! Message me for more information on how to get access.

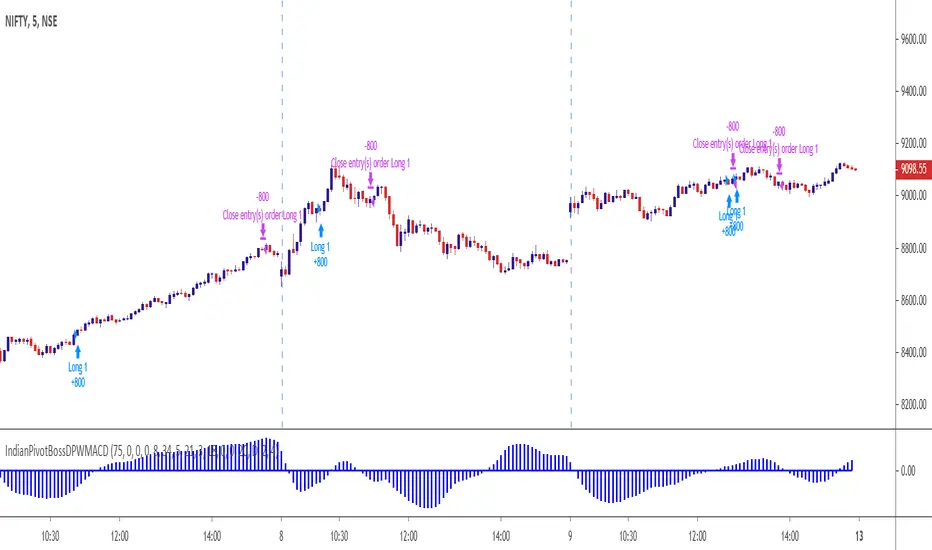
IndianPivotBossDPWMACDThis is the MACD of developing cpr width.
This indicates whether the market is trending or ranging.
If the indicator is upward sloping, it means the market is likely to trend.
If the indicator is upward sloping and crossed zero, it means the market is most likely in a trending mode.
Hence trades should be considered only during these phases.
If the indicator is downward sloping, it means the trend is likely fizzling out.
If the indicator is downward sloping and also below zero, it means likely ranging market.
This is a strategy on its own.
However, it is recommended to be used along with IndianPivotBossMUPS to be more effective.
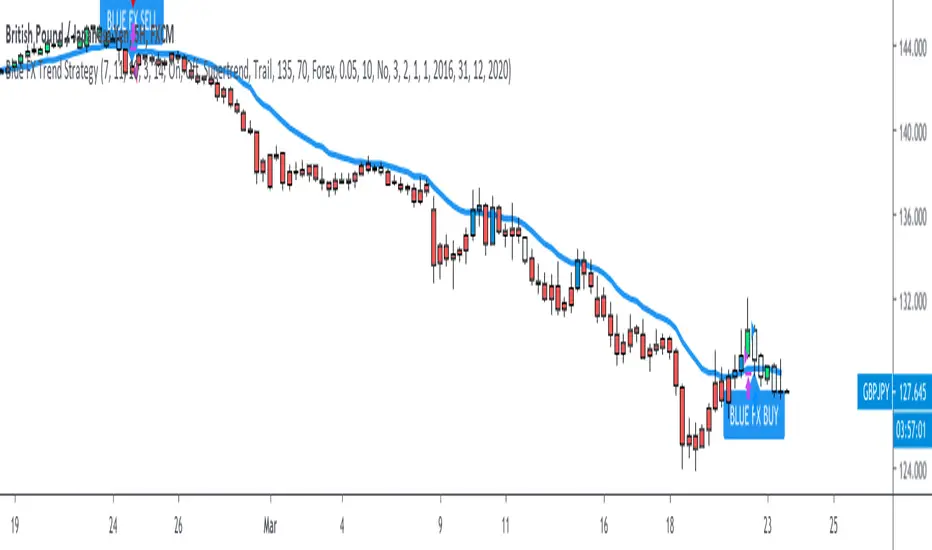
Blue FX Trend StrategyHi, welcome to the Blue FX Trend Strategy Script.
What does it do?
Our strategy will help you identify the current trend in the markets and highlight when this is changing. The strategy itself is based upon 4 indicators lining up in total confluence to increase the probability of the trade being a success, this is specifically an EMA, MACD settings, Supertrend criteria and also Momentum.
Absolutely no technical analysis is needed to trade this successfully - this can be used on all time frames and all pairs - obviously with varying profitability as all pairs work differently - this can be reviewed quickly in 'Strategy Tester' to hone in on your own desired settings.
When all criteria is in alignment the strategy will convert all candles to the relevant colour - Green for an uptrend and Red for a downtrend; a candle that is printed normally simply shows that no current trend is in place to warrant a colour change. A normal coloured candle could possibly indicate a change in current market direction or the market consolidating before a further move in the initial direction. When a new signal is valid 'Blue FX Buy'' or 'Blue FX Sell' will be displayed and the small arrow shown on candle open for entry.
How do I use it?
Our strategy is invite only - upon joining our group we will allow you access to the script. This will then simply display on your device ready for you to start trading from. There is substantial functionality within the strategy, you can;
See the success of the default settings in the past using the 'Strategy Tester' Function for numerous settings
1. Following the settings 'Trail'
2. Changing your TP function with the other criteria listed
3. Using a Fixed TP or SL function
Upon changing the Script to 'Fixed' you will see numerous trades on the chart displayed differently.
Scaling into a profitable position is also possible - this is ideally done when the candle colour confirms the trend is continuing after rejection/support from the EMA; we show this below;
You could also enter here if you missed the initial sell signal, we have MA rejection and a red printed candle indicating all confluences are in play and we have high probability for the move to continue.
How do I know its profitable?
We have built numerous customisable settings into the strategy for you to see that this is profitable - you can visually see this too. The settings are also customisable to find the right criteria for the right pair on the right time-frame. Ultimately, with the strategy confluences in place, you are putting probability in your favour and can quickly determine the trend in place if there is one. Within the customisable settings there is a compound function too, so if you were to compound your profit the results can be exceptional.
We have also added an H4 confluence, so you can ensure if trading on a lower time-frame you are in the overall direction of the H4 trend too, a useful setting for more confluence again.
Where do I set my Stop loss or Take Profit?
There is no right or wrong to this and we have attempted to build numerous ways of doing this into the strategy for reference.
For setting a SL you could;
1. Use a fixed SL.
2. Place the SL below the last high or low in the trend.
3. Use an ATR function.
4. Place the SL 5 pips below the last 3 candles.
5. Or, trail the price if you are on screen until the next signal is given and a new trend starts - although unless a big trend, you may miss out on some profit by the time price has pulled back.
For placing a Take Profit, you could;
1. Use a fixed TP.
2. Look for the next supply/demand area on the chart (if it breaks and candle colour supports direction - you could enter again).
3. Use an ATR function.
5. Or, trail the price if you are on screen until the next signal is given and a new trend starts - although unless a big trend, you may miss out on some profit by the time price has pulled back.
6. Secure multiple TPs - 20/50/100 pips with Stop loss to entry after the first target is hit.
Here are some examples of the Buy and Sell signals in action;
Will also work on Commodities and Indices as shown below too;
Our recommended visual settings are below;
1. Set to'Trail' Strategy
2. Under 'Style' tab, select Trades on Chart, but un-select both Signal Labels and Quantity to clean up the chart - these settings are useful when testing to see where the trades are opened and closed.
3. We like the candles changing colour to the trend and criteria set however, these can be turned off to display normal bullish and bearish candles.
When reviewing profitability you can do this by selecting 'Overview' 'Performance Summary' and 'List of Trades'.
Please consider that the settings based into the strategy could differ to your own money management rules and your management of your SL and TP as outlined above - we have tried to cover as many bases as possible here.
We look forward to you using this strategy to profit from the market, please share your feedback and results with us.
Kind regards
Blue FX Team
The 1h Wick Wicky - Bitcoin BeatsThis script Uses a bunch of different indicators in order to catch wicks.
Included are:
SAR
JME
Range Filter
ADX
RSI
MACD
Automatic Plotted TP
Unconfirmed entries followed by confirmed entries
This is a combination of different indicators therefore the credit shall not go to me but I have changed certain parameters in order to benefit backtesting profitability.
Trade at your own risk!


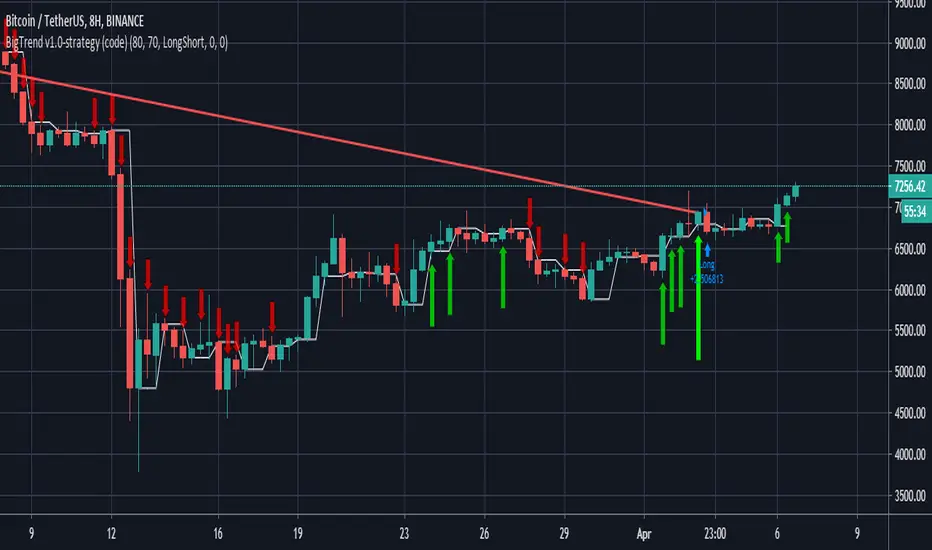
Long/ Short with Big Trend v1.0-strategyHello traders,
This script using multi MA and EMA , MACD , RSI ... for vote BUY or SELL.
If 80% signal vote for BUY, signal Long will been active
or 80% signal vote for SELL, signal Short will been active
Recommend using this script for Trend trader, not using for Scalping trader or Swing trader!
Best backtest in:
- BTC/USDT H8, D1
- LTC/USDT: D1
- ETH/USDT: H8
- BCH/USDT: H2, H4
- LINK/USDT: H8
...
With other symbols and time frame, you can do it yourself.
We are recommend using with min time frame H2 for all symbol or using H8 only.
Setting for backtest:
- Signal %: set percent for active signal. Recommend set 80 for big time frame or 90-95 for small time frame.
- Trade type:
+ LongShort (default): trade Long and Short if you trade with margin account.
+ LongOnly: if you trade with spot account, select Long only for backtest.
+ ShortOnly: if you trade with margin account and like short only.
- Take profit %: close order if profit > this value. Set to 0 for disable this function.
- Stop loss %: close order if profit < this value. Set to 0 for disable this function.
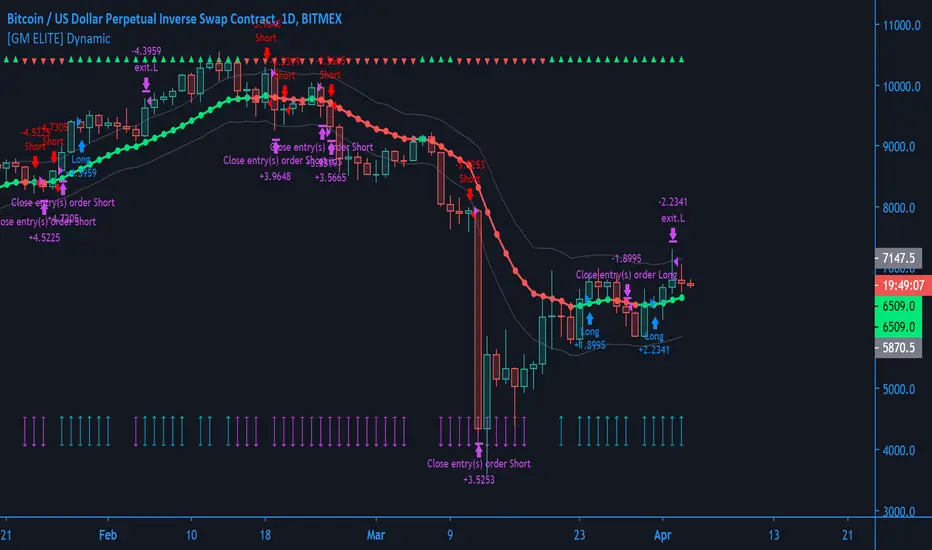
[GM ELITE] Dynamic Introduction
This is the first of the GM ELITE indicator range. Designed for Algorithmic Traders looking to speed up their process of testing and optimizing their algorithm. This script contains an entire suite of indicators, that work together in unison to find optimal trade entries, based on NNFX rules. There are two versions of this script. One is a strategy and built in back-tester, and the other will update in real time designed for live trading and forward testing.
Entries/Exits
The System has 5 indicator slots, and the user can choose one indicator per slot
- Trend Confirmation Indicators to pick when the market has taken off
- Volume and volatility Indicators to determine the strength of the trend or whether tha market is ranging.
- Moving Averages for trend bias
- Exit Indicators to signal when to get out!
Money Management
Dynamic allows you to choose your Stop Loss and Take Profit distance based on a multiplier x ATR.
Options to exit the whole trade at TP or at a signal from the exit indicator of your choosing.
Start and End times (Window) to backtest.
Forex - $EVZ
Euro Volatility FX Vix (aka $EVZ) is built in. You can toggle a filter for low $EVZ or whether or not EVZ is above average. No signals will be given if EVZ is below threshold. EVZ is one of the best indicators of overall forex market volume and volatility.
Customization
Several visual and color customization options. Thousands of possible parameter combinations.
The "bias" or mode of the Confirmation Indicators appears at the top and bottom of the screen as horizontal rows of triangles.
For any two-line Indicator (eg MACD ) if the fast line is above the slow line, the triangles are green, other-wise, they are red.
For any "Level Cross" indicator, when the line is above the level, the triangles are green, otherwise, they are red.
The Arrows at the bottom of the screen determine whether or not there is sufficient volume
Out of the Box
The Indicators and parameters out of the box are chosen based on defaults. Please optimize for the market that you trade.My recommendation is to paper trade once you have found a combination of settings with good back-testing results, and have different settings for different markets, as not all markets behave in the same manner.
eb.Market Strength (trend is friend) v3 strategyHello traders,
This script using multi MA and EMA, MACD, RSI... for vote BUY or SELL.
If 80% signal vote for BUY, signal Long will been active
or 80% signal vote for SELL, signal Short will been active

Detrended Price Oscillator StrategyTHIS IS THE STRATEGY VERSION
What is DPO?
A detrended price oscillator is an oscillator that strips out price trends in an effort to estimate the length of price cycles from peak to peak or trough to trough. Unlike other oscillators, such as the stochastic or moving average convergence divergence (MACD), the DPO is not a momentum indicator. It highlights peaks and troughs in price, which are used to estimate buy and sell points in line with the historical cycle.
(From Investopedia )
Indicator features:
Responds faster than the original code.
Added alternative smoothing algorithms. Defaults to Ehler's Optimum Elliptic filter instead of the orginal SMA
IPOCS - can start printing out data at day 1 instead of waiting for 14 or 20 bars
Dynamic colors
Auto timeframe detection to adjust period/length
How to use:
Buy above zero
Sell below zero
Who is it for?
Long term investors - this is the perfect indicator for those who buy and hold

Volatility Traders Minds Strategy (VTM Strategy)Volatility Traders Minds Strategy (VTM Strategy)
I found this startegy on internet, with a video explaingin how it works.
Conditions for entry:
1 - Candles must to be above or bellow the 48 MA (Yellow line)
2 - Candles must to break the middle of bollinger bands
3 - Macd must to be above or bellow zero level;
4 - ADX must to be above 25 level
Credits to who developed this startegy (google it).
Thanks to all pinescripters mentined in the code for their snippets.
It could be improved with stop loss based on ATR etc.
I have also a study with alerts.
Please use comment section for any feedback or contact me if you need support.

Multi-Oscillator Divergence StrategyNote: This is a modified version of TradingView's built-in "Divergence Indicator" and applied in "Strategy" format to show back testing results
It finds bullish and bearish divergence in a selection of well known MA formulas: MACD, RSI, STOCH, DETRENDED PRICE OSCILLATOR, MOMENTUM.
I've found good results even on 1 minute charts!
In this example the chart backtest is utilizing the detrended price oscillator (DPO)
There are multiple variables, so the ability to find good back test can sometimes be "time consuming"
And please note that if you increase "Pivot LookBack Right" variable too high, then you will increase chance of repaint. Keep this variable as low as possible
I've also drawn my own solutions on the chart (red and green trend lines) to find good take profit and safe stop loss. In order to study this properly you need the own the chart. Scripts don't give you this option.
See private chart publication link to "own" the chart for yourself. Simply click on the "Share" button (it's the megaphone icon) and click on "Make it Mine"
I've found the best approach is to create 5 copies of indicator on 1 chart and have each running with different MA formula. This will give you a majority consensus type environment.
I will post study with alert conditions next
Good luck and enjoy!

SuPeR-RePaNoCHa #2TP#This is the last of the 'RePaNoCHa' script for Automatic Trading ;-) ... This time with two take profits ...
It Use 6 indicators + volume:
-JURIK MOVING AVERAGE
-RANGE FILTER
-ADX
-PARABOLIC SAR
-RSI + VOLUME WEIGHTED
-MACD
-VOLUME
To close the position you can choose between 2 Take Profit and the amount to use on each one.
You can transform it yourself into 'study' mode to get alerts.
Take Profits can be generated from the same entry, (syntax example on the script) so the fees will be lower (0.04 + 0.02 / 2 = 0.03).
Settings for BINANCE FUTURES BTC:USDT
Enjoy...

TimeMachineInspired by Time Travel concepts. Suitable for intermediate & short time frame crypto trading. Based upon MACD + stochastics + volume analysis, yet consults R2D2 indicator for confirmation.

ANN RSI SUPER TREND STRATEGY BY che_traderCreate a strategy for the good indicator created by @RafaelZioni
Which is composed of ANN data taken from
and the super trend shared by www.tradingview.com
Feel free to share and copy this script!
Enjoy!

💲SuPeR-RePaNoCHa💲 [Backtest]Script for automatic trading (Backtest). This is the second part of the previous RePanoCHa script but with Take Profit.
It Use 6 indicators + volume:
-JURIK MOVING AVERAGE
-RANGE FILTER (from Donovan Wall)
-ADX (ORIGINAL VERSION)
-PARABOLIC SAR
-RSI + VOLUME WEIGHTED
-MACD
-VOLUME
To close the position you can choose between Take Profit only, Trailing Stop only or both at the same time.

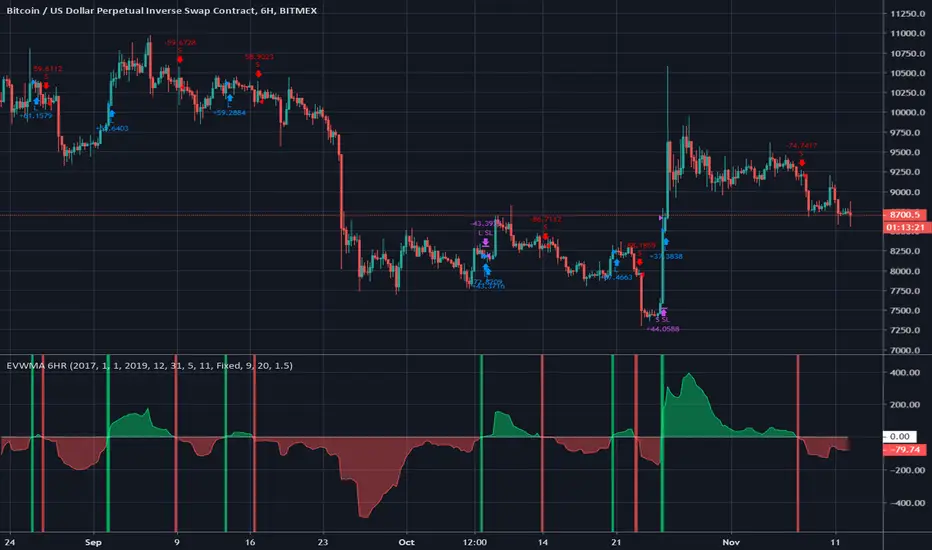
EVWMA 6HR BFCredit goes to QuantNomad for the idea behind this code. Here
is the original script.
This strategy simply goes long on a cross above zero of the calculated delta line and short on a cross down below zero.
The delta line is calculated using 2 volume based moving averages.
There is a fixed 9% stop loss but you can change this to an ATR Derived stop in the settings.
DH: (Strategy) Super SmartSuper Trend: Backtest VersionSUPER SMART SUPERTREND (Strategy Version w/ Backtesting)
Across all time frames and assets I've tested, this indicator gives me better results... Better entries, better exits and well defined trends. In comparison with a STANDARD Supertrend, it is not radically different, but when it does differ "Super Smart SuperTrend" is almost always better.
This is the STRATEGY version of "Super Smart SuperTrend" ready for your backtesting. There is also a STUDY version with ALERTS which might be better for live trading if you want Alerts.
STUDY VERSION WITH ALERTS IS HERE
##################################
##################################
ABOUT THIS INDICATOR
As the name suggests, 'Supertrend' is a trend-following indicator that is notably popular here on Tradingview and elsewhere. It does a remarkably great job of recognizing a trend (in progress) and it will signal you to initiate a position when the trend is clear. Perhaps the greater value of Supertrend is that it helps keep you in your position until that trend is over.
WHAT'S THE BEST ATR PERIOD AND MULTIPLIER?
There are two important data points we must enter for Supertrend to work, namely the 'period (ATR number of candles or days)' and the 'multiplier (value by which ATR is multiplied)' BTW, in case you don't know, ATR signals the degree of price volatility. A common default setting is 10 for the ATR period and 3 for the multiplier.
SORRY, BUT THE MOVIE STARTED HALF HOUR AGO...
Unfortunately Supertrend has a couple of big weaknesses. Generally, it fails in a sideways-moving market and when it does detect a trend, the signal to get in (or out) comes rather late. It's like someone telling you about a great movie they're watching, but by the time you start watching, one-third of the movie is over... bummer, right?
HOW TO IMPROVE SUPERTREND
One solution is to combine Supertrend with other indicators such as MACD, Parabolic SAR, RSI, etc. And another solution is to experiment (backtest) with the Period and Multiplier settings for the asset and timeframe you are considering for trade.
For the STANDARD SETTINGS in this "Super Smart SuperTrend" indicator, I have set 9 for the ATR and 2.2 for the multiplier as default after backtesting on Bitcoin and other crypto (mostly in the 15 minute to 6 HOUR timeframe). Of course you can change this easily to any ATR period and Multiplier you like.
BUT... WHY NOT GET SMART?
I started thinking, it might be best if we let the market determine candle-by-candle what the settings should be. If everyone says that Supertrend works best in conjunction with other indicators, why not do our "conjuncting" programmatically (ie: automatically) sorta like artificial intelligence!
HOW IT WORKS
So here's what I did. Using data from other indicators I came up with a SMART SUPERTREND that auto-adjusts as the market changes. It still has settings so you can fine tune it for specific assets and timeframes, but once the settings are entered, it auto-adjusts as the market and prices evolve.
With "Super Smart SuperTrend" there is no ATR period setting (that is determined programmatically) and now there are TWO multipliers you can experiment with... (a lower one set at 1.7 default and a higher one at 2.5). These multiplier settings create a multiplier range that can be used programmatically to adjust the multiplier as the market and prices evolve.
THE RESULTS
Across all time frames and assets I've tested, I generally get better results. Better entries, better exits and well defined trends. In comparison with a STANDARD Supertrend, it is not radically different, but when it does differ "Super Smart SuperTrend: is almost always better. All this is substantiated by backtesting of course.
SAMPLE BACKTEST RESULTS (BTC/USD)
*Using Indicator Defaults*
TIMEFRAME STANDARD RESULTS SUPER SMART RESULTS
% Profitable | Profit Factor % Profitable | Profit Factor
DAY 58.33% 9.38 75.00% 10.77
4 HOUR 78.43% 18.22 80.95% 21.78
1 HOUR 74.11% 8.98 70.13% 9.34
15 MIN 58.10% 6.10 71.43% 9.48
Keep in mind that "Profit Factor" is key. It basically tells you what you'd make for every ONE DOLLAR invested by consistently trading with the backtested parameters.
SUPER SMART SUPERTREND FEATURES
• There is a STUDY VERSION w/Alerts
• There is a STRATEGY VERSION for Backtesting
• Standard 'Current Time Frame' SuperTrend Line
• Standard 'Higher Time Frame' SuperTrend Line
• Auto-Adjusting Dynamic Optimized SuperTrend Line
> Most Signals Are Same or Better than Standard
> Refine Results w/Sensitivity Inputs (2 Multipliers)
> Impressive Comparison Backtests
• Both Standard and Smart Signals and Alerts
• Toggle Any Line/Signal (On/Off)
• Toggle Backtest
> Standard vs. "Smart Auto-Adjust"
> Backtest Higher Timeframe Only
WHAT MORE COULD YOU ASK FOR?
So glad you asked. Actually, there is more... Super Smart SuperTrend is incorporated into my premier indicator set called: STONEHENGE PLUS: SUPERTREND TRADING TOOLKIT.
By combining Super Smart SuperTrend with dozens of other indicators plus the predictive "Stones" of Stonehenge, you'll be in Trader's Heaven.
That's it. Get "SMART" Today!
STONEHENGE PLUS:
The Complete SuperTrend Trading Toolkit
#################################
#################################
SUPER SMART SUPERTREND ALSO WORKS WITH:
STONEHENGE BASIC: Double Stone Version (Study w/Alerts):
PLEASE HIT THE LIKE BUTTON (and follow me... lots of great stuff in the works!)
As always, I appreciate your support. Please share with others.
ENJOY!
Dan Hollings
Master Crypto Grid Trader
Stonehenge Master Mason
Host of the "High Leverage Lounge"
Please Explore My Other Indicators, Scripts, Grids and Educational Ideas.
@DanHollings on Tradingview.
Additional Links Below...

Profit-sync with Trexen StratThere are various scripts and indicators on Tradingview, but not many of them combine theories to improve the profitability of an indicator using settings from multiple time frames.
This script takes the Average True Range trailing exit idea to enter trades. Many other ideas have been tested to filter entry signals which may be weak or not profitable such as a second ATR with Higher TF, MFI/VFI, RSI , Momentum wavetrend, Weis Wave, MACD , Stochastic etc, but I felt the following works best:
- Over the ATR entries there is a directional filter very similar to Renko candles which can be set to a higher time frame, I use 4 hour with 15 min candles for example, this will only allow 15 min buy signals to execute if the 4 hour is also on the buy side.
- There is also a Trend directional filter which can be set to a higher/lower time frame, currently I am using this on allow setting to allow more trades
The higher both filter are, the more accurate the trades will be, but less frequent. The filters convert entry signals into exit signal which can be used as take profit point with alerts if there is a position open.
The overall theory is to follow trend and to exit with profit. I have tested different take profit alerts but think it’s better to either catch a whole price move or sell with a set trailing limit order at like 0.4/0.5%.
As I am trading BTC with a bot and not with TA I think it is good to get in on a trend reversal, follow the trend up and get out quick with profit. There is a lot of manipulation with crypto so things like Momentum indicators and money-flow may not represent what is actually happening in the market.


BITCOIN_BUYSELL_vs_DOMINANCEUpdated to three lines similar to the 20, 50, 200 ema however they utilize RSI + MACD + EMA + ROC + Averaging powers to generate buy and selling zones
