Sentiment Bias Gauge📌 Overview
The Sentiment Bias Gauge (SBG) is a unique overlay-style indicator that visually maps a sentiment value—such as market bullishness or bearishness—onto your price chart. It converts sentiment data (in this case, RSI-based) into a floating line that moves between defined price zones, allowing users to quickly understand the current market mood in the context of price.
⚙️ How It Works
• The indicator uses RSI (Relative Strength Index) as a proxy for market sentiment (0 to 100 scale).
• This sentiment value is then mapped to a vertical price range on your chart using a configurable zone (via top and bottom percent of chart range).
• The line floats up or down within the price chart, reflecting how bullish or bearish the sentiment is.
• It includes background shading to represent the sentiment level:
• 🔴 Red (Bearish): sentiment < 30
• 🟡 Yellow (Neutral): 30 ≤ sentiment ≤ 70
• 🟢 Green (Bullish): sentiment > 70
• A floating label shows the current sentiment score.
🌟 Key Features
• 📈 Overlay-Based Sentiment Line: Plots sentiment as a price-level line, giving intuitive spatial reference.
• 🔧 Configurable Range Placement: Adjust where the sentiment line appears within the chart’s high-low range.
• 🖌️ Color-Coded Background: Visually distinguish bullish, bearish, and neutral conditions.
• 🏷️ Real-Time Sentiment Label: Displays updated sentiment score on the most recent bar.
🧠 How to Use
• Use this indicator alongside your price action or technical strategy to gauge market mood.
• Combine with other sentiment indicators (e.g., fear/greed, delta volume, news sentiment).
• Especially helpful in sideways markets to identify potential shifts in bias before price reacts.
Why This Combination?
• RSI offers a reliable and intuitive proxy for market sentiment.
• Mapping the value directly onto the chart helps avoid constantly looking at a separate panel.
• The customizable chart range lets traders fit sentiment visuals within any market structure.
🎯 Why It’s Worth Using
• Makes sentiment visually accessible directly on the chart.
• Helps detect bullish/bearish bias shifts earlier than traditional indicators.
• A great tool for sentiment-aware discretionary trading or contextual overlays in algo strategies.
Sentiment Studies

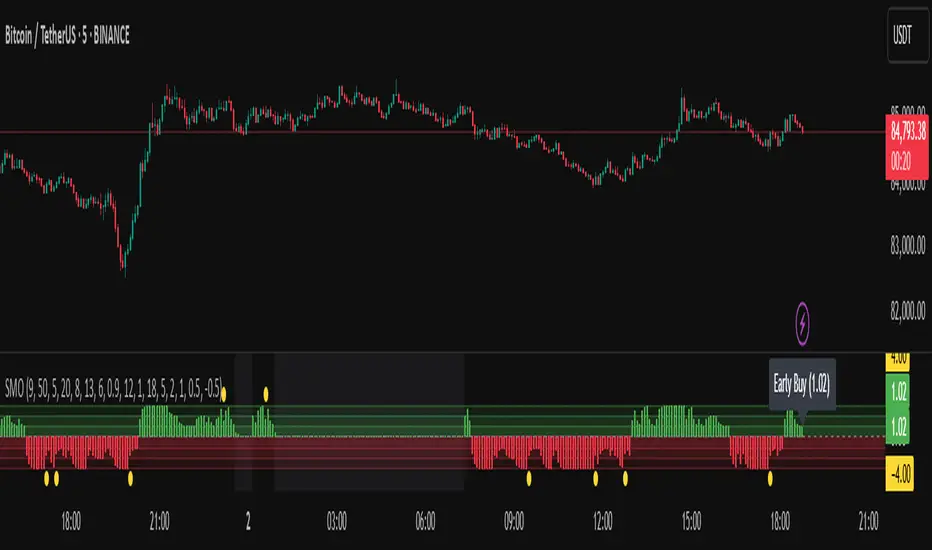
Sentiment Master Oscillator[BullByte]
The Sentiment Master Oscillator is a modern market sentiment indicator designed for traders seeking to identify early trend shifts and potential reversals with clarity. This oscillator combines multiple technical tools—RSI, MACD, EMAs, ADX, ATR, and volume filters—to deliver layered signals that help you assess market momentum in a clear and simplified manner.
Key Features:
- Multi-Indicator Approach :
Integrates RSI (with a smoothing function), MACD, and two EMAs to gauge momentum and trend direction. The oscillator also includes ADX and ATR filters to ensure that only markets with sufficient directional strength and volatility generate signals.
- Dynamic Signal Zones :
The oscillator produces a raw value ranging roughly from -3 to +3 (adjustable via a scaling factor). Positive readings suggest bullish conditions, while negative readings indicate bearish trends. Visual zones (Early, Confirmed, Strong) are clearly marked with color-coded horizontal lines to help you interpret the strength of the signal at a glance.
- Adaptive Smoothing :
For those who prefer quicker, more responsive signals (ideal for scalping), an adaptive smoothing option is available. When enabled, it applies a shorter smoothing period to the oscillator; otherwise, a more conservative base period is used.
- Reversal Alerts :
Yellow dots are plotted on the chart to highlight potential reversal points. These alerts are triggered when the oscillator crosses specific thresholds, coupled with volume and ATR conditions, signaling that a top or bottom may be forming.
- Customizable Filters :
- ATR Filter :Ensures that the market's volatility is above a set threshold before signaling.
- ADX Filter :Confirms sufficient trend strength.
- Volume Filter : Requires that trading volume surges above a multiple of its simple moving average, filtering out low-volume noise.
- Clear Signal Messaging :
Based on the combined signals from various indicators, the script categorizes market sentiment into actionable messages such as "Early Buy", "Confirmed Buy", "Strong Buy", "Early Sell", "Confirmed Sell", and "Strong Sell". A "Grey Zone" label is used when the oscillator is near neutral, indicating that no clear trend is present.
How to Use :
1. Entry and Exit Decisions : Use the different signal stages (Early, Confirmed, Strong) as guides for your entries and exits.
2. Trend Confirmation : Rely on the multi-indicator setup for added confirmation of prevailing market conditions before executing trades.
3. Reversal Cues : Pay attention to the reversal dots for potential turning points in the market, which can be used to adjust positions or initiate trades.
Disclaimer:
This indicator is intended for educational and informational purposes only. It should not be taken as financial advice. Always use appropriate risk management and combine it with your analysis before making any trading decisions. Past performance is not indicative of future results.
By adhering to TradingView's publishing guidelines, the BullByte Sentiment Master is designed to provide transparency, simplicity, and robust analysis tools to enhance your trading strategy. Enjoy a clearer view of market sentiment and make more informed trading decisions!
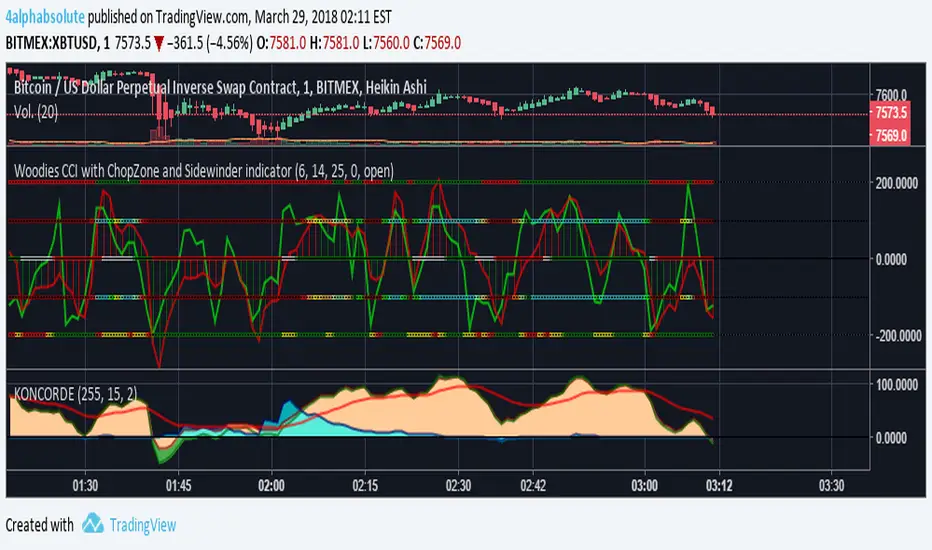
Woodies CCI with ChopZone and Sidewinder indicatorExcelente indicador a mi parecer, bastante complejo pero muy bien acoplado; dejo aquí las fuentes para aprender a utilizarlo:
www.x-trader.net
www.x-trader.net www.x-trader.net www.x-trader.net
Katalyst's Opening Range BreakoutKatalyst's Opening Range Breakout + No Trade Zone
📜 Overview:
This indicator allows traders to visualize the high and low of the opening range for a user-selected timeframe (e.g., 30s, 1m, 5m, 15m). It features fully customizable lines, labels, and an optional **No Trade Zone** fill to help you identify breakout levels with ease.
---
🎯 Key Features:
1. **Customizable Opening Range**:
- Select your preferred opening range duration: **30 seconds, 1 minute, 2 minutes, 5 minutes, 10 minutes, or 15 minutes**.
- The indicator calculates and plots the **high** and **low** of the selected opening range.
2. **Dynamic Line Styling**:
- Choose the **line color**, **transparency**, and **style**: **Solid, Dashed, or Dotted**.
- Lines extend to the right of the chart for clarity.
3. **No Trade Zone** *(Optional / Disabled by default)*:
- When enabled, fills the area between the high and low lines with a customizable **color and transparency**.
- Helps visually identify consolidation areas where trading might be avoided.
4. **Labels for Precision**:
- Clearly displays the **Opening Range High** and **Low** values.
- Labels are color-coded and positioned dynamically for easy interpretation.
5. **Clean and Efficient Updates**:
- The indicator deletes old lines, labels, and fills before creating new ones, ensuring a clutter-free chart.
---
⚙️ How to Use:
1. **Select Your Timeframe**:
- From the settings, choose your desired opening range duration: 30s, 1m, 2m, 5m, 10m, or 15m.
2. **Customize the Visuals**:
- Adjust line color, style, and transparency.
- Enable the **No Trade Zone** for a transparent background fill between the high and low lines.
3. **Interpret the Breakout**:
- Watch for price movements above or below the **opening range** to identify potential breakout opportunities.
---
🛠 Settings:
Opening Range Duration: Select the timeframe for the opening range (30s, 1m, 2m, 5m, 10m, 15m).
Line Color: Set the color of the range lines.
Line Transparency: Adjust the transparency of the lines (0 = solid, 100 = invisible).
Line Style: Choose line style: Solid, Dashed, or Dotted.
Label Colors: Customize the label colors for the high and low values.
Enable No Trade Zone: Fill the area between high and low lines with a transparent color.
No Trade Zone Color: Set the fill color for the no trade zone.
No Trade Zone Transparency: Adjust the transparency of the no trade zone fill.
---
📈 Ideal For
Day traders and scalpers looking to trade **breakouts**.
Traders who want to identify areas of consolidation visually.
Anyone who relies on the **opening range** for their trading strategy.
---
🔍 Example Usage:
Set the opening range to **5 minutes** and enable the **No Trade Zone** with a light red fill.
Watch for price to break above or below the high/low lines to signal potential trade opportunities.
---
✨ Why Use This Indicator?
This script simplifies your breakout strategy by providing a clear, visually appealing representation of the opening range. The flexible customization options and the optional **No Trade Zone** make it a powerful tool for identifying high-probability trades.
---
Let me know if you need any additional tweaks or clarifications for this description. It's all set to help traders understand and use your powerful script! 🚀📈

Fear & Greed Index (Zeiierman)█ Overview
The Fear & Greed Index is an indicator that provides a comprehensive view of market sentiment. By analyzing various market factors such as market momentum, stock price strength, stock price breadth, put and call options, junk bond demand, market volatility, and safe haven demand, the Index can depict the overall emotions driving market behavior, categorizing them into two main sentiments: Fear and Greed.
Fear: Indicates a market scenario where investors are scared, possibly leading to a sell-off or a stagnant market. In such conditions, the indicator helps in identifying potential buying opportunities as assets may be undervalued.
Greed: Represents a state where investors are overly confident and buying aggressively, which can lead to inflated asset prices. The indicator in such cases can signal overbought conditions, advising caution or potential short opportunities.
█ How It Works
The Fear & Greed Index is an aggregate of seven distinct indicators, each gauging a specific dimension of stock market activity. These indicators include market momentum, stock price strength, stock price breadth, put and call options, junk bond demand, market volatility, and safe haven demand. The Index assesses the deviation of each individual indicator from its average, in relation to its typical fluctuations. In compiling the final score, which ranges from 0 to 100, the Index assigns equal weight to each indicator. A score of 100 denotes the highest level of Greed, while a score of 0 represents the utmost level of fear.
S&P 500's Momentum: The Index monitors the S&P 500's position relative to its 125-day moving average. Positive momentum (price above the average) signals growing confidence among investors (Greed), while negative momentum (price below the average) indicates rising fear.
Stock Price Strength: By comparing the number of stocks hitting 52-week highs to those at 52-week lows on the NYSE, the Index gauges market breadth. An extreme number of highs indicates Greed, whereas an extreme number of lows suggests Fear.
Stock Price Breadth (Market Volume): Using the McClellan Volume Summation Index, which considers the volume of advancing versus declining stocks, the Index assesses whether the market is broadly participating in a trend, or if a smaller subset of stocks is driving it.
Put and Call Options: The put/call ratio helps gauge investor sentiment. A rising ratio, particularly above 1, indicates increasing fear, as more investors are buying puts to protect against a decline. A falling ratio suggests growing confidence.
Market Volatility (VIX): The VIX measures expected market volatility. Higher values generally indicate Fear, while lower values point to Greed. The Fear & Greed Index compares the VIX to its 50-day moving average to understand its trend.
Safe Haven Demand: The performance of stocks versus bonds over a 20-day period helps understand where investors are putting their money. Bonds outperforming stocks is a sign of Fear, while the opposite suggests Greed.
Junk Bond Demand: By comparing the yields on junk bonds to safer investment-grade bonds, the Index gauges risk appetite. A narrower yield spread suggests Greed (investors are taking more risk), while a wider spread indicates Fear.
The Fear & Greed Index combines these components, scales, and averages them to produce a single value between 0 (Extreme Fear) and 100 (Extreme Greed).
█ How to Use
The Fear & Greed Index serves as a tool to evaluate the prevailing sentiments in the market. Investors, often driven by emotions, can react impulsively, and sentiment indicators like the Fear & Greed Index aim to highlight these emotional states, helping investors recognize personal biases that might impact their investment choices. When integrated with fundamental analysis and additional analytical instruments, the Index becomes a valuable resource for understanding and interpreting market moods and tendencies.
The Fear & Greed Index operates on the principle that excessive fear can result in stocks trading well below their intrinsic values,
while uncontrolled Greed can push prices above what they should be.
-----------------
Disclaimer
The information contained in my Scripts/Indicators/Ideas/Algos/Systems does not constitute financial advice or a solicitation to buy or sell any securities of any type. I will not accept liability for any loss or damage, including without limitation any loss of profit, which may arise directly or indirectly from the use of or reliance on such information.
All investments involve risk, and the past performance of a security, industry, sector, market, financial product, trading strategy, backtest, or individual's trading does not guarantee future results or returns. Investors are fully responsible for any investment decisions they make. Such decisions should be based solely on an evaluation of their financial circumstances, investment objectives, risk tolerance, and liquidity needs.
My Scripts/Indicators/Ideas/Algos/Systems are only for educational purposes!

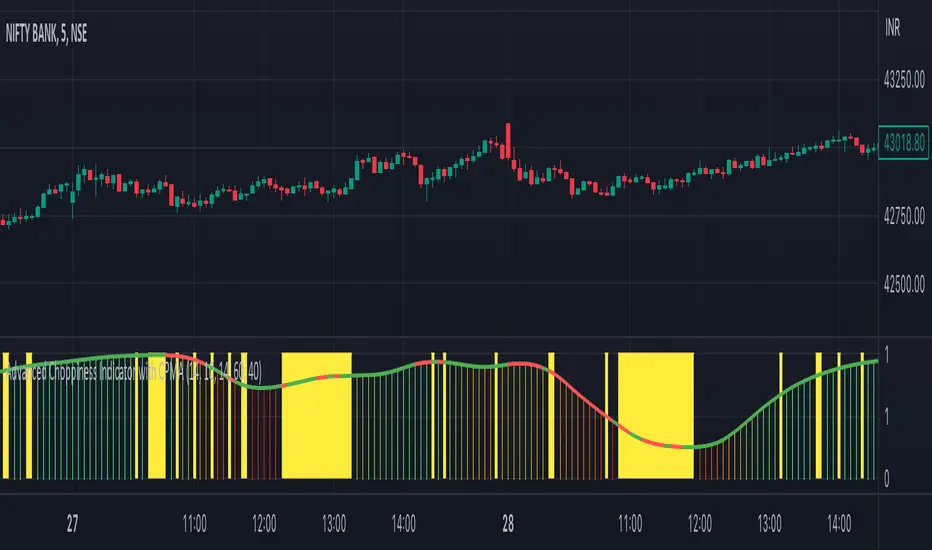
Advanced Choppiness Indicator with CPMA"The Advanced Choppiness Indicator with CPMA is a technical analysis tool designed to assist traders in identifying choppy market conditions and determining trend direction. It combines two key components: the Choppiness Index and a Custom Price Moving Average (CPMA).
The Choppiness Index is calculated using the Average True Range (ATR), which measures market volatility. It compares the ATR to the highest high and lowest low over a specified period. A higher Choppiness Index value indicates choppier market conditions, while a lower value suggests smoother and more directional price movements.
The CPMA is a custom moving average that takes into account various price types, including the close, high, low, and other combinations. It calculates the average of these price types over a specific length. The CPMA provides a smoother trend line that can help identify support and resistance levels more accurately than traditional moving averages.
When using this indicator, pay attention to the following elements:
Yellow range boxes: These indicate choppy zones, where market conditions are characterized by low momentum and erratic price action. Avoid entering trades during these periods.
Histogram bars: Green bars suggest an uptrend, while red bars indicate a downtrend. These bars are based on the CPMA and can help confirm the prevailing trend direction.
CPMA angle: The angle of the CPMA line provides further insight into the trend. A positive angle indicates an uptrend, while a negative angle suggests a downtrend.
Choppiness thresholds: The indicator includes user-defined thresholds for choppiness. Values above the high threshold indicate high choppiness, while values below the low threshold suggest low choppiness.
Trade decisions: Consider the information provided by the indicator to make informed trading decisions. Avoid trading during choppy zones and consider entering trades in the direction of the prevailing trend.
Remember that the indicator's parameters, such as ATR length and CPMA length, can be adjusted to suit your trading preferences and timeframe. However, it's important to use this indicator in conjunction with other technical analysis tools and your trading strategy for comprehensive market analysis."
By combining the Choppiness Index, CPMA, and other visual cues, this indicator aims to help traders identify suitable trading conditions and make more informed decisions based on market trends and volatility.
Range Sentiment Profile [LuxAlgo]The Range Sentiment Profile indicator is inspired from the volume profile and aims to indicate the degree of bullish/bearish variations within equidistant price areas inside the most recent price range.
The most bullish/bearish price areas are highlighted through lines extending over the entire range.
🔶 SETTINGS
Length: Most recent bars used for the calculation of the indicator.
Rows: Number of price areas the price range is divided into.
Use Intrabar: Use intrabar data to compute the range sentiment profile.
Timeframe: Intrabar data timeframe.
🔶 USAGE
This tool can be used to easily determine if a certain price area contain more significant bullish or bearish price variations. This is done by obtaining an estimate of the accumulation of all the close to open variations occurring within a specific profile area.
A blue range background indicates a majority of bullish variations within each area while an orange background indicates a majority of bearish variations within each area.
Users can easily identify the areas with the most bullish/bearish price variations by looking at the bullish/bearish maximums.
It can be of interest to see where profile bins might have no length, these can indicate price areas with price variations with alternating signs (bullish variations are followed by a bearish sign) and similar body. They can also indicate a majority of either bullish or bearish variations alongside a minority of more significant opposite variations.
These areas can also provide support/resistance, as such price entering these areas could reverse.
Users can obtain more precise results by allowing the profile to use intrabar data. This will change the calculation of the profile, see the details section for more information.
🔶 DETAILS
The Range Sentiment Profile's design is similar to the way a volume profile is constructed.
First the maximum/minimum values over the most recent Length bars are obtained, these define the calculation range of the profile.
The range is divided into Rows equidistant areas. We then see if price lied within a specific area, if it's the case we accumulate the difference between the closing and opening price for that specific area.
Let d = close - open . The length of the bin associated to a specific area is determined as follows:
length = Width / 100 * Area / Max
Where Area is the accumulated d within the area, and Max the maximum value between the absolute value of each accumulated d of all areas.
The percentage visible on each bin is determined as 100 multiplied by the accumulated d within the area divided by the total absolute value of d over the entire range.
🔹 Intrabar Calculation
When using intrabar data the range sentiment profile is calculated differently.
For a specific area and candle within the interval, the accumulated close to open difference is accumulated only if the intrabar candle of the user selected timeframe lies within the area.
This can return more precise results compared to the standard method, at the cost of a higher computation time.

Simple Chop ZoneThe original Chop Zone indicator by Trading View is good, but has a few limitations which I've addressed in this one
Too many colors which confuse and/or overwhelm users like me
Inability to change the EMA period
This one has just 3 customizable colors for
Uptrend - default = Turquoise
Downtrend - default = red
Everything else - default = lime
And you can set your own EMA length. The default is 34 as per the original Chop Zone indicator

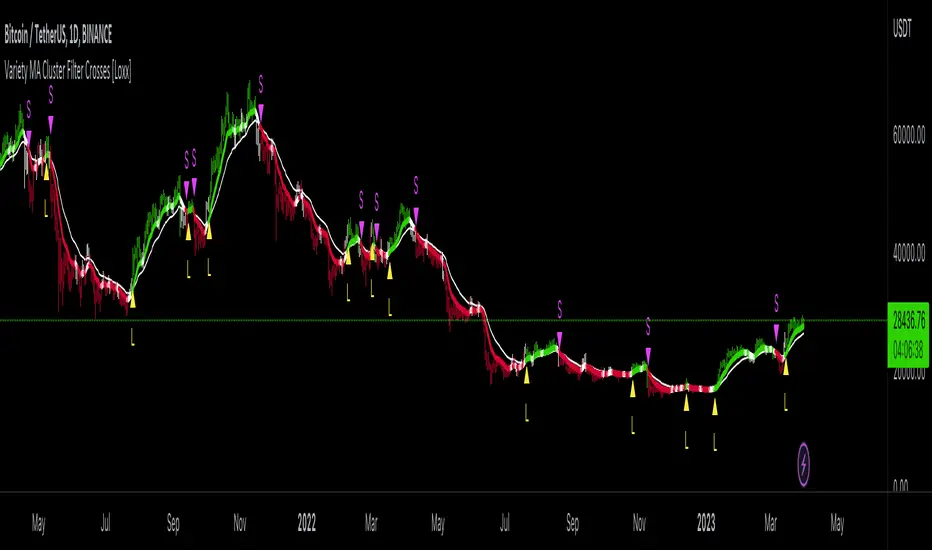
Variety MA Cluster Filter Crosses [Loxx]What is a Cluster Filter?
One of the approaches to determining a useful signal (trend) in stream data. Small filtering (smoothing) tests applied to market quotes demonstrate the potential for creating non-lagging digital filters (indicators) that are not redrawn on the last bars.
Standard Approach
This approach is based on classical time series smoothing methods. There are lots of articles devoted to this subject both on this and other websites. The results are also classical:
1. The changes in trends are displayed with latency;
2. Better indicator (digital filter) response achieved at the expense of smoothing quality decrease;
3. Attempts to implement non-lagging indicators lead to redrawing on the last samples (bars).
And whereas traders have learned to cope with these things using persistence of economic processes and other tricks, this would be unacceptable in evaluating real-time experimental data, e.g. when testing aerostructures.
The Main Problem
It is a known fact that the majority of trading systems stop performing with the course of time, and that the indicators are only indicative over certain intervals. This can easily be explained: market quotes are not stationary. The definition of a stationary process is available in Wikipedia:
A stationary process is a stochastic process whose joint probability distribution does not change when shifted in time.
Judging by this definition, methods of analysis of stationary time series are not applicable in technical analysis. And this is understandable. A skillful market-maker entering the market will mess up all the calculations we may have made prior to that with regard to parameters of a known series of market quotes.
Even though this seems obvious, a lot of indicators are based on the theory of stationary time series analysis. Examples of such indicators are moving averages and their modifications. However, there are some attempts to create adaptive indicators. They are supposed to take into account non-stationarity of market quotes to some extent, yet they do not seem to work wonders. The attempts to "punish" the market-maker using the currently known methods of analysis of non-stationary series (wavelets, empirical modes and others) are not successful either. It looks like a certain key factor is constantly being ignored or unidentified.
The main reason for this is that the methods used are not designed for working with stream data. All (or almost all) of them were developed for analysis of the already known or, speaking in terms of technical analysis, historical data. These methods are convenient, e.g., in geophysics: you feel the earthquake, get a seismogram and then analyze it for few months. In other words, these methods are appropriate where uncertainties arising at the ends of a time series in the course of filtering affect the end result.
When analyzing experimental stream data or market quotes, we are focused on the most recent data received, rather than history. These are data that cannot be dealt with using classical algorithms.
Cluster Filter
Cluster filter is a set of digital filters approximating the initial sequence. Cluster filters should not be confused with cluster indicators.
Cluster filters are convenient when analyzing non-stationary time series in real time, in other words, stream data. It means that these filters are of principal interest not for smoothing the already known time series values, but for getting the most probable smoothed values of the new data received in real time.
Unlike various decomposition methods or simply filters of desired frequency, cluster filters create a composition or a fan of probable values of initial series which are further analyzed for approximation of the initial sequence. The input sequence acts more as a reference than the target of the analysis. The main analysis concerns values calculated by a set of filters after processing the data received.
In the general case, every filter included in the cluster has its own individual characteristics and is not related to others in any way. These filters are sometimes customized for the analysis of a stationary time series of their own which describes individual properties of the initial non-stationary time series. In the simplest case, if the initial non-stationary series changes its parameters, the filters "switch" over. Thus, a cluster filter tracks real time changes in characteristics.
Cluster Filter Design Procedure
Any cluster filter can be designed in three steps:
1. The first step is usually the most difficult one but this is where probabilistic models of stream data received are formed. The number of these models can be arbitrary large. They are not always related to physical processes that affect the approximable data. The more precisely models describe the approximable sequence, the higher the probability to get a non-lagging cluster filter.
2. At the second step, one or more digital filters are created for each model. The most general condition for joining filters together in a cluster is that they belong to the models describing the approximable sequence.
3. So, we can have one or more filters in a cluster. Consequently, with each new sample we have the sample value and one or more filter values. Thus, with each sample we have a vector or artificial noise made up of several (minimum two) values. All we need to do now is to select the most appropriate value.
An Example of a Simple Cluster Filter
For illustration, we will implement a simple cluster filter corresponding to the above diagram, using market quotes as input sequence. You can simply use closing prices of any time frame.
1. Model description. We will proceed on the assumption that:
The aproximate sequence is non-stationary, i.e. its characteristics tend to change with the course of time.
The closing price of a bar is not the actual bar price. In other words, the registered closing price of a bar is one of the noise movements, like other price movements on that bar.
The actual price or the actual value of the approximable sequence is between the closing price of the current bar and the closing price of the previous bar.
The approximable sequence tends to maintain its direction. That is, if it was growing on the previous bar, it will tend to keep on growing on the current bar.
2. Selecting digital filters. For the sake of simplicity, we take two filters:
The first filter will be a variety filter calculated based on the last closing prices using the slow period. I believe this fits well in the third assumption we specified for our model.
Since we have a non-stationary filter, we will try to also use an additional filter that will hopefully facilitate to identify changes in characteristics of the time series. I've chosen a variety filter using the fast period.
3. Selecting the appropriate value for the cluster filter.
So, with each new sample we will have the sample value (closing price), as well as the value of MA and fast filter. The closing price will be ignored according to the second assumption specified for our model. Further, we select the МА or ЕМА value based on the last assumption, i.e. maintaining trend direction:
For an uptrend, i.e. CF(i-1)>CF(i-2), we select one of the following four variants:
if CF(i-1)fastfilter(i), then CF(i)=slowfilter(i);
if CF(i-1)>slowfilter(i) and CF(i-1)slowfilter(i) and CF(i-1)>fastfilter(i), then CF(i)=MAX(slowfilter(i),fastfilter(i)).
For a downtrend, i.e. CF(i-1)slowfilter(i) and CF(i-1)>fastfilter(i), then CF(i)=MAX(slowfilter(i),fastfilter(i));
if CF(i-1)>slowfilter(i) and CF(i-1)fastfilter(i), then CF(i)=fastfilter(i);
if CF(i-1)<slowfilter(i) and CF(i-1)<fastfilter(i), then CF(i)=MIN(slowfilter(i),fastfilter(i)).
Where:
CF(i) – value of the cluster filter on the current bar;
CF(i-1) and CF(i-2) – values of the cluster filter on the previous bars;
slowfilter(i) – value of the slow filter
fastfilter(i) – value of the fast filter
MIN – the minimum value;
MAX – the maximum value;
What is Variety MA Cluster Filter Crosses?
For this indicator we calculate a fast and slow filter of the same filter and then we run a cluster filter between the fast and slow filter outputs to detect areas of chop/noise. The output is the uptrend is denoted by green color, downtrend by red color, and chop/noise/no-trade zone by white color. As a trader, you'll likely want to avoid trading during areas of chop/noise so you'll want to avoid trading when the color turns white.
Extras
Bar coloring
Alerts
Loxx's Expanded Source Types, see here:
Loxx's Moving Averages, see here:
An example of filtered chop, see the yellow circles. The cluster filter identifies chop zones so you don't get stuck in a sideways market.
Big Whale Purchases and SalesBig Whale Purchases and Sales - plots big whale transactions on your chart!
People that hold more than 1% of a crypto currencies circulating supply are considered whales and have a huge influence on price, not just because they can move the market with their huge transactions, but also because other traders often track their wallets and follow their example. Taking a look at whale holdings, one can see why whale worship is so common in crypto: While Bitcoin has a relatively low whale concentration, many of the Top 100 Cryptocurrencies have whales control 60% or more of their circulating supply.
Integrating IntoTheBlock data, this script plots the transactions of these whales and, in strategy mode, copy trades them.
Features:
Strategy Mode: Switches the script between an indicator and a strategy.
Standard Deviations: The number of Standard Deviations that a transaction needs to surpass to be considered worth plotting. Setting this to 0 will show all whale transactions, higher settings will only show the biggest transactions.
Blockchain: The Chain on which Whale activity is tracked.

BTC Twitter SentimentBTC Twitter Sentiment - shows the total numbers of all negative, neutral and positive Bitcoin related tweets.
On default settings, the tweets are plotted in red (negative) white (neutral) as well as green (positive). The three charts are stacked so the total number of tweets is easily discernible.
Furthermore, there's an optional smoothing setting in the options.
The Twitter Sentiment data is provided daily by IntoTheBlock; Since data is only updated once a day the graph might look chunky on lower timeframes, even with smoothing.

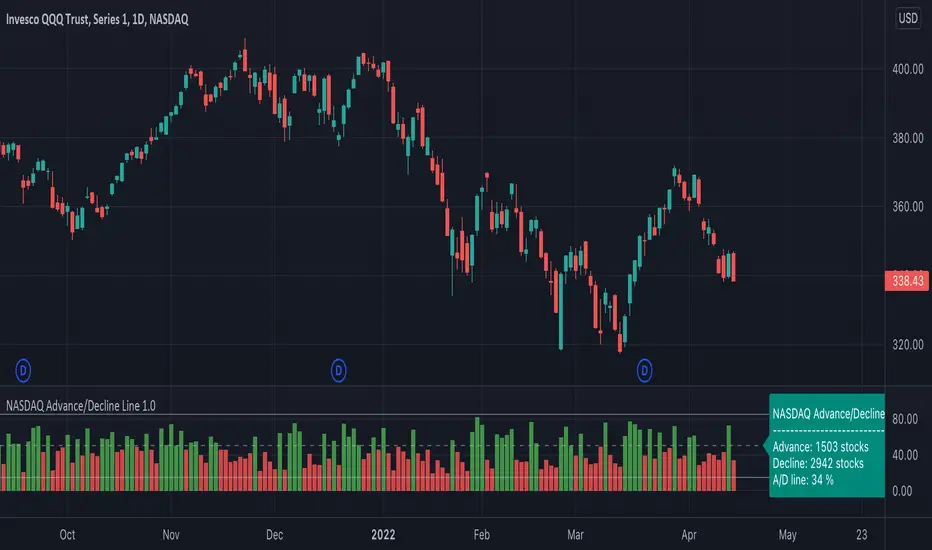
NASDAQ Advance/Decline Line 1.0NASDAQ Advance/Decline Line is a Market Breath indicator.
Brought to you by IQ-trading (Andrei Bogdan) via Trading View Pine script. If you find this helpful in anyway, please leave a like!
A/D line calculates a ratio between total number of NASDAQ stocks advancing and total number of NASDAQ stocks in one day, providing another way to grasp the market breath at any moment.A
Green columns mean more than 50% of NASDAQ stocks are advancing, red columns mean more than 50% of NASDAQ stocks are declining.
Green values above the top band mean correlation to the upside, red values bellow the low band mean correlation to the downside.
Correlation means rising probability of capitulation (to the upside or to the downside).
For a better interpretation, NASDAQ Advance/Decline Line should be used in conjunction with other indicators (volatility, volume, etc.).
--------------------
NASDAQ here refers to the totality of assets listed on the NASDAQ exchange, not to the Nasdaq Composite index or the Nasdaq100 index.
NASDAQ is the second-largest stock exchange on earth, and operates the two major stock indexes based on companies that trade on its exchange: the Nasdaq Composite and the Nasdaq 100.
The Nasdaq Composite tracks the performance of more than 3,000 stocks listed on the Nasdaq while the Nasdaq 100 captures the performance of the exchange’s largest non-financial companies.
MM Chop FilterBased On the "Chop and explode Indicator by fhenry0331
We Updated to Pine 5
- Added break out alerts and Signals
-Customize thresholds
How To use
when the line is blue confirmed Buy
Line is Red confirmed Sell
ALWAYS use in confirmation with your strategy and Trade with the trend.
Match with the on chart version for best results

Chop Zone - SamXThis is my spin on the Chop Zone indicator. It was forked from the built-in TradingView Chop Zone indicator. There were several reasons for this effort...
The built-in indicator version had no real configuration options
It was hard-coded to use the 34-period EMA with fixed span sizes for identifying price range
There was no real context to the meaning of default color scheme
The separation points of the chop zone bars was at a fixed 1.43-degree scale
Note: If left at default settings, this indicator will exactly match the built-in Chop Zone indicator.
WARNING : Please be sure you understand the potential impact and implications before adjusting any of the settings in the "Advanced Configuration" section!!!
Chop Zone with discrete/standard coloring:
Chop Zone with gradient fill:
Moving Average angle plot with gradient fill:

Choppiness Index TileA simple tile on the chart that indicates the choppiness index on the chart for the chart's timeframe. The index tile will show 3 different colors based on the value of the choppiness index. 61.8 for the high threshold and 38.2 for the lower threshold.

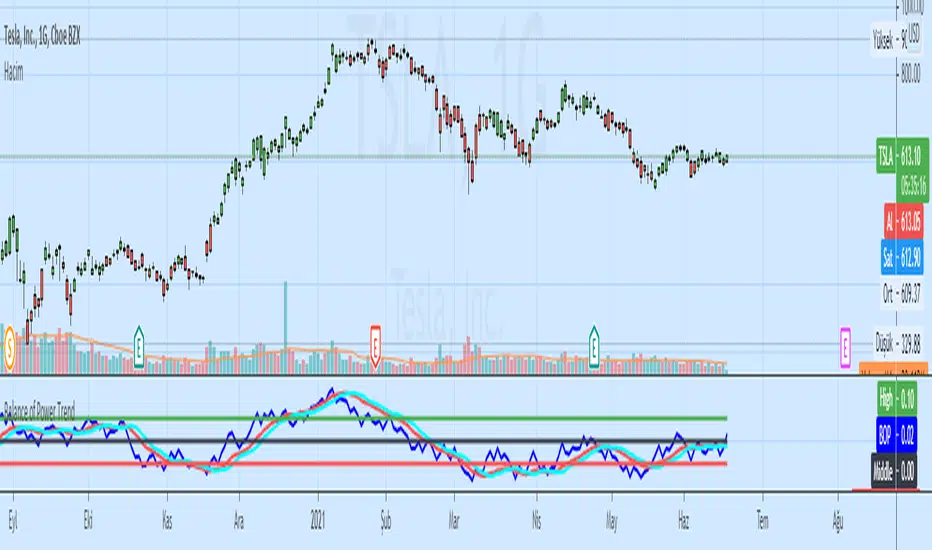
Volume Weighted Balance of PowerAs always, this is not financial advice and use at your own risk. Trading is risky and can cost you significant sums of money if you are not careful. Make sure you always have a proper entry and exit plan that includes defining your risk before you enter a trade.
I have modified the Balance of Power indicator that measures the difference between the open and the close and the high and low of the current bar to incorporate volume information as well. Further, I have smoothed the indicator, which is usually very choppy and difficult to read with a 21 period Least Squares Moving Average to create a Volume-Weighted Balance of Power. Since we are all aware that volume precedes price I figured this could be a neat little trend-confirmation indicator.
Uses:
1) The indicator is fairly straight forward, when it crosses below its zero line, this signals that there is more selling pressure in the current market vs. buying. Conversely, when it crosses above its zero line, this means more buyers have stepped up and are pushing prices higher.
2) It is sensitive enough to volume and price shifts that it produce divergences, which are often thought to be some of the most powerful trading signals in any market.
3) Use this tool to confirm breaks from trendlines or trading ranges to see if there is enough pressure and volume to support the move.
Enjoy and trade responsibly!

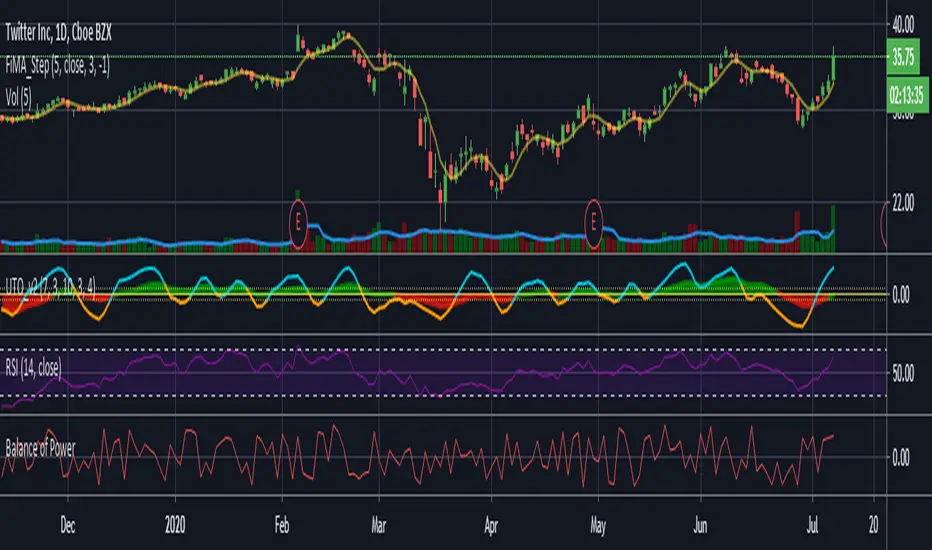
+ Balance of PowerThe Balance of Power is an indicator that measures the strength of buyers versus that of sellers in the market, and needs to be smoothed by a moving average to be of much practical use (come to think of it, most indicators are smoothed by a moving average; this is why the RSI lookback mostly commonly used is 14, and not 1, but I digress...). I suppose it is possible to use it without smoothing, but that would be very difficult I think.
The oscillator pivots around a center line, and as with most indicators like this, above 0 is generally considered bullish in a bullish trend, and vice versa in a downtrend.
It can be good for spotting divergences (moreso with smaller lookback periods than I like).
To wit, you might be wondering why I have the default lookback period set at such a large number. My only answer I can give is that I prefer it that way.
The indicator is quite choppy, even when smoothed. The long period helps me to make beter sense of the data (smooth it with a Hull or Jurik MA and you get a different story, though).
In my version of this indicator I provide a pretty broad selection of moving averages with which one may choose to smooth out the BOP, as well as an EMA provided to use as a sort of signal line for trade entries and/or exits, taking partial profits, scaling into a position, etc.
I've also added the option for a second BOP, which is on by default. I think you might find the results interesting by pairing differently smoothed BOPs together.
Of course, you don't have to use both. In the case of the default settings you might look at the EMA-BOP crossing the JMA-BOP as an opportunity to look into exiting or entering trades.
Candle coloring is, as usual, included. I'd say I kind of overdid it here, but that seems to be my style. I just couldn't deal with the fact that with the indicator set to cumulative modes there is no zero line, therefor the color of the indicator plot and the candle coloring would not match the color swatches for bullish/bearish colors. So, there are selections for cumulative indicator/candle colors, and standard indicator/candle colors. Donchian Channels obviously doesn't matter because the colors of things are based on the channel only.
I've added Donchian channel bands (which I've begun adding to many of my indicators), and all necessary alerts as well.
The Donchian Channels can be a really effective tool for entering and exiting trades. I haven't mentioned it in my other indicators that have it, so I will here:
The outermost edge of the band is that which references the indicator for where it is plotted, and the inner channel is sort of dragged along, creating the band
It's a simple mathematical calculation that TradingView actually provided themselves in their manual for pinescript.
When the BOP (or any other indicator using this) enters the band and then exits that could be an indication that price may be reversing, this the bands themselves act, or rather, show a current area of support/resistance for the BOP plot.
One thing that I did with it that they did not, is give the user the ability to change the width of the band. It can only go so narrow, obviously, but anywhere from three (quite wide) to eight is probably sufficient.
I've also provided the option of plotting the BOP as a cumulative line (like OBV), making it no longer an indicator which oscillates around a central pivot.
Because the balance of power is plotted as an accumulation, you may actually want to set the lookback to 1 (it works because it's not an oscillator then).
If you wish to smooth the noise, I suspect a low number would be acceptable here, but it's not necessary.
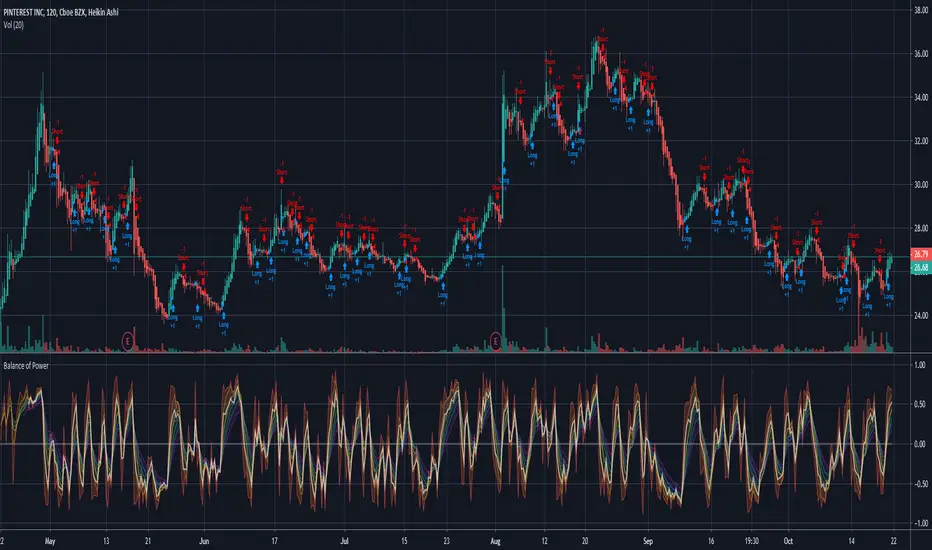
Oh, and lastly (almost forgot, as this was a late addition), I've added options for the BOPs calculated with volume as well. Gives a different bit of a perspective on the market, versus the traditional version which does not include volume. Screenshots below.
The above image is the balance of power calculated with volume. You can see the obvious difference versus the traditional indicator, where price is in a downtrend and you'd want to sell the orange.
Cumulative version. Looks a lot like OBV.
Cumulative version with volume.

CHOP Zone Entry Strategy + DMI/PSAR ExitThis is a Strategy with associated visual indicators and Long/Short and Reverse/Close Position Alerts for the Choppiness Index (CHOP) . It is used to determine if the market is choppy (trading sideways) or not choppy (trading within a trend in either direction). CHOP is not directional, so a DMI script was ported into this strategy to allow for trend confirmation and direction determination; it consists of an Average Directional Index (ADX) , Plus Directional Indicator (+DI) and Minus Directional Indicator (-DI) . In addition, a Parabolic SAR is also included to act as a trailing stop during any strong trends.
Development Notes
---------------------------
This indicator, and most of the descriptions below, were derived largely from the TradingView reference manual. Feedback and suggestions for improvement are more than welcome, as well are recommended Input settings and best practices for use.
www.tradingview.com
www.tradingview.com
www.tradingview.com
Recommend using the below DMI and PSAR indicators in conjunction with this script to fully visualize and understand how entry and exit conditions are chosen. Variable inputs should correlate between the scripts for uniformity and visual compatibility.
THANKS to LazyBear and his Momentum Squeeze script for helping me quickly develop a momentum state model for coloring the Chop line by trend.
Strategy Description
---------------------------
CHOP produces values that determine whether the market is choppy or trending . The closer the value is to 100 , the higher the choppiness levels , while the closer it is to 0 , the stronger the market is trending . Territories for both levels, and their associated upper and lower thresholds, are popularly defined using the Fibonacci Retracements, 61.8 and 38.2.
Basic Use
---------------------------
CHOP is often used to confirm the market condition to help you stay out of sideways markets and only enter when there is movement or imminent explosions. When readings are above the upper threshold, continued sideways movement may be expected, while readings below the lower threshold are typically indicative of a continuing trend. It is also used to anticipate upcoming trendiness changes, with the general belief that extended periods of consolidation (sideways movement) are followed by extended periods of strong, trending, directional movement, and vice versa.
One limitation in this index is that you must be cautious in deciding whether the range or trend will likely continue, or if it will reverse.
Confidence in price action and trend is higher when two or more indicators are in agreement -- while this strategy combines CHOP with both DMI and PSAR, we would still recommend pairing with other indicators to determine entry or exit trade opportunities.
Recommend also choosing 'Once Per Bar Close' when creating alerts.
Inputs
---------------------------
Strategy Direction - an option to only trade Short, Long, Both, or only in the direction of the Trend (Follow Trend is the Default).
Sensitivity - an incremental variable to test whether the past n candles are in the same trend state before triggering a delayed long or short alert (1 is the Default). Can help filter out noise and reduces active alerts.
Show Chop Index - two visual styles are provided for user preference, a visible Chop line with a background overlay, or a compact column and label only view.
Chop Lookback Period - the time period to be used in calculating CHOP (14 is the Default).
Chop Offset - changing this number will move the CHOP either forwards or backwards relative to the current market (0 is the Default).
Smooth Chop Line and Length - if enabled, the entered time period will be used in calculating a smooth average of the index (Enabled and 4 are the Defaults).
Color Line to Trend Direction - toggles whether the index line is colored to visually depict the current trend direction (Enabled is the Default).
Color Background - toggles the visibility of a background color based on the index state (Enabled is the Default).
Enable DMI Option - if enabled, then entry will be confirmed by and dependent on the ADX Key Level, with any close or reversal confirmed by both ADX and +/-DI to determine whether there is a strong trend present or not (Enabled is the Default).
ADX Smoothing - the time period to be used in calculating the ADX which has a smoothing component (14 is the Default).
DI Length - the time period to be used in calculating the DI (14 is the Default).
ADX Key Level - any trade with the ADX above the key level is a strong indicator that it is trending (23 to 25 is the suggested setting).
Enable PSAR Option - enables trailing stop loss orders (Enabled is the Default).
PSAR Start - the starting value for the Acceleration Force (0.015 is our chosen Default, 0.02 is more common).
PSAR Increment - the increment in which the Acceleration Force will move (0.001 is our chosen Default, 0.02 is more common).
PSAR Max Value - the maximum value of the Acceleration Factor (0.2 is the Default).
Color Candles Option - an option to transpose the CHOP condition levels to the main candle bars. Note that the outer red and green border will still be distinguished by whether each individual candle is bearish or bullish during the specified timeframe.
Note too that if both DMI and PSAR are deselected, then close determinations will default to a CHOP reversal strategy (e.g., close long when below 38.2 and close short when above 61.8). Though if either DMI or PSAR are enabled, then the CHOP reversal for close determination will automatically be disabled.
Indicator Visuals
---------------------------
For the candle colors, black indicates tight chop (45 to 55), yellow is loose chop (38.2 to 45 and 55 to 61.8), dark purple is trending down (< 38.2), and dark blue is trending up (> 61.8).
The background color has additional shades to differentiate a wider range of more levels…
• < 30 is dark purple
• 30 to 38.2 is purple
• 38.2 to 45 is light purple
• 45 to 55 is black
• 55 to 61.8 is light blue
• 61.8 to 70 is blue
• > 70 is dark blue
Long, Short, Close, and Reverse labels are plotted on the Chop line, which itself can be colored based on the trend. The chop line can also be hidden for a clean and compact, columnar view, which is my preferred option (see example image below).
Visual cues are intended to improve analysis and decrease interpretation time during trading, as well as to aid in understanding the purpose of this strategy and how its inclusion can benefit a comprehensive trading plan.
DMI and Trend Strength
---------------------------
To analyze trend strength, the focus should be on the ADX line and not the +DI or -DI lines. An ADX reading above 25 indicates a strong trend , while a reading below 20 indicates a weak or non-existent trend . A reading between those two values would be considered indeterminable. Though what is truly a strong trend or a weak trend depends on the financial instrument being examined; historical analysis can assist in determining appropriate values.
DMI exits trade when ADX is below the user selected key level (e.g., default is 25) and when the +/- DI lines cross (e.g., -DI > +DI exits long position and +DI > -DI exits short position).
PSAR and Trailing Stop
---------------------------
PSAR is a time and price based indicator that excels at measuring direction and duration, though not the actual strength of a trend, which is why we use this in conjunction with DMI. It is also included in this script as a trailing stop option to maximize gains during strong trends and to mitigate any false ADX strengthening signals.
This creates a parabola that is located below the candle during a Bullish trend and above during a Bearish trend. A buy or reversal is signaled when the price crosses above or below the Parabolic SAR.
Long/Short Entry
---------------------------
1. CHOP must be over 61.8 (long) or under 38.2 (short).
2. If DMI is enabled, then the ADX signal line must be above the user selected Key Level (default is 25).
3. If Sensitivity is selected, then that past candle must meet the criteria in step 1, as well as all the intermediate candles in between.
4. If "Follow Trend" is selected and PSAR is enabled, then a long position can only open when the momentum and PSAR are in an uptrend, or short when both are in a downtrend, to include all intermediate candles if the Sensitivity option is set on a past candle.
Close/Reverse
---------------------------
1. If DMI is enabled, then a close flag will be raised when the ADX signal drops below the Key Level (of 25), and -DI crosses over +DI (if long), or +DI crosses over -DI (if short).
2. If PSAR is enabled, then a close flag will be raised when the current trend state is opposite the last state.
3. If both DMI and PSAR are disabled, then a close flag will be raised if the Chop line drops under 38.2 (if long) or goes over 61.8 (if short).
4. If a Long or Short Entry is triggered on the same candle as any of the above close flags, then the position will be reversed, else the position will be closed.
Strategy Alerts
---------------------------
1. Long Entry
2. Short Entry
3. Reverse
4. Close
The provided backtest result is based on a position sizing of 10% equity with 100k initial capital. When testing SPX, disabling the DMI performed the best, but EURUSD performed poorly without it enabled, and TSLA had a small reduction in net profit. Timeframe likewise differed between commodities with TSLA performing best at 30M, SPX at 15M, and EURUSD at 4H. I do not plan on using this as a standalone strategy, but I also was expecting better results with the inclusion of EMI and PSAR to compliment the CHOP. Key elements of this script will likely be included in future, more holistic strategies.
Disclaimer
---------------------------
Past performance may not be indicative of future results. Due to various factors, including changing market conditions, the strategy may no longer perform as well as in historical backtesting. This post and the script are not intended to provide any financial advice. Trade at your own risk.
No known repainting, though there may be if an offset is introduced in the Inputs. I did my best not to code any other variables that repaint, but cannot fully attest to this fact.

Ultimate Trader Oscillator - UTO v1Note; this is experimental / learning work -- has nothing to do with the existing "Ultimate Oscillator" -- i call this project UTOpia :)
This is based on some research work i was doing around the Balance Of Power - which i posted about in the past
the conclusion form there was a questions of, what would we get if we create an indicator that takes into consideration other factors that may be affecting momentum - so while the classic Balance of Power formula looks at where the open and close of a bar are compared to the full bar range, this is only a small part of the insight we need - when we visually inspect a price chart, we also look at many other factors. for example, how the bar closes compared to previous bar(s), how much did the bulls (or bears) managed to move the high (or low) of the bar compared to previous one, how much volume, how is the price spread ...etc
so i wanted to build an indicator that does exactly that - we will give a score of +100 / -100 to each bar based on these factors (some were identified in the linked post) -- imagine here that we are a judge in a tug of war contest (or a beauty contest if you would :)) and we give a score to the participating teams - the scores are given in different "categories" as these teams make effort to win the game (each bar) - to be totally fair, in some scoring categories, we choose to take the average of 3 points for a fair assessment - the final score is calculated based on the average from all judges - and then and average over the desired length is calculated. this score should be very fair and represents the true effort from all angles, right? that would be our UTOPIA :)
in our case, we don't use an average of total score after each category is evaluated, but rather create a directional index (similar to RSI) -- so we can avoid big spikes in the resulting numbers, and maintain a oscillator -like result.
-- the code is commented to explain the various pieces - and how the scoring happen.
the results are interesting - and you can see how the UTO stacks against the classic RSI and BoP - but it's more of a work to build on, rather than a usable indicator - although i do use it in my own trading :)
one final thought here, i came to learn after few years that the best indicators do not necessarily lead to profitable trading. from an indicator standpoint, if everyone else is trading using (for example) a moving average crossover or RSI, then a successful trader should be looking at these classic indicators too, cause these common indicators will drive the mass behavior - and will at many times trigger "self- fulfilling prophesies" in price action - but that's not the only or the biggest reason - the big reasons have to do with the fact that trading needs a lot of effort outside the charts, in researching markets, learning the discipline, then managing positions and managing the portfolio. these are all big topics to put in such short words.
i hope some will find this work inspiring.
Balance of Power StrategyA simple variation on the balance of power idea, using a weighted moving average and a basic lookback to attempt to predict the motion in the next tick.
As far as a trading pattern goes, it's performance is rather conservative, and it is rather noisy as it doesn't do a good job of preventing quick, meaningless trades.
Woodies CCI + CZ + SW indicatorsBased on
Changes:
- red bars removed and replaced by silver ones
- yellow bar (start of new trend) had been added
- more parameters can be set in settings dialogue (SW constants as well)

Chop Zone Strategy - Buy OnlyUses build-in indicator "Chop Zone" which measures angle of EMA-34.
Buy when there are 3 consecutive turquoise bar.
Close when there are 3 consecutive non-turquoise bar.

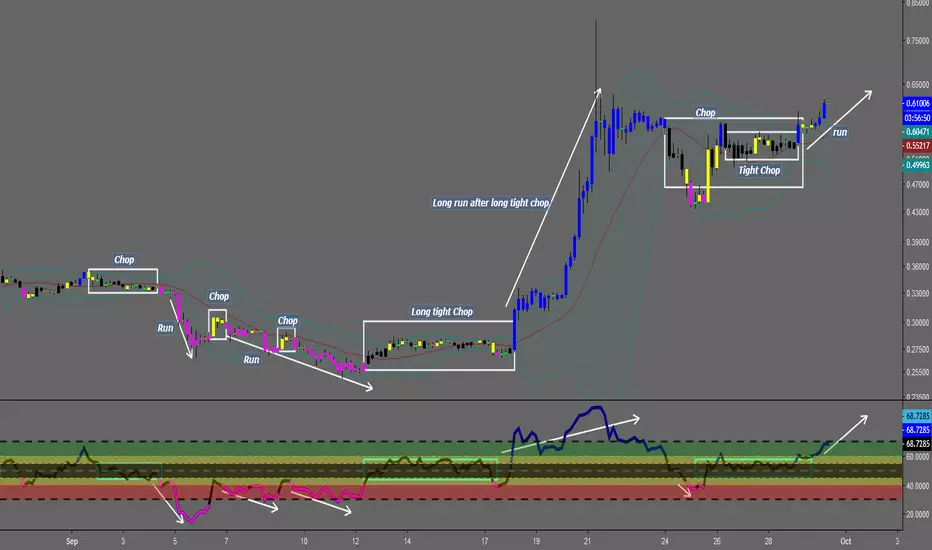
Chop and explodeThe purpose of this script is to decipher chop zones from runs/movement/explosion
The chop is RSI movement between 40 and 60
tight chop is RSI movement between 45 and 55. There should be an explosion after RSI breaks through 60 (long) or 40 (short). Tight chop bars are colored black, a series of black bars is tight consolidation and should explode imminently. The longer the chop the longer the explosion will go for. tighter the better.
Loose chop (whip saw/yellow bars) will range between 40 and 60.
the move begins with blue bars for long and purple bars for short.
Couple it with your trading system to help stay out of chop and enter when there is movement. Use with "Simple Trender."
Best of luck in all you do. Get money.