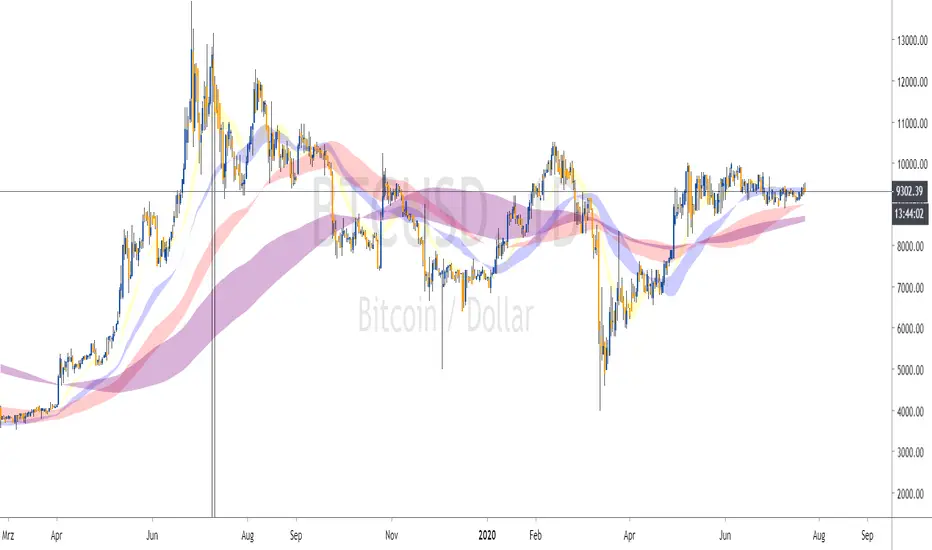
Static + Dynamic LevelsShows static and dynamic levels which can act as support/resistance. These are important as there is a lot of users who are interested in buying/selling at these prices.
Static Levels include -
Daily/Weekly/Monthly/Yearly Open (changes color depending on if below or above price)
Previous Daily/Weekly/Monthly/Yearly Open
Previous day's High/Low
Dynamic Levels include -
100/200 Daily MA
100/200 Weekly MA
Simple Moving Average (SMA)

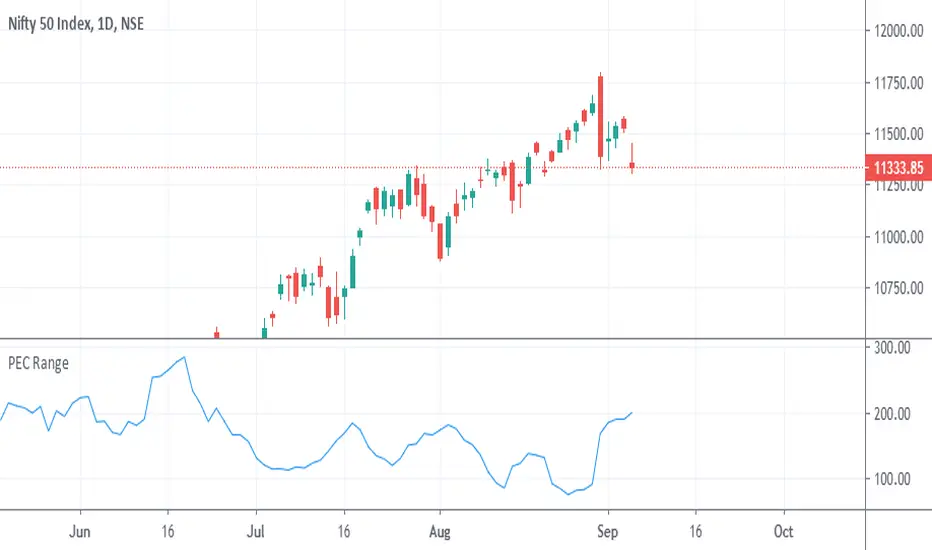
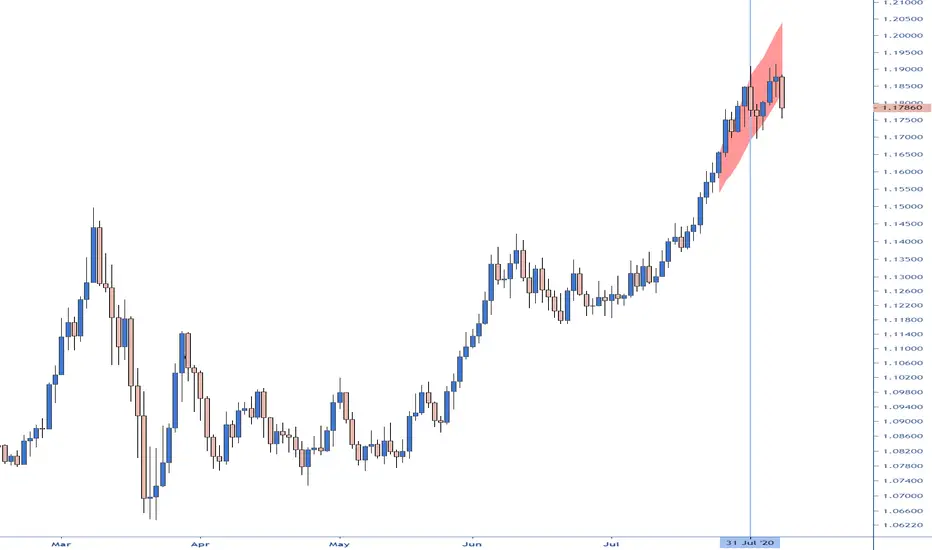
PEC Range (Prefer on 1D chart)Price Expansion and Contraction is basic calculation of Candles High-Low and it is average of previous 5 High-Low. Which will help to analyse volatility of running situation. This can be used for analysis purpose only not as buy/sell signals.
How to use this?
Ranges of candles may increase on lower value of PEC.
Ranges of candles may decrease on high of PEC.
This is not ATR of 5 period.
Barcolor Averaging1. Colors candles or bars, ascending (blue) or descending (red), as determined by the MA setting.
2. Colors candles white when the MA is flat, or the market is moving sideways or in consolidation.

Moving Average Colored EMA/3 SMA1. Updated this available script to have 2 SMA's and 2 EMA's.
2. Revised so that plot turns white when flat.
3. Added Trend Gain to control what slope "flat" has for different TF's.

Camilo MA 20 40 100 200Adds the following:
- Adds moving average for the following periods: 20, 40, 100, 200. These moving average are used to understand the context of the stock. 20 and 40 are for hourly use, and 100 and 200 are for daily use.
- Adds red background color when RSI is over 70 and green background when RSI is less than 30.
- Adds arrow to first bar chart to identify the gaps.

Golden Ratio MultiplierThe moving averages 350 and 111 by themselves do a great job of identifying market tops/bottoms. The fraction 350/111 is very close to Pi as well (3.15) so that's is suspicious in its own right.
Nonetheless, fibonacci retracements/multiplies of the 350 SMA does a remarkable job of finding reversal points. I commented out a couple of multiplies for simplicity's sake (the lines became rather crowded). However, the script is open source so you all can copy it into Pine Editor and delete the "//" and add it back to the script.
Cheers.

AK Simple Moving Average 50 days Simple Moving average suitable for Intraday on 1Hr,30Min.15Min Time frames
1. When candle crossing above SMA Line - Go for Long Entries
2. When candle crossing below SMA Line - Go for short Entries
SMA 8 & 20 & 50This is a colored moving average for the 8, 20 and 50 SMA. You can switch the values if you would like. The color is based off the slope of the moving average, I is very simple yet valuable indicator. The market will generally stay above the 8 and 20, with every now and then testing the 50 sma. Of coarse that is when moving upward in price action. The same can be said in a bear market.

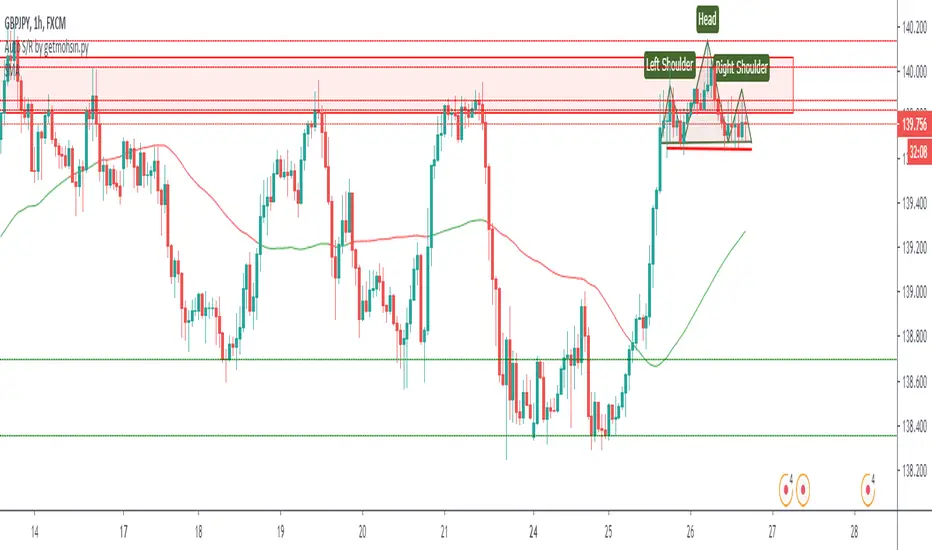
Deep_Fractal_Signals_and_Rubber_Band_TradesThis indicator is based on Williams Fractals and the TopDog Trading "Rubber Band Trade"
The Deep Fractal Signals are triangles that indicate the price is forming a pattern of decreasing lows in a down trend (orange) or, increasing highs in an up trend (green).
The triangles are placed above or below the last bar of the pattern, unlike Fractals which are drawn 2 candles prior to the current candle, and are re-painted on the chart.
When the triangle is indicated above the moving average in a down trend (blue), or below the moving average in an up trend (yellow), this is a Rubber Band Trade.
When the slope of the moving average is less than the Gain set by the user, or are counter-trend, the triangles are plotted in silver.
When used in conjunction with the Power Analyzer indicator, a signal to the long side should be taken when the Power Analyzer momentum indicator is at a cycle low. Similarly, a signal to the short side should be taken when the indicator is at a cycle high.
The first, second or third signal in a new trend have the highest probability of a follow through.
The indicator sometimes gives a false signal at the very end of the trend, just before the market reverses. This is an attempt by the Market Makers to persuade traders that the trend will continue.
Please leave a comment and "Like" this indicator if you find it useful.
FX Engineering

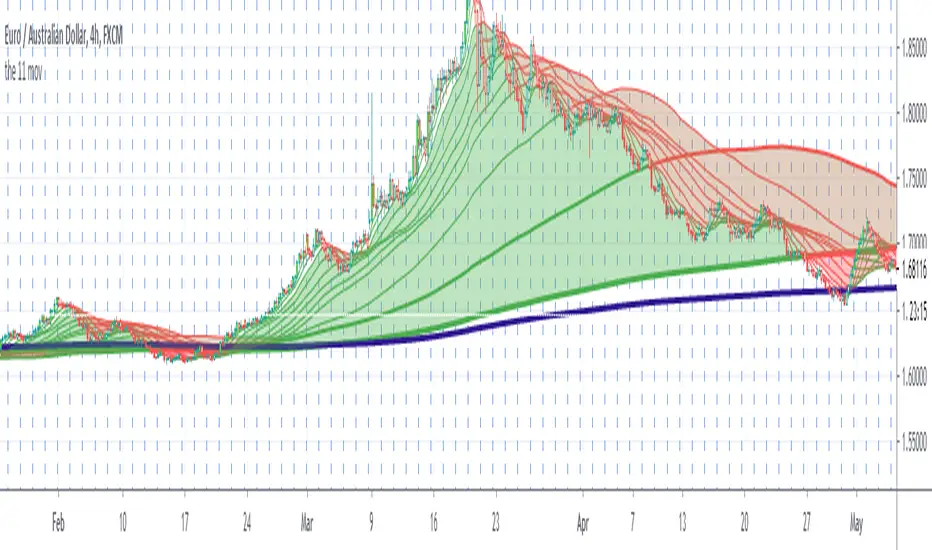
The 11 moving averages with bar color It is made by 11 moving averages and an indicator that color the candles when there is a strong trend.
The moving averages change color becoming green or red if there is a bullish trend in green or a bearish trend in red.
There are few ways to use this indicator.These two is what I found easier, please back test it and share your thoughts.
1. When the cloud is red and the candle is outside the cloud and the candle become red it s a sell entry.
When the cloud is green and the candle is outside the cloud and become green it s a buy entry.
2.The moving averages can be used as dynamic support and resistance.In a red cloud if a candle stop exactly where there is a moving averages and the next candle is a bearish engulfing candle it s a sell entry.
In a green cloud if a candle stop exactly where there is a moving averages and the next candle is a bullish engulfing candle it s a buy entry.
The exit is when the bar is not colored anymore or if the bar close below/above the second moving average from the top/from the bottom
Please look as well the blue moving averages that could work as dynamic support/resistance
VERY IMPORTANT WHEN YOU TRY A NEW STRATEGY TEST IT IN A DEMO ACCOUNT FOR AT LEAST 3 MONTHS
Every donations will be devolved to cancer research and you ll have one month free trial.
If you want to purchase this indicator 30% will be devolved to cancer research.
Please leave a comment or message me if you want you have two weeks trial.
Enjoy!
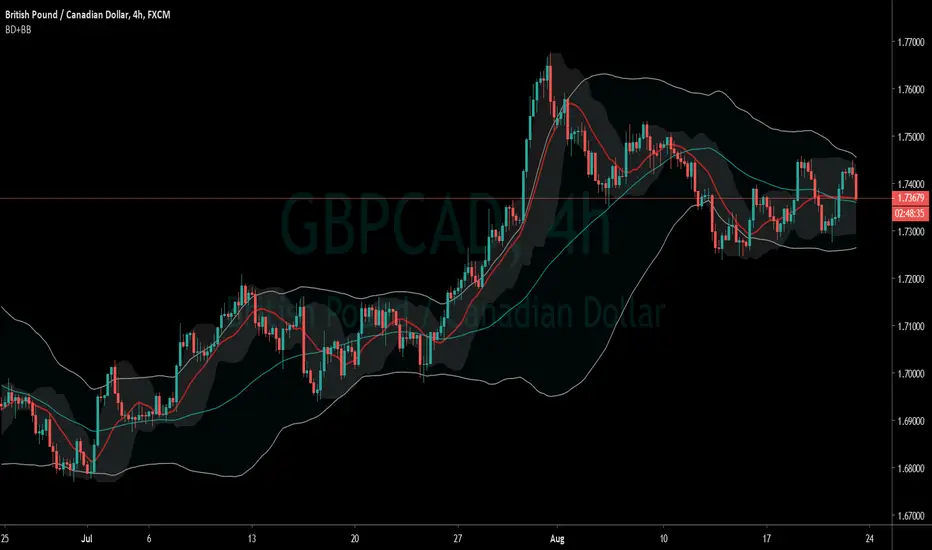
Bollinger/Donchian + BollingerA mixture of A Bollinger and fork from Ricardo Santos Donchian/Bollinger(DBH). Looks Nicer on a higher time frame, 4hr+. Default of DBH is 20, but 13/15 looks clearer to me.
MTF SMA on specific timeframe(5M-4H)Japanese below. 日本語の説明は下記
This is multi time frame simple moving average that is shown only on the specific timeframe; 5M, 15M, 30M, 1H, 4H.
Problem of conventional MTF moving average is that MTF MA is sometimes annoying especially when you look at upper timeframe such as daily chart and/or weekly chart.
e.g. You set 20 MA of 4 hour chart into 1 hour chart, however, when you look at daily chart, daily chart also shows 20MA of 4 hour chart which is unnecessary.
This is why I have developed this MTF SMA indicator shown only on the timeframe from 5M to 4 hour.
With this indicator, even if you set MA of upper timeframe(such as 4 hour) into Lower timeframe, that MA will not be shown on above daily chart.
You can customize adding or removing below code;
timeframe.period == “X”? security(syminfo.tickerid, res, sma(src, ma_len))
X is the timeframe that you would add/remove from the indicator.
——————————————————————————————
特定の時間軸にのみ表示されるマルチタイムフレーム移動平均線のインジケーターです。
従来のマルチタイムフレーム移動平均線の問題点は、上位足に切り替えた時にもマルチタイムフレーム移動平均線の設定が表示され、チャートが見にくくなる点でした。
例: 4時間足の20MAをマルチタイムフレーム移動平均線としてセットしたとします。この場合、1時間足などの下位足で4時間足の20MAが表示されることになりますが、同時に日足や週足といった上位足チャートを見る時にも、この4時間足の20MAが表示されてしまいます。
このインジケーターでは、従来のマルチタイムフレーム移動平均線と同様に、設定元となる上位足の時間軸(4時間、日足など)を選択し、期間とソースを設定することができる一方で、表示されるのは5分足、15分足、30分足,1時間足、4時間足のみとなります。
スクリプトのMAの取得部分に以下コードを追加することで、必要な時間軸を追加・削除することが可能です。
timeframe.period == “X”? security(syminfo.tickerid, res, sma(src, ma_len))
Xは表示したい時間軸です。4時間足チャートからこのインジケーターを削除したい場合は
timeframe.period == “240”? security(syminfo.tickerid, res, sma(src, ma_len))
を削除してください。

2-Year MA MultiplierThis script improves on the basic moving average multiplier script by adding inputs for the multiplier and moving average type.


Web SlingerIf the candles are above the ichimoku clouds and webstrings, search for BUYS. If the candles are below the ichimoku clouds and webstrings, search for SELLS.
For greater effectiveness operate with the trend (also applying price action and looking for bounce points)
SMA: 9
EMA:5
EMA:9
EMA:10
EMA:15
EMA:20
EMA:25
EMA:30
EMA:35
EMA:40
EMA:45
EMA:50
EMA:55
EMA:60
EMA:65
EMA:70
EMA:75
EMA:80
EMA:85
EMA:90

Multi EMA+SMAMulti EMA+SMA with default value of 20/50/200 ... User can change value and color as required... As ema and sma both has same value thats why only three lines are visible, changing value will reflect other Moving averages. Hope it will help my trader friends.
Love
Indyan...

Trend Cloud
The clouds reflect a possible overextension of the trend. Traders could use it as a signal to scale out the positions in the direction of the present trend or avoid scaling in.
The indicator plots the difference between ADX over the 45 level proportionate to the range between an ATR multiplier around MA. By default, the ADX is calculated with a DI length of 14 and an ADX smoothing of 14, an ATR length of 14, MA length of 20 and a multiplier of 2.
On the chart, I have highlighted with the vertical line the candles when the indicator was activated on all four timeframes simultaneously.
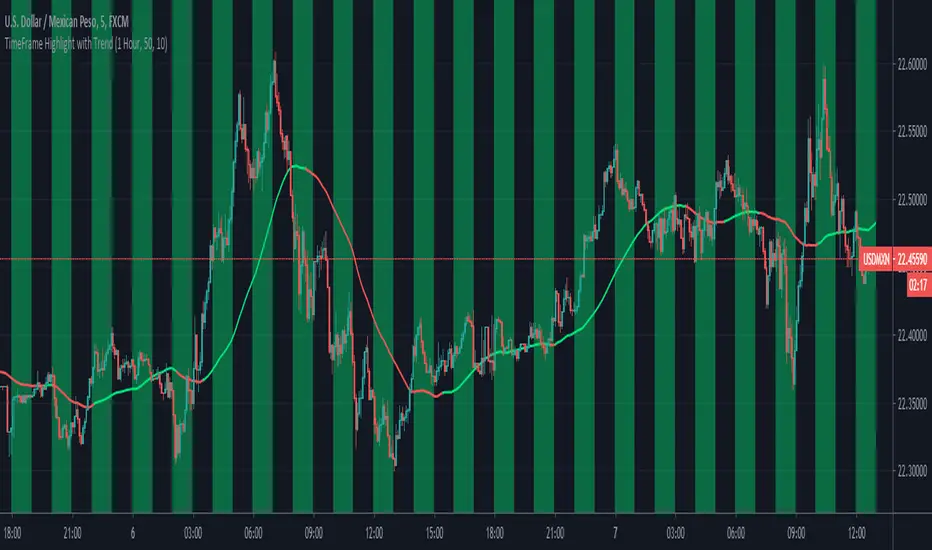
TimeFrame Highlight with TrendThis is a simple study that highlights these input intervals: "5 Min", "20 Min", "1 Hour", "2 Hour", "4 Hour", "8 Hour", "12 Hour", "16 Hour", "20 Hour", "24 Hour"
It also gives you trend by highlighting green for up and red for down and grey for no trend.
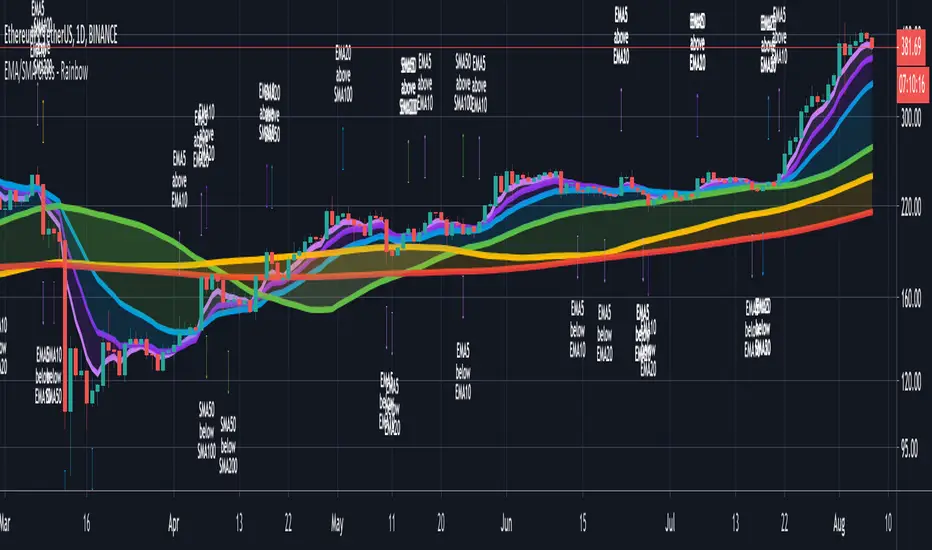
CryptoSignalScanner - Advanced Moving Averages - Cross & RainbowDESCRIPTION:
With this script you can plot 6 moving averages.
You can decide which Moving Average you want to show or hide.
For every plot you can decide to display the Simple Moving Average ( SMA ) or Exponential Moving Average ( EMA ).
It provides CrossOver and CrossUnder labels when loading the script. Those labels you can show or hide.
You have the possibility to show or hide the rainbow colors. This rainbow function gives you a clear view of the current trend.
HOW TO USE:
• When one Moving Average crosses above another Moving Average it signals an uptrend.
• When one Moving Average crosses below another Moving Average it signals a downtrend.
• The higher to length of the Moving Average the stronger the trend.
FEATURES:
• You can show/hide the preferred Moving Averages.
• You can set the length, type and source for every Moving Average.
• You can show/hide the rainbow colors.
• You can show/hide the CrossUp labels.
• You can show/hide the CrossDown labels.
• You can set alerts for every Moving Average.
• Etc...
DEFAULT SETTINGS:
• MA1 => EMA5
• MA2 => EMA10
• MA3 => EMA20
• MA4 => SMA50
• MA5 => SMA100
• MA6 => SMA200
Simple Moving Average vs. Exponential Moving Average:
SMA and EMA are calculated differently. The exponential moving average ( EMA ) focuses more on recent prices than on a long series of data points, as the simple moving average required.
The calculation makes the EMA quicker to react to price changes and the SMA react slower. That is the main difference between the two.
One is not necessarily better than another. It comes down to personal preference. Plot an EMA and SMA of the same length on a chart and see which one helps you make better trading decisions.
Moving Average Trading Strategies:
The first strategy is a price crossover, when the price crosses above or below a moving average, it signals a potential change in trend.
The second strategy applies when one moving averages crosses another moving average.
• When the short-term MA crosses above the long-term MA, it signals a buy signal.
• When the short-term MA crosses below the long-term MA, it signals a sell signal.
REMARKS:
• This advice is NOT financial advice.
• We do not provide personal investment advice and we are not a qualified licensed investment advisor.
• All information found here, including any ideas, opinions, views, predictions, forecasts, commentaries, suggestions, or stock picks, expressed or implied herein, are for informational, entertainment or educational purposes only and should not be construed as personal investment advice.
• We will not and cannot be held liable for any actions you take as a result of anything you read here.
• We only provide this information to help you make a better decision.
• While the information provided is believed to be accurate, it may include errors or inaccuracies.
If you like this script please donate some coins to share your appreciation.
Good Luck,
SEOCO
Weekly & Daily SMA 50/100/200The daily and weekly simple moving averages (SMA) are displayed in all timeframes.
The SMAs can be used for support and resistance. The lines of the past 50, 100 and 200 days and weeks are considered strong supports and resistances.
The daily lines are yellow and the weekly lines are green. The thicker and more visible a line is, the more important it is in the chart.

Hannibal's Quadruple SMA IndicatorFour SMAs, one indicator. Great for the moving average enthusiast. Planning on adding alerts, trade signals, etc.

SMA 9/50/180 | EMA 20 | BUY/SELLAllows for 3 SMAs and One EMA, Combined with Buy/Sell Indicator
Defaults to following settings:
9 SMA - Red
50 SMA - Blue
180 SMA - White
20 EMA - Yellow
Input Values and Colors can be modified
Recommend changes to the Style default
-uncheck SMA2
-uncheck Buy/Sell Chart Line

All EMA & MA in onDas Script zeigt EMA sowie MA 21, 50 ,100, 200
Es sind alle Farben einstellbar sowie die bereiche zwischen EMA und MA als Zone einfärbbar.