Order Flow: Structural Sniper [Profile + Signals]Overview
This script is a comprehensive tool designed to bridge the gap between Market Structure and Order Flow analysis. It aims to eliminate the subjectivity of static support and resistance lines by focusing on dynamic liquidity and the behavior of aggressive versus passive market participants.
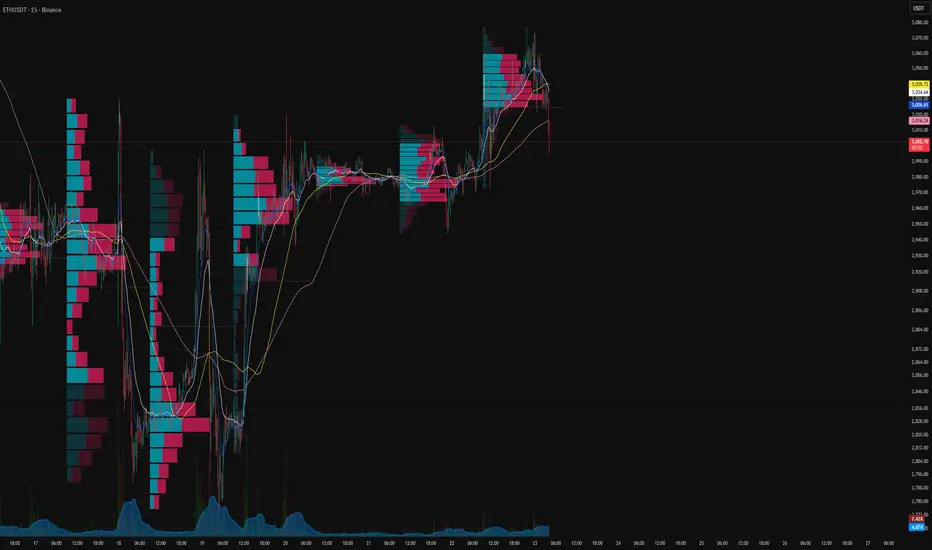
Unlike traditional indicators that plot static data, the Structural Delta Map dynamically anchors its analysis to the start of the current trend (Pivots), providing a clear "X-Ray" view of how volume was distributed during the current price swing.
How it Works
The indicator combines three distinct technical concepts into a single system:
1. Market Structure (Pivots):
It uses a pivot detection algorithm to identify significant Swing Highs and Swing Lows. This determines the market bias and anchors the analysis to the origin of the movement.
2. Anchored VWAP (Fair Price):
It automatically calculates the Volume Weighted Average Price (VWAP) starting from the last confirmed pivot. This yellow line acts as the "spine" of the trend, serving as dynamic institutional support/resistance.
3. Delta Profile & Heatmap:
A Volume Profile is plotted on the left side, anchored to the pivot.
Split Delta: Instead of a single color, bars are split into Green (Buying Volume) and Red (Selling Volume) based on price action estimation.
Heatmap Logic: The opacity of the bars adjusts automatically. Bright/Solid bars represent High Volume Nodes (HVN), while transparent bars represent Low Volume Nodes (LVN) or liquidity voids.
How to Use (Strategy)
The indicator provides both visual context and specific entry signals:
1. Visual Context:
Profile: Look for reactions at bright, wide bars (High Volume Nodes). These act as magnets or barriers.
Yellow Line (VWAP): In an uptrend, look for buy opportunities when price retraces to this line. In a downtrend, look for shorts on the retest.
2. Aggression Signals (Triangle "AGR"):
Type: Trend Continuation / Pullback.
Logic: Triggers when price retraces to the structural value zone (near VWAP), rejects it with higher-than-average volume, and closes in the direction of the trend.
3. Absorption Signals (Cross "ABS"):
Type: Reversal / Trap.
Logic:
Bullish Absorption: Price makes a new local low with high volume (selling pressure), but the candle closes bullish (leaving a long bottom wick). Passive buyers absorbed the aggression.
Bearish Absorption: Price makes a new local high with high volume, but closes bearish. Passive sellers absorbed the buying pressure.
Settings
Pivot Sensitivity: Adjusts how the script detects trend changes.
Profile Resolution: Controls the number of rows in the histogram.
Signal Filters: Enable/Disable signals and adjust the Volume Multiplier threshold.
Technical Disclaimer
This indicator estimates "Delta" (Buy vs. Sell volume) based on OHLC price action and bar volume, as Pine Script does not grant access to historical tick-by-tick data. While this approximation is highly effective for identifying aggression and absorption, it differs slightly from Level 2 footprint data found on platforms like Sierra Chart. Accuracy depends on the volume data provided by your exchange.
Volume

[ASFX] Free Automatic VWAPsAutomatic VWAP & Key Levels
Overview
This indicator is designed to help traders evaluate VWAP interactions in context, rather than treating every VWAP touch as a trade opportunity. It combines VWAP with a momentum-based directional filter to highlight situations where price interaction with VWAP is supported by broader intraday momentum. This indicator also shows you the initial balance and opening range each day.
Concept and Originality
VWAP is commonly used as an institutional reference level, but VWAP alone does not distinguish between meaningful acceptance/rejection and random intraday chop. This script addresses that limitation by conditioning VWAP interactions with a momentum filter. Signals are only displayed when price location and momentum alignment occur together, allowing traders to focus on higher-quality VWAP reactions instead of monitoring multiple indicators separately.
How It Works
• VWAP is used as the primary price reference level.
• A momentum filter evaluates directional bias and participation.
• Visual signals appear only when price is interacting with VWAP and momentum confirms acceptance or rejection in the same direction.
• No signals are shown during low-momentum or sideways conditions around VWAP.
How to Use
This indicator is best used as a confirmation tool, not as a standalone trading system. It is intended to assist traders in filtering VWAP-based trade ideas by highlighting when conditions are aligned versus when price is simply chopping around VWAP.
Markets and Timeframes
• Designed for index futures such as ES and NQ
• Optimized for intraday trading
• Works best on lower timeframes (1–5 minute charts)
Limitations
• Not predictive
• Not a complete trading strategy
• Does not replace price action analysis, trade management, or risk control
• Signals should be evaluated alongside market structure and context

cd_VW_CxOverview
The cd_VW_Cx is a sophisticated trend analysis tool designed to quantify market momentum using Multi-Period VWAP (Volume Weighted Average Price). Unlike standard indicators, this script evaluates the current price relationship across multiple historical VWAP anchors to generate a real-time "Confidence Score" ranging from -100 to +100.
💡 Key Features
• Dynamic Anchoring: Seamlessly switch between Daily, Weekly, or Monthly open anchors to align with your trading style (Scalping, Day Trading, or Swing).
• Algorithmic Scoring (The Score Box): The indicator compares the current VWAP against historical periods.
o Score > +70: Strong Bullish Momentum.
o Score < -70: Strong Bearish Momentum.
• Polyline Rendering: Utilizes Pine Script v6’s advanced polyline architecture for high-performance, sleek visual plotting that doesn't clutter your chart.
• Institutional Support/Resistance: Historical VWAP levels are color-coded, often acting as "invisible" magnetic zones where institutional orders are clustered.
🛠 How to Trade with cd_VW_Cx
1. Momentum Confirmation: Look for the Score Box to turn Teal (Bullish) or Red (Bearish). This indicates that the current trend has statistical backing from multiple previous sessions.
2. The Breakout Signal: The script tracks price crossovers of the current VWAP. A "Bullish Breakout" combined with a high score is a high-probability entry signal.
3. Visual Guidance: Use the custom labels to identify which specific day/week/month’s VWAP is currently being tested as support or resistance.
⚙️ Customizable Settings
• Anchor Selection: Choose the calculation basis (Daily, Weekly, Monthly).
• Thresholds: Adjust the sensitivity of the Bullish/Bearish alerts (Default is +/- 70).
• Visuals: Full control over table positioning, font sizes, and color palettes to match your chart theme.
📢 cd_VW_Cx: Multi-Period VWAP Scoring & Analysis Guide
🔍 Overview & Visual Logic
The labels next to the VWAP levels dynamically change based on your Anchor selection:
• Daily Open: Displays the Day Name (e.g., Monday, Tuesday).
• Weekly Open: Displays the Week Number (1 – 52).
• Monthly Open: Displays the Month Number (1 – 12).
•
General View:
________________________________________
🚦 How to Filter & Track Your Assets
You can monitor your favorite assets using two powerful methods:
1. Real-Time Alerts
Stay updated with TradingView notifications:
• Per Asset: Track a single pair.
• Watchlist Basis: Monitor your entire list at once. Alert Setup Guide:
2. Pine Screener Integration
Filter the market effortlessly using the Pine Screener. Pine Screener View:
________________________________________
⚙️ Settings & Configuration
• Timeframe Selection: Your chart timeframe must be lower than the selected Anchor timeframe. (e.g., If "Daily Open" is selected, the timeframe should be lower than 1D).
• Anchor Choice: Select Daily, Weekly, or Monthly opens.
• Source Selection: Default value is set to ohlc4. Source Settings:
Filtering Criteria Examples:
• Bullish Filtering: Find assets with high momentum scores.
• Bullish Breakout (Single Criteria): Filters assets that have closed above the current VWAP level.
• Combined Strength (Score + Breakout): Filters assets that have a Score > 70 AND a fresh VWAP Breakout simultaneously.
________________________________________
⚠️ Important Notes & Warnings
• Calculation Logic: The indicator calculates levels and scores on timeframes lower than the anchor. It is best used on timeframes that are close to but lower than the anchor.
• Avoid Extreme Gaps: Using a very low timeframe (e.g., 1m) with a very high anchor (e.g., Monthly) increases the risk of erroneous results.
• Optimization: The default score threshold of 70 is a starting point; I recommend adjusting it based on your own trading experience.
• The Power of Confluence: VWAP levels are naturally strong. Their significance increases when they coincide with institutional levels like PDH (Previous Day High), Session H/L, or HTF FVG.
• Experience Matters: A high score alone is not enough for an entry. Always combine this data with your personal strategy.
________________________________________
💬 Community & Feedback
I would love to hear your suggestions regarding the scoring logic or visual improvements! Feel free to share your thoughts in the comments.
Happy Trading! 🚀

Buy / Sell Volume Header [NPR21]Description
Buy / Sell Volume Header displays real-time Buy vs Sell volume dominance in a clean, fixed header that stays anchored to the chart.
Instead of plotting labels on candles or cluttering the chart, this indicator presents volume information in a compact, side-by-side header , making it easy to see who is in control of the current bar —buyers or sellers—at a glance.
The design is intentionally Thinkorswim-style : bold, readable, and optimized for fast decision-making during live markets.
How It Works:
Buy and Sell volume are estimated using candle structure:
Buy Volume is calculated from the portion of the candle that closes above the low
Sell Volume is calculated from the portion of the candle that closes below the high
Percentages show relative dominance for the most recently confirmed bar
The header updates only on confirmed bars, ensuring the display is non-repainting.
How to Use
This indicator is best used as a confirmation tool, not a standalone signal.
Common use cases:
Confirming buyer vs seller control
Adding volume bias to:
Breakouts and pullbacks
VWAP / EMA / trend strategies
Market structure and BOS setups
Quickly gauging pressure during:
Ranges
High-volume rejection zones
Trend continuation vs exhaustion
When Buy volume dominates, it suggests buyers are in control of the current bar.
When Sell volume dominates, it suggests selling pressure is stronger.
Always use in context with price action and structure.
Features
Fixed header (no chart clutter)
Side-by-side Buy | Sell layout
Bold, high-contrast colors
White text for maximum readability
Comma-formatted volume values
Non-repainting (confirmed bars only)
Customizable header location
Notes
This is an estimated volume model, not true bid/ask or footprint data
Results may vary depending on instrument and timeframe
Designed for intraday and futures trading, but works on any market with volume

TRADING NAVIGATOR📘 TRADING NAVIGATOR OPERATIONS MANUAL
This manual is designed to turn the script into your complete trading plan.
1. The Golden Rule: Planetary Alignment
Success with this script is not about trading every signal, but waiting for the confluence. Golden Trick: Do not trade on low timeframes (15M) if the trend on the higher timeframe (4H or D) is contrary. The Master Signal: Enter when the RELIABILITY column marks "HIGH" on at least 3 consecutive timeframes.
2. How to open a LONG (Buy) position: Look for these exact conditions on the board: TREND: It should say "BULLISH" (Price above the 200 EMA). ACTION: It should be marked LONG. ENTRY: The price should be near or touching the value indicated in the SUPPORT column. RSI: Ideally between 35 and 45 (healthy pullback) or crossing above 30. Execution: Place your limit order at the ENTRY price on the chart. The TP and SL are your mandatory exit coordinates.
3. How to open a SHORT (Sell) position: Look for these exact conditions on the board: TREND: It should say "BEARISH" (Price below the 200 EMA). ACTION: It should be marked SHORT. ENTRY: The price should be near or touching the value indicated in the RESIST column. (Resistance). RSI: Ideally between 55 and 65 or crossing below 70. Execution: Limit order at the ENTRY price on the chart. Don't chase the price; let it rise to the resistance to enter.
4. Golden Tricks to Gain Consistency: The Volatility Filter: If the VOLAT column shows "HIGH," reduce your position size by half. High volatility means sharp movements that can hit your SL before reaching the TP. The Timeframe Jump: If you see a LONG position on the 15M chart but the trend on the D (Daily) chart is BEARISH, that trade is high risk (pure Scalping). If both are BULLISH, you have a "High Probability Trade." RSI as a sentinel: If the RSI is at 50, the market is indecisive. Wait for it to approach the extremes (30 or 70) so that the Navigator's ACTION has more rebound strength.
5. Recommended Markets:
The TRADING NAVIGATOR is a structure and volatility algorithm, so it works where there is liquidity: Market | Effectiveness | Why |
Cryptocurrencies | ⭐⭐⭐⭐⭐ ATR volatility is best exploited in BTC and ETH. |
Indices (Nasdaq/SP500) | ⭐⭐⭐⭐ Ideal for following the TREND column (EMA 200). |
Forex (Majors) | ⭐⭐⭐ Use it on high-volume pairs (EURUSD, GBPUSD). |
Gold / Oil | ⭐⭐⭐⭐ Very sensitive to the support and resistance levels calculated by the script. |
6. Risk Management (Psychology) | Accepts Stop Loss: The script calculates the SL at 2.0x ATR to give the price "breathing room". If it is touched, the structure has been broken. Don't move the Stop Loss. Partial Taking: When the price has moved 50% of the way to the Take Profit, move your Stop Loss to the ENTRY (Breakeven) price. This ensures that the trade can no longer result in losses.

Participation-Weighted Orderflow Bubbles (HTF / LTF Context ToolThis indicator visualizes participation-weighted market pressure by aggregating lower-timeframe price and volume data into higher-timeframe context bubbles. It is designed to help identify directional dominance, balance, and absorption across timeframes. This is a context and bias tool, not a trade signal generator.
What the indicator shows
Each bubble represents a single chart bar, built from lower-timeframe candles.
Total Notional
Aggregated volume multiplied by price from lower-timeframe candles.
Buy / Sell Proxies
Lower-timeframe candles are classified based on where they close within their range:
– Close near the high → buy-side proxy
– Close near the low → sell-side proxy
– Middle of the range → neutral
Delta (USD and %)
Buy proxy notional minus sell proxy notional, expressed as both absolute USD delta and percentage of total notional.
Bubble colors
Green
Buy-side participation dominance.
Sell color (user configurable)
Sell-side participation dominance. The default is chosen for visibility on bearish candles and can be changed in settings.
Grey
Balanced participation. Indicates two-way trade, consolidation, or auction.
Yellow (Absorption)
High notional with limited price movement, suggesting potential absorption or distribution.
Coloring uses both relative dominance (delta percentage) and absolute dominance (minimum delta in USD), which improves behavior on higher timeframes.
Bubble size and visuals
Bubble size scales with total notional.
HD glow layers adapt automatically by timeframe.
Bubbles are drawn in front of candles for clarity.
Optional text displays delta and total notional.
Hovering over a bubble shows detailed information including total notional, buy/sell/neutral proxies, delta values, absorption status, and the number of lower-timeframe candles used.
Timeframe behavior
The indicator is designed to work across multiple timeframes. On higher timeframes, more grey bubbles are expected due to natural auction and balance behavior. Colored bubbles on higher timeframes represent sustained participation rather than short-term momentum. Visual density and performance are automatically adjusted on higher timeframes.
How to use it
Recommended workflow:
1. Higher timeframe (1H, 4H, Daily)
Use the bubbles to identify dominant buy or sell participation, balance zones, and absorption near highs or lows.
2. Lower timeframe (5m, 15m)
Take trades in alignment with the most recent higher-timeframe dominance. Be cautious or range-focused inside higher-timeframe balance zones. Use structure and price action for entries.
What this indicator is not
This indicator does not show true bid/ask data.
It does not display actual market versus limit orders.
It does not replace a DOM or exchange orderflow feed.
It should not be used as a standalone entry signal.
The indicator works within TradingView’s available data and provides a probabilistic, participation-weighted view of market pressure rather than true tape or orderflow data.
Best practices
Use a 1-minute lower timeframe for best results.
Avoid setting the lower timeframe too high relative to the chart timeframe.
Combine this tool with structure, levels, and session context.
Treat grey bubbles as information about balance, not as noise.
This tool is intended for traders who want better context and bias, not more signals.

TSF - Rel Vol & Stop calcSimple swing data table showing:
1. Avg 20D dollar vol
2. Live dollar vol
3. Live % relative vol compared to avg 20d daily vol
4.Percent to LOD current price with color codes
5. Avg 20d ATR%

Clock&Flow: Elements of Cycle Analysis 1st partClock&Flow – Elements of Cycle Analysis (ECA) | Complete Suite
Elements of Cycle Analysis (ECA) is an advanced cyclic analysis suite designed to interpret the market through time, structure, strength, and energy, combining cycles, volatility, and participation into a single operational framework.
The suite consists of two complementary modules:
🔹 ECA 1 – Cycles, Structure, and Volatility (Overlay: True)
ECA 1 is dedicated to the structural and temporal analysis of the market.
Cyclic SMAs (Cyclic Ratio) Moving averages are calibrated according to nominal cycles and timeframes to monitor multiple cycles simultaneously (from the lower cycle to the upper cycles). Crossovers between fast and slow SMAs certify the closing or transition of the cycle related to the faster SMA. The specific cycle is identified in the Info Table at the bottom right (for 15m - 1h - 2h - 1D timeframes). You can select the number of cycles to observe and the asset type to apply them to:
Index: Standard quotes (e.g., Cash sessions).
Future: Extended quotes (24h).
50-200: Classic institutional references for the medium-long term.
ATR-based Dynamic Cyclic Channels The channels represent a lower cycle and its upper counterpart; their width is determined by the observed timeframe and calculated based on average volatility (ATR). Volatility is not treated as noise but as a structural component of the cycle, essential for contextualizing excesses, compressions, and expansions.
Info Table and Quick Guide Dynamic tables automatically link SMAs, timeframes, and time cycles, providing an immediate reading of the current cyclic context.
Time Bands (Weekly / Daily) Temporal visualization helps identify cyclic pivots and rhythm transitions.
🔹 ECA 2 – Market Excesses, Strength, and Energy
ECA 2 analyzes how the market moves within the cyclic structure.
Excesses and Divergences (Cyclic Stochastic) An oscillator calibrated on the same cyclic ratio as the suite. Crossovers between the lower cycle (blue) and upper cycle (red) signal potential phase changes. In areas of excess, divergences often confirm the closing and restart of a cycle.
Directional Movement System (DMS) The ADX measures the strength of the movement, while +DI and -DI indicate direction. A simultaneous crossover of ADX, +DI, and -DI signals imminent acceleration, even before the strength is fully expressed.
Market Pulse – Real Market Energy The Market Pulse measures the amount of real energy moving through the market by relating three factors:
Price Velocity
Normalized Volume
Volatility (ATR relative to price)
These three factors are combined multiplicatively: if one is missing, the impulse weakens. The zero line represents a state of energy equilibrium; values above or below indicate a real imbalance (bullish or bearish). Note: Market Pulse is not a classic oscillator and should not be interpreted as overbought or oversold; it is used to evaluate the energetic quality of a movement.
Operational Convergence
The maximum operational effectiveness of the ECA suite is achieved when all modules converge on the same market phase.
When cyclic timing, volatility, price structure, trend strength, and movement energy align, the context signals a high-probability operational phase. The system is applicable to any timeframe or asset because it is not bound by dogmatic or subjective interpretations of technical or fundamental analysis; instead, it leverages what is actually happening in the market. Major chart patterns and Volume Profile (technically not includable in this specific suite) provide further confirmation.
Under these conditions, the signal does not originate from a single indicator but from the consistency of the entire system: time, volatility, and energy moving in the same direction.
Entries should always be accompanied by proper risk management.
––––––––––––––––––––––––––––––––––––––––––––––––––––––––––––––––––––––––
Clock&Flow – Elements of Cycle Analysis (ECA) | Suite Completa
Elements of Cycle Analysis (ECA) è una suite avanzata di analisi ciclica progettata per leggere il mercato attraverso tempo, struttura, forza ed energia, combinando cicli, volatilità e partecipazione in un unico framework operativo.
La suite è composta da due moduli complementari:
🔹 ECA 1 – Cicli, Struttura e Volatilità (overlay true)
ECA 1 è dedicato all’analisi strutturale e temporale del mercato.
SMA cicliche (ratio ciclica)
Le medie mobili sono calibrate in funzione dei cicli nominali e del timeframe per monitorare più cicli simultaneamente (dal ciclo inferiore fino ai cicli superiori).
Gli incroci tra SMA veloci e lente certificano la chiusura o transizione del ciclo correlato alla SMA più veloce. Il ciclo in questione è segnalato nella info table in basso a destra (per i time frame 15’ - 1h - 2h - 1D) Puoi selezionare il numero dei cicli da osservare e su quali asset applicarle (Index = quotazioni standard / Future = quotazioni estese / 50-200 i classici riferimenti istituzionali per il medio-lungo periodo
Canali ciclici dinamici basati su ATR
I canali rappresentano un ciclo inferiore e il suo superiore, l’ampiezza è data dal time frame osservato e calcolata sulla volatilità media (ATR).
La volatilità non è trattata come rumore, ma come componente strutturale del ciclo, utile per contestualizzare eccessi, compressioni ed espansioni.
Info Table e Quick Guide
Tabelle dinamiche collegano automaticamente SMA, timeframe e cicli temporali, fornendo una lettura immediata del contesto ciclico in corso.
Time Bands (Weekly / Daily)
La visualizzazione temporale aiuta a individuare pivot ciclici e transizioni di ritmo.
––––––––––––––––––––––––––––––––––––––––––––––––––––––––––––––––––––––
🔹 ECA 2 – Eccessi, Forza ed Energia del Mercato
ECA 2 analizza come il mercato si muove all’interno della struttura ciclica.
Eccessi e divergenze (Stochastic ciclico)
Oscillatore calibrato sulla stessa ratio ciclica della suite.
Gli incroci tra ciclo inferiore (blu) e superiore (rosso) segnalano potenziali cambi di fase; in area di eccesso, le divergenze certificano spesso la chiusura e ripartenza del ciclo.
Directional Movement System (DMS)
L’ADX misura la forza del movimento, mentre +DI e –DI ne indicano la direzione.
L’incrocio simultaneo di ADX, +DI e –DI segnala un’accelerazione imminente, anche in assenza di forza già espressa.
Market Pulse – Energia reale del mercato
Il Market Pulse misura quanta energia reale sta attraversando il mercato mettendo in relazione:
velocità del prezzo
volume normalizzato
volatilità (ATR rapportato al prezzo)
I tre fattori sono combinati in modo moltiplicativo: se uno manca, l’impulso si indebolisce.
La linea dello zero rappresenta una condizione di equilibrio energetico; valori sopra o sotto indicano uno sbilanciamento reale, rialzista o ribassista.
Il Market Pulse non è un oscillatore classico e non va interpretato in termini di ipercomprato o ipervenduto: serve a valutare la qualità energetica del movimento.
La massima efficacia operativa della suite ECA si ottiene quando tutti i moduli convergono sulla stessa fase di mercato.
Quando tempi ciclici, volatilità, struttura del prezzo, forza del trend ed energia del movimento risultano allineati, il contesto segnala una fase ad alta probabilità operativa.
È applicabile su qualunque time frame o asset perché non è vincolato a dogmatiche e soggettive interpretazioni di analisi tecnica - fondamentale ma sfrutta ciò che realmente sta accadendo sul mercato.
I principali pattern grafici e il Volume Profile (in questa suite tecnicamente non inseribili) forniscono ulteriori conferme e/o indicazioni.
In queste condizioni il segnale non nasce da un singolo indicatore, ma dalla coerenza dell’intero sistema: tempo, volatilità ed energia si muovono nella stessa direzione.
Gli ingressi vanno sempre accompagnati da una corretta gestione del rischio.

VWAP + RVOL (Merged):
📊 VWAP + RVOL (Merged)
VWAP + RVOL (Merged) is a professional intraday trading indicator that combines:
Session VWAP to define institutional direction and fair value
True Intraday Relative Volume (RVOL) to measure real-time volume strength compared to the same minute over previous days
The script is specifically designed for U.S. equities and performs best in:
Premarket momentum
Opening Range Breakout (ORB)
VWAP pullbacks
Scalping & day trading
🔍 What does this indicator provide?
1️⃣ True Intraday RVOL
Calculates minute-accurate relative volume, comparing current volume to the same minute across a user-defined number of prior days
Correctly handles sessions crossing midnight (after-hours & premarket)
Displays RVOL in a separate pane for clean, noise-free analysis
Default RVOL reference levels:
0.5 → Weak volume
1.0 → Normal volume
1.5 → Strong volume
2.0 → Unusual / institutional activity
2️⃣ Session VWAP
True session-based VWAP
Identifies institutional fair value
Acts as a primary directional filter:
Above VWAP → Bullish bias
Below VWAP → Bearish bias
✅ Practical Trading Use
Long Setup:
Price above VWAP
RVOL ≥ 1.5
Light pullback or VWAP retest
Confirmation candle with increasing volume
Avoid trades when:
Price below VWAP
RVOL < 1.0
⚙️ Settings
RVOL Lookback Days – Number of days used for RVOL comparison (default: 5)
RVOL Reference Lines – Toggle RVOL levels on/off
VWAP Source – Price source for VWAP calculation
Hide VWAP on 1D+ – Optional VWAP hiding on higher timeframes
📌 Important Notes
Designed for intraday timeframes only (≥ 1 minute and < 1 day)
Requires volume data from the data provider
Not intended for daily or higher timeframes
🎯 Who is this indicator for?
Momentum traders
Day traders & scalpers
ORB and VWAP pullback strategies
Traders seeking volume confirmation before entry
⚠️ Disclaimer
This indicator is a decision-support tool, not a trading recommendation.
Always apply proper risk management.

Clock&Flow: Elements of Cycle Analysis 2nd partClock&Flow – Elements of Cycle Analysis (ECA) | Complete Suite
Elements of Cycle Analysis (ECA) is an advanced cyclic analysis suite designed to interpret the market through time, structure, strength, and energy, combining cycles, volatility, and participation into a single operational framework.
The suite consists of two complementary modules:
🔹ECA 1 – Cycles, Structure, and Volatility (Overlay: True)
ECA 1 is dedicated to the structural and temporal analysis of the market.
Cyclic SMAs (Cyclic Ratio) Moving averages are calibrated according to nominal cycles and timeframes to monitor multiple cycles simultaneously (from the lower cycle to the upper cycles). Crossovers between fast and slow SMAs certify the closing or transition of the cycle related to the faster SMA. The specific cycle is identified in the Info Table at the bottom right (for 15m - 1h - 2h - 1D timeframes). You can select the number of cycles to observe and the asset type to apply them to:
Index: Standard quotes (e.g., Cash sessions).
Future: Extended quotes (24h).
50-200: Classic institutional references for the medium-long term.
ATR-based Dynamic Cyclic Channels The channels represent a lower cycle and its upper counterpart; their width is determined by the observed timeframe and calculated based on average volatility (ATR). Volatility is not treated as noise but as a structural component of the cycle, essential for contextualizing excesses, compressions, and expansions.
Info Table and Quick Guide Dynamic tables automatically link SMAs, timeframes, and time cycles, providing an immediate reading of the current cyclic context.
Time Bands (Weekly / Daily) Temporal visualization helps identify cyclic pivots and rhythm transitions.
🔹 ECA 2 – Market Excesses, Strength, and Energy
ECA 2 analyzes how the market moves within the cyclic structure.
Excesses and Divergences (Cyclic Stochastic) An oscillator calibrated on the same cyclic ratio as the suite. Crossovers between the lower cycle (blue) and upper cycle (red) signal potential phase changes. In areas of excess, divergences often confirm the closing and restart of a cycle.
Directional Movement System (DMS) The ADX measures the strength of the movement, while +DI and -DI indicate direction. A simultaneous crossover of ADX, +DI, and -DI signals imminent acceleration, even before the strength is fully expressed.
Market Pulse – Real Market Energy The Market Pulse measures the amount of real energy moving through the market by relating three factors:
Price Velocity
Normalized Volume
Volatility (ATR relative to price)
These three factors are combined multiplicatively: if one is missing, the impulse weakens. The zero line represents a state of energy equilibrium; values above or below indicate a real imbalance (bullish or bearish). Note: Market Pulse is not a classic oscillator and should not be interpreted as overbought or oversold; it is used to evaluate the energetic quality of a movement.
Operational Convergence
The maximum operational effectiveness of the ECA suite is achieved when all modules converge on the same market phase.
When cyclic timing, volatility, price structure, trend strength, and movement energy align, the context signals a high-probability operational phase. The system is applicable to any timeframe or asset because it is not bound by dogmatic or subjective interpretations of technical or fundamental analysis; instead, it leverages what is actually happening in the market. Major chart patterns and Volume Profile (technically not includable in this specific suite) provide further confirmation.
Under these conditions, the signal does not originate from a single indicator but from the consistency of the entire system: time, volatility, and energy moving in the same direction.
Entries should always be accompanied by proper risk management.
––––––––––––––––––––––––––––––––––––––––––––––––––––––––––––––––––––––––
Clock&Flow – Elements of Cycle Analysis (ECA) | Suite Completa
Elements of Cycle Analysis (ECA) è una suite avanzata di analisi ciclica progettata per leggere il mercato attraverso tempo, struttura, forza ed energia, combinando cicli, volatilità e partecipazione in un unico framework operativo.
La suite è composta da due moduli complementari:
🔹 ECA 1 – Cicli, Struttura e Volatilità (overlay true)
ECA 1 è dedicato all’analisi strutturale e temporale del mercato.
SMA cicliche (ratio ciclica)
Le medie mobili sono calibrate in funzione dei cicli nominali e del timeframe per monitorare più cicli simultaneamente (dal ciclo inferiore fino ai cicli superiori).
Gli incroci tra SMA veloci e lente certificano la chiusura o transizione del ciclo correlato alla SMA più veloce. Il ciclo in questione è segnalato nella info table in basso a destra (per i time frame 15’ - 1h - 2h - 1D) Puoi selezionare il numero dei cicli da osservare e su quali asset applicarle (Index = quotazioni standard / Future = quotazioni estese / 50-200 i classici riferimenti istituzionali per il medio-lungo periodo
Canali ciclici dinamici basati su ATR
I canali rappresentano un ciclo inferiore e il suo superiore, l’ampiezza è data dal time frame osservato e calcolata sulla volatilità media (ATR).
La volatilità non è trattata come rumore, ma come componente strutturale del ciclo, utile per contestualizzare eccessi, compressioni ed espansioni.
Info Table e Quick Guide
Tabelle dinamiche collegano automaticamente SMA, timeframe e cicli temporali, fornendo una lettura immediata del contesto ciclico in corso.
Time Bands (Weekly / Daily)
La visualizzazione temporale aiuta a individuare pivot ciclici e transizioni di ritmo.
––––––––––––––––––––––––––––––––––––––––––––––––––––––––––––––––––––––
🔹 ECA 2 – Eccessi, Forza ed Energia del Mercato
ECA 2 analizza come il mercato si muove all’interno della struttura ciclica.
Eccessi e divergenze (Stochastic ciclico)
Oscillatore calibrato sulla stessa ratio ciclica della suite.
Gli incroci tra ciclo inferiore (blu) e superiore (rosso) segnalano potenziali cambi di fase; in area di eccesso, le divergenze certificano spesso la chiusura e ripartenza del ciclo.
Directional Movement System (DMS)
L’ADX misura la forza del movimento, mentre +DI e –DI ne indicano la direzione.
L’incrocio simultaneo di ADX, +DI e –DI segnala un’accelerazione imminente, anche in assenza di forza già espressa.
Market Pulse – Energia reale del mercato
Il Market Pulse misura quanta energia reale sta attraversando il mercato mettendo in relazione:
velocità del prezzo
volume normalizzato
volatilità (ATR rapportato al prezzo)
I tre fattori sono combinati in modo moltiplicativo: se uno manca, l’impulso si indebolisce.
La linea dello zero rappresenta una condizione di equilibrio energetico; valori sopra o sotto indicano uno sbilanciamento reale, rialzista o ribassista.
Il Market Pulse non è un oscillatore classico e non va interpretato in termini di ipercomprato o ipervenduto: serve a valutare la qualità energetica del movimento.
La massima efficacia operativa della suite ECA si ottiene quando tutti i moduli convergono sulla stessa fase di mercato.
Quando tempi ciclici, volatilità, struttura del prezzo, forza del trend ed energia del movimento risultano allineati, il contesto segnala una fase ad alta probabilità operativa.
È applicabile su qualunque time frame o asset perché non è vincolato a dogmatiche e soggettive interpretazioni di analisi tecnica - fondamentale ma sfrutta ciò che realmente sta accadendo sul mercato.
I principali pattern grafici e il Volume Profile (in questa suite tecnicamente non inseribili) forniscono ulteriori conferme e/o indicazioni.
In queste condizioni il segnale non nasce da un singolo indicatore, ma dalla coerenza dell’intero sistema: tempo, volatilità ed energia si muovono nella stessa direzione.
Gli ingressi vanno sempre accompagnati da una corretta gestione del rischio.

Market Participation Gradient [Interakktive]Market Participation Gradient (MPG) is a diagnostic oscillator that measures the quality and intensity of market participation by combining price efficiency with activity (volume or a FX-safe proxy) into a single 0–100 score.
Most tools tell you "how much activity exists." MPG focuses on "how effective that activity is," helping you differentiate clean directional participation from absorbed / inefficient participation where effort produces limited directional progress.
█ WHAT IT DOES
- Produces a 0–100 participation score (higher = stronger participation environment)
- Uses color as state context (not buy/sell)
- Classifies participation into four tiers for quick readability
- Includes an optional status-line HUD for at-a-glance context without chart clutter
█ WHAT IT DOES NOT DO
- NO buy/sell signals
- NO entries/exits
- NO alerts by default
- NO repainting / no lookahead (diagnostic context only)
█ HOW TO READ MPG
Level (0–100)
- Higher values = stronger participation environment
- Lower values = thin, drifting participation environment
Color (state language, not direction)
- Teal = Clean participation (efficient movement)
- Magenta = Absorbed participation (high activity, low efficiency)
- Amber = Building / transition state
- Grey = Thin / neutral state
█ TIER SYSTEM
MPG uses four tiers:
- THIN (0–20): low participation environment
- BUILDING (20–40): participation emerging / transitional
- STRONG (40–65): solid participation environment (quality becomes more meaningful)
- EXTREME (65+): very high participation environment (contextually important during events or late-cycle pushes)
█ QUALITY ASSESSMENT (STRONG / EXTREME)
Within STRONG and EXTREME tiers, MPG evaluates participation quality:
- Clean (Teal): Efficiency > 55%
- Absorbed (Magenta): Efficiency < 30% AND Activity > 1.5×
- Neutral (Grey): otherwise (mixed quality)
█ STATUS LINE HUD
MPG can display key values in TradingView's status line:
- Minimal: MPG (0–100) + Tier (0–3)
- Full: adds Direction (-1/0/1) and Quality (-1/0/1)
This provides quick context without tables or on-chart panels.
█ HOW IT WORKS (METHODOLOGY)
MPG combines two independent measurements:
1. Efficiency (0–1)
Efficiency = |Net Displacement| / Total Path Length
- High efficiency = price moved more directly
- Low efficiency = price moved less directly (more back-and-forth)
2. Activity (centered at 1.0)
Activity = Current Volume / Average Volume
- Activity > 1 = above-average activity
- Activity < 1 = below-average activity
FX / indices fallback: If volume is unreliable/unavailable, MPG uses a range-based proxy: (High–Low) / ATR (capped) to prevent distortion.
3. Participation Score (0–100)
Participation = Efficiency × √Activity × 100
The square root applies diminishing returns so activity alone cannot dominate without efficiency support.
█ SETTINGS
Core
- ATR Length — normalization baseline
- Efficiency Lookback — bars used for efficiency
- Volume Average Length — baseline for activity
- Smoothing Length — EMA smoothing (1 = minimal smoothing)
Visuals
- Histogram / Line / Tier Bands toggles
- Optional pane background tint (default OFF)
- Theme: Cinematic (subtle) or Vivid (brighter)
HUD
- Status Line HUD toggle
- HUD Detail: Minimal or Full
█ SUITABLE MARKETS
Works on any market with price data. For symbols with unreliable volume (common in FX), MPG automatically uses the range/ATR activity proxy.
█ RELATED (INTERAKKTIVE)
- MER — Market Efficiency Ratio (pure efficiency)
- ERD — Effort–Result Divergence (effort vs outcome)
- VSI — Volatility State Index (expansion/contraction context)
█ DISCLAIMER
This indicator is for educational and informational purposes only and does not constitute financial advice. Always do your own research and use appropriate risk management.

Options Volume IndicatorShows the RSI volume based on options volume. Useful for comparing against asset buy and sell signals to see strength of demand for recent options.

Volume PressureVolume Pressure Indicator – Short Description
Volume Pressure is a momentum-based volume flow indicator that measures buying and selling pressure using a refined Volume Flow Index (VFI) model
Volume Pressure
The script analyzes:
Price movement relative to volatility
Filtered volume participation
Smoothed money flow and its direction
It then classifies market strength into High (HP), Medium (MP), and Low (LP) probability zones.
How to Read It
Flow Line (Gray): Net volume pressure (positive = bullish, negative = bearish)
Signal Line (Blue): Smoothed confirmation of flow
Green Dots: Bullish pressure
Red Dots: Bearish pressure
How to Use
Use Green or Red dots with signal line crossover to trade
Best used as a confirmation tool, not a standalone buy/sell signal
Works well across intraday and swing timeframes when combined with trend, structure, or breakout strategies.

Rolling Cumulative Volume Delta (N bars)Rolling CVD, not anchored to a date and reset after anchor+period reached


Supply-Demand Dominance & Energy RibbonOverview:
This indicator is specifically fine-tuned for the Nasdaq (NAS100) market. It combines volume-based Delta analysis (Supply-Demand) with price kinetic energy (Slope) to identify high-probability reversal points and trend strength.
Key Features & Usage:
Supply-Demand Dominance (Top-Right Label):
Analyzes volume spikes over a 50-period lookback to determine market control.
Displays "매수 우위" (Bullish Dominance) or "매도 우위" (Bearish Dominance) in real-time.
Energy Ribbon (Bottom Visualization):
Calculates the slope of the TCI oscillator to visualize momentum intensity.
Solid Green/Red: Strong momentum.
Faded Green/Red: Weakening momentum or minor trend.
Momentum Combo Signals (Circle Shapes):
Triggered when WaveTrend and TCI oscillators cross in extreme zones (Overbought 70 / Oversold 30).
Smart Filter: Signals are only shown when they align with the current Supply-Demand dominance, reducing "market noise."
Volume Spikes (Arrow Symbols):
Indicates abnormal volume activity (1.5x average delta). These arrows (↑/↓) help identify potential breakout points or the climax of a move even when a full combo signal isn't present.

Iridescent Liquidity Prism [JOAT]Iridescent Liquidity Prism | Peer Momentum HUD
A multi-layered order-flow indicator that combines microstructure analysis, smart-money footprint detection, and intermarket momentum signals. The script uses dynamic color-shifting themes to visualize liquidity patterns, structure, and peer momentum data directly on the chart.
There is so much to choose from inside the settings, if you think it's a mess on the chart it's because you have to personally customize it based on your needs...
Core Functionality
The indicator calculates and displays several analytical layers simultaneously:
Order-Flow Imbalance (OFI): Calculates buy vs. sell volume pressure using volume-weighted price distribution within each bar. Uses an EMA filter (default: 55 periods) to smooth the signal. Values are normalized using standard deviation to identify significant imbalances.
Smart Money Footprints: Detects accumulation and distribution zones by comparing volume rate of change (ROC) against price ROC. When volume ROC exceeds a threshold (default: 65%) and price ROC is positive, accumulation is detected. When volume ROC is high but price ROC is negative, distribution is detected.
Fractal Structure Mapping: Identifies pivot highs and lows using a fractal detection algorithm (default: 5-bar period). Maintains a rolling window of recent structure points (default: 4 levels) and draws connecting lines to show trend structure.
Fair Value Gap (FVG) Detection: Automatically detects price gaps where three consecutive candles create an imbalance. Bullish FVGs occur when the current low exceeds the high two bars ago. Bearish FVGs occur when the current high is below the low two bars ago. Gaps persist for a configurable duration (default: 320 bars) and fade when price fills the gap.
Liquidity Void Detection: Identifies candles where the high-low range exceeds an ATR threshold (default: 1.7x ATR) while volume is below average (default: 65% of 20-bar average). These conditions suggest areas where liquidity may be thin.
Price/Volume Divergence: Uses linear regression to detect when price trend direction disagrees with volume trend direction. A divergence alert appears when price is trending up while volume is trending down, or vice versa.
Peer Momentum Heatmap (PMH): Calculates composite momentum scores for up to 6 symbols across 4 timeframes. Each score combines RSI (default: 14 periods) and StochRSI (default: 14 periods, 3-bar smooth) to create a momentum composite between -1 and +1. The highest absolute momentum score across all combinations is displayed in the HUD.
Custom settings using Fractal Pivots, Skeleton Structure, Pulse Liquidity Voids, Bottom Colorful HeatMaps, and Iridescent Field.
---
Visual Components
Spectrum Aura Glow: ATR-weighted bands (default: 0.25x ATR) that expand and contract around price action, indicating volatility conditions. The thickness adapts to market volatility.
Chromatic Flow Trail: A blended line combining EMA and WMA of price (default: 8-period EMA blended with WMA at 65% ratio). The trail uses gradient colors that shift based on a phase oscillator, creating an iridescent effect.
Volume Heat Projection: Creates horizontal volume profile bands at price levels (default: 14 levels). Scans recent bars (default: 150 bars) to calculate volume concentration. Each level is colored based on its volume density relative to the maximum volume level.
Structure Skeleton: Dashed lines connecting fractal pivot points. Uses two layers: a primary line (2-3px width) and an optional glow overlay (4-5px width) for enhanced visibility.
Fractal Markers: Diamond shapes placed at pivot high and low points. Color-coded: primary color for highs, secondary color for lows.
Iridescent Color Themes: Five color themes available: Iridescent (default), Pearlescent, Prismatic, ColorShift, and Metallic. Colors shift dynamically using a phase oscillator that cycles through the color spectrum based on bar index and a speed multiplier (default: 0.35).
---
HUD Console Metrics
The right-side HUD displays seven key metrics:
Flow: Shows OFI status: ▲ FLOW BUY when normalized OFI exceeds imbalance threshold (default: 2.2), ▼ FLOW SELL when below -2.2, or ◆ FLOW BAL when balanced.
Struct: Structure trend bias: ▲ STRUCT BULL when microtrend > 2, ▼ STRUCT BEAR when < -2, or ◆ STRUCT RANGE when neutral.
Smart$: Institutional activity: ◈ ACCUM when smart money index = 1, ◈ DISTRIB when = -1, or ○ IDLE when inactive.
Liquid: Liquidity state: ⚡ VOID when a liquidity void is detected, or ● NORMAL otherwise.
Diverg: Divergence status: ⚠ ALERT when price/volume divergence detected, or ✓ CLEAR when aligned.
PMH: Peer Momentum Heatmap status: Shows dominant timeframe and momentum score. Displays 🪩 for bull surge (above 0.55 threshold) or 🧨 for bear surge (below -0.55).
FVG: Fair Value Gap status: Shows active gap count or CLEAR when no gaps exist. Displays GAP LONG when bullish gap detected, GAP SHORT when bearish gap detected.
Pearlscent Color with Volume Heatmap.
Parameters and Settings
Microstructure Engine:
Analysis Depth: 20-250 bars (default: 55) - Controls OFI smoothing period
Liquidity Threshold ATR: 1.0-4.0 (default: 1.7) - Multiplier for void detection
Imbalance Ratio: 1.5-6.0 (default: 2.2) - Standard deviations for OFI significance
Smart Money Layer:
Smart Money Window: 10-150 bars (default: 24) - Period for ROC calculations
Accumulation Threshold: 40-95% (default: 65%) - Volume ROC threshold
Structural Mapping:
Fractal Pivot Period: 3-15 bars (default: 5) - Period for pivot detection
Structure Memory: 2-8 levels (default: 4) - Number of structure points to track
Volume Heat Projection:
Heat Map Lookback: 60-400 bars (default: 150) - Bars to analyze for volume profile
Heat Map Levels: 5-30 levels (default: 14) - Number of price level bands
Heat Map Opacity: 40-100% (default: 92%) - Transparency of heat map boxes
Heat Map Width Limit: 6-80 bars (default: 26) - Maximum width of heat map boxes
Heat Map Visibility Threshold: 0.0-0.5 (default: 0.08) - Minimum density to display
Iridescent Enhancements:
Visual Theme: Iridescent, Pearlescent, Prismatic, ColorShift, or Metallic
Color Shift Speed: 0.05-1.00 (default: 0.35) - Speed of color phase oscillation
Aura Thickness (ATR): 0.05-1.0 (default: 0.25) - Multiplier for aura band width
Chromatic Trail Length: 2-50 bars (default: 8) - Period for trail calculation
Trail Blend Ratio: 0.1-0.95 (default: 0.65) - EMA/WMA blend percentage
FVG Persistence: 50-600 bars (default: 320) - Bars to keep FVG boxes active
Max Active FVG Boxes: 10-200 (default: 40) - Maximum boxes on chart
FVG Base Opacity: 20-95% (default: 80%) - Transparency of FVG boxes
Peer Momentum Heatmap:
Peer Symbols: Comma-separated list of up to 6 symbols (e.g., "BTCUSD,ETHUSD")
Peer Timeframes: Comma-separated list of up to 4 timeframes (default: "60,240,D")
PMH RSI Length: 5-50 periods (default: 14)
PMH StochRSI Length: 5-50 periods (default: 14)
PMH StochRSI Smooth: 1-10 periods (default: 3)
Super Momentum Threshold: 0.2-0.95 (default: 0.55) - Threshold for surge detection
Clarity & Readability:
Liquidity Void Opacity: 5-90% (default: 30%)
Smart Money Footprint Opacity: 5-90% (default: 35%)
HUD Background Opacity: 40-95% (default: 70%)
Iridescent Field:
Field Opacity: 20-100% (default: 86%) - Background color intensity
Field Smooth Length: 10-200 bars (default: 34) - Smoothing for background gradient
---
Alerts
The indicator provides seven alert conditions:
Liquidity Void Detected - Triggers when void conditions are met
Strong Order Flow - Triggers when normalized OFI exceeds imbalance ratio
Smart Money Activity - Triggers when accumulation or distribution detected
Price/Volume Divergence - Triggers when divergence conditions occur
Structure Shift - Triggers when structure polarity changes significantly
PMH Bull Surge - Triggers when PMH exceeds positive threshold (if enabled)
PMH Bear Surge - Triggers when PMH exceeds negative threshold (if enabled)
Bull/Bear Prismatic FVG - Triggers when new FVG is detected (if FVG display enabled)
---
Usage Considerations
Performance may vary on lower timeframes due to the volume heat map calculations scanning multiple bars. Consider reducing heat map lookback or levels if experiencing slowdowns.
The PMH feature requires data requests to other symbols/timeframes, which may impact performance. Limit the number of peer symbols and timeframes for optimal performance.
FVG boxes automatically expire after the persistence period to prevent chart clutter. The maximum box limit (default: 40) prevents excessive memory usage.
Color themes affect all visual elements. Choose a theme that provides good contrast with your chart background.
The indicator is designed for overlay display. All visual elements are positioned relative to price action.
Structure lines are drawn dynamically as new pivots form. On fast-moving markets, structure may update frequently.
Volume calculations assume typical volume data availability. Symbols without volume may show incomplete data for volume-dependent features.
---
Technical Notes
Built on Pine Script v6 with dynamic request capability for PMH functionality.
Uses exponential moving averages (EMA) and weighted moving averages (WMA) for trail calculations to balance responsiveness and smoothness.
Volume profile calculation uses price level buckets. Higher levels provide finer granularity but require more computation.
Iridescent color engine uses a phase oscillator with sine wave calculations for smooth color transitions.
Box management includes automatic cleanup of expired boxes to maintain performance.
All visual elements use color gradients and transparency for smooth blending with price action.
---
Customization Examples
Intraday Scalping Setup:
Analysis Depth: 30 bars
Heat Map Lookback: 100 bars
FVG Persistence: 150 bars
PMH Window: 15 bars
Fast color shift speed: 0.5+
Macro Structure Tracking:
Analysis Depth: 100+ bars
Heat Map Lookback: 300+ bars
FVG Persistence: 500+ bars
Structure Memory: 6-8 levels
Slower color shift speed: 0.2
---
Limitations
Volume heat map calculations may be computationally intensive on lower timeframes with high lookback values.
PMH requires valid symbol names and accessible timeframes. Invalid symbols or timeframes will return no data.
FVG detection requires at least 3 bars of history. Early bars may not show FVG boxes.
Structure lines connect points but do not predict future structure. They reflect historical pivot relationships.
Color themes are aesthetic choices and do not affect calculation logic.
The indicator does not provide trading signals. All visual elements are analytical tools that require interpretation in context of market conditions.
Open Source
This indicator is open source and available for modification and distribution. The code is published with Pine Script v6 compliance. Users are free to customize parameters, modify calculations, and adapt the visual elements to their trading needs.
For questions, suggestions, or anything please talk to me in private messages or comments below!
Would love to help!
- officialjackofalltrades

RVOL Text This script will give you the Relative volume at the time in a numbered text on your charts.

Market Exhaustion [WavesUnchained]Market Exhaustion
Multi-oscillator exhaustion detector combining MFI + optional CCI, HTF bias, StochRSI timing, and a divergence engine with an Exhaustion Score (0-100).
CORE CONCEPT
- Detects exhaustion via regular divergences anchored on price pivots
- Scores each divergence (0-100) using 5 components
- Line width = quality, color = direction (never thicker than main line)
OSCILLATOR MODES
- MFI : Engine uses MFI only
- CCI : Engine uses CCI mapped to 0-100
- MFI+CCI : Both plotted, engine source selectable (MFI or CCI)
EXHAUSTION SCORE (0-100)
1. Sequence (Div 1/2/3...) - repeated attempts increase score
2. Fatigue - no new oscillator extreme over lookback
3. Formation Time - bars between pivots
4. Reaction - post-divergence bounce/drop vs ATR
5. Impulse - MFI/CCI delta + swing size
DIVERGENCE ENGINE
- Price-pivot anchored (LL/HH) with osc confirmation (HL/LH)
- OS/OB gating with dynamic zones + fallback to 20/80
- Tolerant direction checks (price + osc eps)
- Auto cleanup (max objects)
HTF CONTEXT
- Auto-HTF MFI bias label
- Optional HTF filter for signals
- Bias bonus (optional) for Exhaustion Score
SIGNALS & TIMING
- StochRSI timing + MFI zone confirmation
- Context + timing signals (L/S markers)
- Zone confirm bars
VISUALIZATION
- Color-coded MFI line (OB/OS/neutral)
- Optional CCI (mapped 0-100) line
- Divergence line width = quality, endpoint markers
- Optional mid-label with score
- Dynamic zones + optional fill
BEST USE CASES
- Reversal scouting at extremes
- Filtering weak swings
- 15M-4H swing exhaustion reads
- HTF bias + divergence confluence
Version: 1.0.0
Author: WavesUnchained
Pine Script: v6

VOLD RatioThis indicator calculates the ratio between NYSE Up Volume and Down Volume (USI:UVOL / USI:DVOL).
It helps assess market participation and short-term buying vs. selling pressure.
Higher values indicate dominant buying volume, while lower values suggest increasing selling pressure.
Useful as a breadth and confirmation tool alongside index price action.

VORB DJB Trades V1VORB by DJB Trades (Version 1) is a complete intraday framework built around the New York session Opening Range Breakout (ORB), combined with higher-timeframe VWAPs and precise Fair Value Gap mapping.
This tool is designed to give you context, levels and confluence at a glance – no more stacking 5 different indicators on your chart.
🔶 Core ORB Logic (NY Session)
• Uses the 09:30–09:45 NY time 15-minute ORB range.
• Draws an ORB box from high to low during the ORB window.
• Projects clean high/low ORB lines across the session (up to your chosen end time, default 18:00 NY).
• Displays the ORB size in points above the box
• 1 point = 4 ticks (futures-style logic).
This gives an instant sense of how “wide” or “tight” the opening drive was, and how much room you have for trend or mean-reversion plays.
📐 Daily VWAP (Intraday Bias)
• Custom anchor time (default 18:00, NY session close style).
• Plots Daily VWAP plus +/-1 standard deviation bands.
• Full styling controls: colors, line widths, band fill etc.
• You can limit visibility to specific timeframes via dropdown (e.g. only show on 1–5m, or just intraday).
VWAP +/-1 deviation bands gives you intraday bias and “fair value” zones to frame trades around the ORB.
🕒 Higher Timeframe VWAPs (Weekly, Monthly, Yearly)
All three higher-TF VWAPs are calculated the same way (volume-weighted, streaming) but anchored at different structural points:
• Weekly VWAP – resets at the start of each week
• Monthly VWAP – resets at the start of each month
• Yearly VWAP – resets at the start of each year
Each has:
• Main VWAP line
• ±/-1 standard deviation bands
• Independent color / width / band fill settings
• Timeframe visibility controls (“show from TF” & “show up to TF”) so you can do things like:
⁃ Weekly VWAP only from 5m and above
⁃ Monthly on 1h and higher
⁃ Yearly only on Daily/Weekly/Monthly
Use these as higher-timeframe bias references and key dynamic value areas above/below the ORB.
📊 1m FVGs (Outside ORB & VWAP Bands)
For precision entries:
• Detects 1-minute Fair Value Gaps (classic 3-candle pattern):
⁃ Bullish FVG: low > high
⁃ Bearish FVG: high < low
• Only plots FVGs that are:
⁃ Outside the ORB range, and
⁃ Outside the Daily VWAP +/-1 bands
• FVG boxes are auto-extended to the right (4× original width) for clear “liquidity pockets”.
• Separate colors for bullish and bearish FVGs.
This helps you focus only on “clean” imbalances away from the opening chop and mid-range value.
⚙️ Customisation & Use
• Works best on US indices, FX and futures during the NY session.
• Optimised for 1m–15m ORB trading, but higher-TF VWAPs shine on 5m, 15m, 1h and Daily.
• Every visual element (ORB box, lines, VWAPs, bands, FVGs, label text/bg) is fully customisable in the settings.
⚠️ Disclaimer
This script is for educational and informational purposes only.
It does not constitute financial advice or a signal service.
Always test on a demo account and use your own risk management before trading live.

Scooby SpecialThis indicator detects bullish and bearish divergences between price and 5-period RSI using confirmed pivot points. Signals only trigger below RSI 40 for bullish setups and above RSI 60 for bearish setups.

Daily Volume ProfileThis indicator is identical to the Fixed Range Volume Profile,
except that it automatically fixes the range to a daily basis.