Algorithmic Volume Rejection Zones [AVRZ]Hello traders,
I am pleased to release the Algorithmic Volume Rejection Zones (AVRZ). This is a specialized decision-support system designed to identify high-probability reversal points by synthesizing candle geometry, market structure, and statistical volume anomalies.
Trading reversals often presents a dilemma: wait for confirmation and miss the move, or enter early and get stopped out by noise. AVRZ solves this by quantifying "Institutional Absorption." It filters out weak price probes and highlights only the specific moments where significant volume has stepped in to defend a price level.
🛡️ The Concept: Attacking The Zonesl
You will often see price aggressively "attack" a support or resistance level with speed and high volume. To the untrained eye, this looks like a breakout. However, professional analysis reveals that this is often an Efficiency Event—liquidity is being absorbed by passive limit orders.
The AVRZ indicator is specifically engineered to detect this phenomenon. When price strikes a level and volume spikes (>2.0 Sigma), it signals that the auction is becoming efficient and a reversal is imminent. The script captures this "Attack" via the Climax Bypass logic, plotting a fresh zone immediately to mark where the liquidity was defended.
Volume

Mass Sentiment & Contrarian (Only Signals)
________________________________________
📘 Contrarian Mass Sentiment Indicator Manual
This indicator is designed to identify moments of psychological exhaustion in the market. Its philosophy is "buy panic and sell euphoria."
1. Where and how is the data taken from?
The indicator analyzes three real-time data sources to filter the signals:
• Psychology (RSI): We use the Relative Strength Index (RSI) to measure the speed and change in price movements.
• If the RSI is very high (>70-75), the "mass" is overbuying (greed).
• If the RSI is very low (<25-30), the "mass" is overselling (panic).
• Price Action (Candlesticks): It is not enough for the RSI to be at an extreme. The indicator looks for reversal patterns (Hammer, Shooting Star, or Engulfing candlesticks). This confirms that the price has indeed found a top or bottom.
• Price Action (Candlesticks): It is not enough for the RSI to be at an extreme. The indicator looks for reversal patterns (Hammer, Shooting Star, or Engulfing candlesticks). This confirms that the price has actually found a top or bottom.
• Price Action (Candlesticks): • Market Effort (Volume): At "Strong" levels, the indicator requires volume to exceed its 20-period moving average. This identifies a volume climax, which typically marks the end of a move.
________________________________________
2. User Manual: Signal Interpretation
The indicator classifies opportunities according to their probability of success:
A. Intensity Levels
Label Strength Meaning Suggested Action
F-VTA / F-CPA Strong Maximum euphoria/panic + Volume + Reversal candle. High probability signal. Look for immediate entry.
M-VTA / M-CPA Medium Standard overload level + Reversal candle. Solid technical confirmation. Trade in favor of the structure.
D-VTA / D-CPA Weak The RSI is just beginning to reverse from moderate levels. Early warning. Do not enter without confirmation using other tools.
B. Trade Execution (Contrarian)
1. Location: Wait for a label to appear. The best are the Strong (F) or Medium (M) lines.
2. Stop Loss: Always place it a few pips/points above the high of the signal candle (for selling) or below the low (for buying).
3. Take Profit: * Target 1: The mid-RSI level (50).
or Target 2: The opposite RSI band (if you sold at 70, aim to close at 30).
________________________________________
3. Golden Tips
• Avoid sideways markets: In very narrow ranges, the RSI can give false signals ("wobbling"). Look for signals that occur after a clear and extended trend.
• Timeframes: The indicator is most reliable on 15-minute, 1-hour, and 4-hour timeframes. On the 1-minute timeframe, market "noise" can generate constant weak signals.
• Confluence: If you see an F-VTA (Strong Sell) signal right at a historical price resistance, the probability of success increases dramatically.

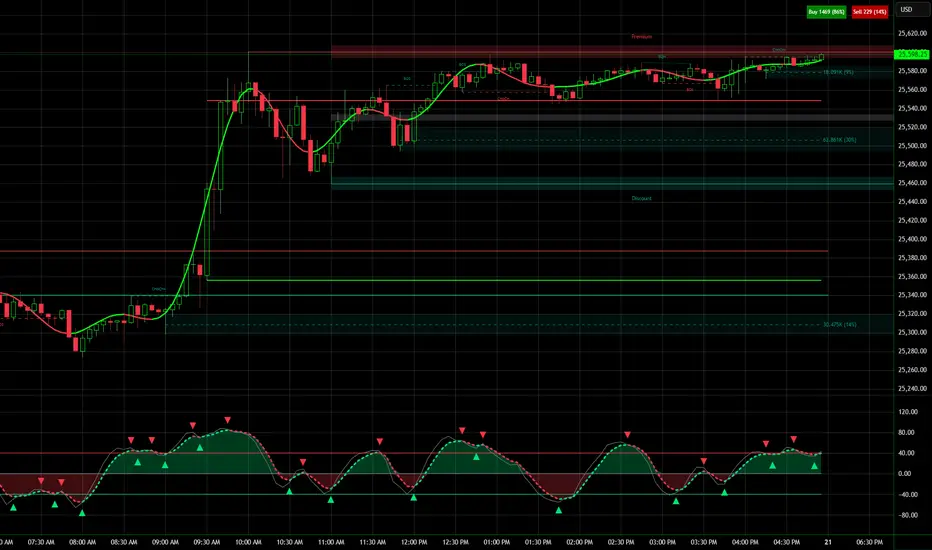
Buy / Sell Volume Header / NPR21📊 Buy / Sell Volume Header – NPR21
Overview
Buy / Sell Volume Header – NPR21 displays real-time Buy vs Sell volume dominance in a clean, Thinkorswim-style fixed header at the top of the chart.
Instead of cluttering candles with labels, this indicator presents volume information in a compact, side-by-side header, allowing traders to instantly gauge who is in control of the current bar—buyers or sellers—without losing focus on price action.
How It Works
Buy and Sell volume are estimated using candle structure:
Buy Volume is derived from the portion of the candle closing above the low
Sell Volume is derived from the portion of the candle closing below the high
Percentages show relative dominance for the most recently confirmed bar
This approach provides a fast, intuitive order-flow bias that works across futures, indices, crypto, and equities.
Key Features
✔ Thinkorswim-style fixed header
✔ Side-by-side Buy | Sell layout (no overlap)
✔ Bold green/red backgrounds with white text
✔ Compact font for intraday trading
✔ Updates only on confirmed bars (non-repainting)
✔ No candle clutter
✔ Optimized for scalping and intraday trading
Best Use Cases
Confirming buyer vs seller control
Adding confluence to:
Momentum indicators
VWAP / EMA strategies
Market structure & BOS setups
Quick decision support during:
Breakouts
Pullbacks
Range highs/lows
This tool is designed to be confirmation, not a standalone signal.
Notes
This is a volume estimation tool, not true bid/ask or footprint data
Best used alongside price action and structure
ITCP ATR BB RSI Stoch SignalsThis indicator generates BUY/SELL signals when price stretches outside Bollinger Bands during elevated volatility, confirmed by RSI, a Stochastic crossover, and a volume filter. To reduce counter-trend entries, it applies a macro trend filter using the Daily SMA 200: it looks for longs only above the SMA 200 and shorts only below it.
It tends to perform best in Forex, especially on liquid pairs, because market conditions (liquidity, continuous sessions, and relatively stable spreads on major pairs) often suit this confirmation-based approach. That said, it can be adapted to other markets (indices, commodities, or crypto) by tuning parameters such as Bollinger length/deviation, RSI/Stoch thresholds, and ATR settings (multipliers/factors) to fit the asset’s volatility.
It also plots ATR-based stop-loss reference levels (configurable smoothing) and includes webhook-ready alerts with a JSON payload (action, symbol, price, stop_loss, time, and interval) for external automation. The goal is to support rules-based execution and reduce impulsive trades: if conditions don’t align, there’s no signal.
If you manage to improve it, discover better settings, or build a more robust solution inspired by this, I’d really appreciate it if you share it back (even if it’s just feedback or an idea). I’m open to collaborating and iterating together to create stronger versions over time.

Order Flow Trade Detector [Dynamic Sizes]detects absorption in the market and gives an idea where buyers and sellers are.

SMH DualMomentum Signals (ROC + Volume)SMH Dual Momentum (ROC + Volume Confirmation)
This indicator identifies high-quality bullish trends by combining price momentum (Rate of Change) with volume confirmation, and exits when momentum structurally fails.
Core Logic
BUY signal
Rate of Change (ROC) over N periods is above a positive threshold (strong upside momentum)
Current volume is above its moving average (rising market participation)
SELL signal
ROC crosses below zero, indicating loss of bullish momentum
Why It Works
ROC measures the speed and strength of price movement, filtering out weak or drifting trends
Volume confirmation ensures momentum is supported by real capital flow, reducing false breakouts
Momentum-based exit avoids prolonged drawdowns and capital stagnation
Key Advantages
Focuses on trend continuation, not prediction
Filters out low-quality price moves and range-bound markets
Captures long, high-conviction trends with relatively few trades
Simple, robust rules using only price and volume
Best Use Cases
Designed for trend-driven ETFs such as SMH (Semiconductors)
Suitable for swing to position trading on daily charts
Works best in markets with strong sector rotation and institutional participation
Notes
This is a trend-following momentum tool, not a mean-reversion indicator
No stop-loss is built in; risk management should be handled externally if required
Parameters can be adjusted to match different timeframes or assets

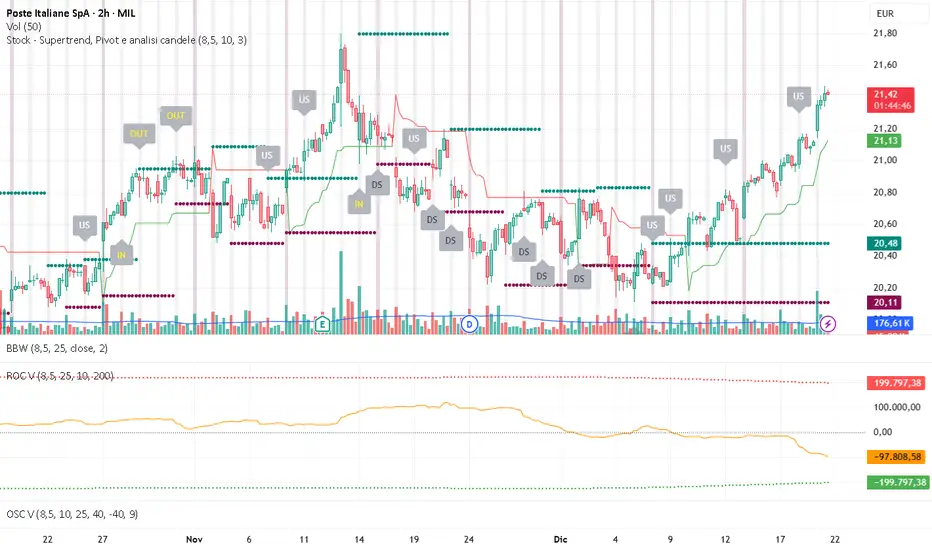
Volume OscillatorDescription
The Volume Oscillator measures the momentum of trading volume by calculating the percentage difference between a fast and a slow Simple Moving Average (SMA) of daily volume. It helps traders identify periods of increasing or decreasing market participation, often signaling potential trend strength or exhaustion.
Key Features:
Adaptive to Trading Session:
Automatically adjusts SMA periods based on the actual trading session length (default: 8.5 hours for FTSEMIB, customizable for any market — e.g., 6.5h for US stocks, 24h for crypto).
Fast & Slow SMAs:
Compares a short-term SMA (default 10 days) with a longer-term SMA (default 25 days) of volume.
Oscillator Formula:
100 × (Fast SMA / Slow SMA - 1)
→ Positive values = increasing volume momentum (bullish)
→ Negative values = decreasing volume momentum (bearish)
Signal Line (optional):
A moving average of the oscillator (default 7 days) for smoother trend identification and crossover signals.
Overbought/Oversold Levels:
User-defined horizontal lines (default +40 / -40) to highlight extreme volume conditions.
Customizable Colors:
Change the oscillator and signal line colors to match your chart style.
How to Interpret:
Bullish Conditions:
Oscillator crosses above the zero line
Oscillator crosses above the signal line
Readings near or above +40 may indicate strong buying pressure (watch for possible exhaustion if too extreme)
Bearish Conditions:
Oscillator crosses below the zero line
Oscillator crosses below the signal line
Readings near or below -40 may indicate selling pressure or capitulation
Divergences:
Look for divergences between price and the Volume Oscillator (e.g., price makes new highs but oscillator fails to confirm with higher highs) — a classic sign of weakening momentum.
Best Use Cases:
Indices (FTSEMIB, DAX, CAC, SPX, etc.), stocks and futures with defined trading hours, crypto (set session duration to 24 hours).
Works well on intraday (e.g., 15m, 30m, 1h) and daily charts.
Customization Tips:
- Shorten fast/slow lengths for faster signals (more noise)
- Lengthen them for smoother, longer-term analysis
- Adjust session duration for non-standard market hours
- Enable/disable the signal line in the settings
Note: Volume data quality can vary by symbol and exchange. Always combine this indicator with price action and other tools. Use proper risk management.

Volume ROC (smoothed)Description
The Volume ROC (Rate of Change) indicator is designed to measure the momentum of trading volume over a user-defined period, adjusted for the trading session length of the symbol (e.g., 8.5 hours for the FTSEMIB index). This makes it particularly useful for intraday charts where standard daily calculations might not align with actual trading days.
By focusing on volume changes rather than price, it helps identify potential shifts in market participation, such as accumulation, distribution, or unusual activity that could precede price movements.
How It Works:
Session Adjustment:
The indicator calculates the number of candles per trading day based on the input session duration (in hours) and the chart's timeframe. This ensures that the ROC and other calculations are based on "trading days" rather than calendar days, making it adaptable to markets with non-standard hours like European indices (e.g., FTSEMIB).
Daily Data Fetch:
It retrieves daily high, low, close, and volume data using "request.security" to ensure consistency across timeframes.
ROC Calculation:
The Rate of Change (ROC) is computed on volume using "ta.change" over the specified length (in days), multiplied by the candles-per-day factor for timeframe independence. By chosing the subtraction method instead of the division method we avoid distortions of the ROC below the zero line (method ok for timespans inferior to two years).
Smoothing with SMA:
A Simple Moving Average (SMA) is applied to the ROC to reduce noise and highlight trends in volume momentum.
Standard Deviation Bands:
The standard deviation of the smoothed ROC is calculated over a lookback period. Bands are plotted at +2σ (overbought) and -2σ (oversold) to provide context for extreme volume changes, similar to Bollinger Bands but applied to volume ROC.
Key Plots:
SMA Line (Orange): The smoothed ROC value. Positive values indicate increasing volume momentum; negative values suggest decreasing momentum.
Zero Line (Black Dotted): A reference line at 0, separating positive and negative ROC territories.
+2σ Band (Red Dotted): Upper overbought threshold. Crossings above this may signal excessive buying volume.
-2σ Band (Green Dotted): Lower oversold threshold. Dips below this could indicate capitulation or low interest.
Usage and Interpretation:
Trend Confirmation:
Use the SMA crossing above/below zero to confirm price trends with volume backing. For example, a rising price with positive Volume ROC suggests strong conviction.
Divergences:
Look for divergences between price and Volume ROC (e.g., price making new highs but ROC weakening), which can signal reversals.
Overbought/Oversold Signals:
The ±2σ bands act as dynamic levels. Volume ROC spiking above +2σ might precede pullbacks, while below -2σ could indicate buying opportunities.
Best Applied To:
European indices (like FTSEMIB or DAX), stocks, or futures with defined session hours. Test on intraday (e.g., 2h) and combine with price-based indicators like RSI or MACD for confluence.
Customization:
Adjust the ROC/SMA lengths for sensitivity (shorter for scalping, longer for swings). The STDEV lookback affects band width—longer periods create smoother bands.
Limitations:
Volume data can be noisy in low-liquidity symbols. This indicator assumes consistent session lengths; irregular holidays may affect accuracy. Always backtest and use with risk management.
This indicator is original and built for educational/trading purposes.
Candle Strength Analyzer by The Ultimate Bull Run# Candle Strength Analyzer
## 📊 Complete Beginner's Guide
---
### 🎯 What This Indicator Does
The **Candle Strength Analyzer** measures how "strong" or "weak" each candlestick is and displays a **score from 0 to 100** above or below every candle.
- **Green numbers** = Bullish (price went UP)
- **Red numbers** = Bearish (price went DOWN)
- **Gray numbers** = Doji (price barely moved)
**Higher score = Stronger candle = More reliable signal**
---
### 🕯️ Understanding Candlesticks (The Basics)
If you're new to trading, here's what a candlestick shows:
```
│ ← Upper Wick (prices that were rejected)
│
┌───┐
│ │ ← Body (the "real" price movement)
│ │ • Green/White body = Price went UP (Bullish)
│ │ • Red/Black body = Price went DOWN (Bearish)
└───┘
│
│ ← Lower Wick (prices that were rejected)
```
**Key Terms:**
- **Open**: The price when the candle started
- **Close**: The price when the candle ended
- **High**: The highest price during the candle
- **Low**: The lowest price during the candle
- **Body**: The rectangle between Open and Close
- **Wick/Shadow**: The thin lines above and below the body
---
## 📐 The 4 Components of Candle Strength
This indicator combines **4 measurements** to calculate the final strength score. Let's understand each one:
---
### 1️⃣ Body Ratio (30% of score)
**What it is:**
The percentage of the candle that is "body" versus "wicks."
**Formula:**
```
Body Ratio = Size of Body ÷ Total Candle Size × 100
```
**What it tells you:**
- **High Body Ratio (70-100%)**: Bulls or bears were in FULL control. The price moved in one direction and STAYED there. This is strong.
- **Low Body Ratio (0-30%)**: There was a fight. Price moved up AND down but ended up roughly where it started. This is weak/indecisive.
**Visual Example:**
```
Strong Candle (90% body): Weak Candle (20% body):
│ │
┌───┐ │
│ │ ┌─┴─┐
│ │ ← Mostly body │ │ ← Tiny body
│ │ └─┬─┘
└───┘ │
│ │
```
**How to interpret:**
| Body Ratio | Meaning |
|------------|---------|
| 90-100% | **Marubozu** - Extremely strong, full commitment |
| 70-90% | **Strong** - Clear winner (bulls or bears) |
| 40-70% | **Normal** - Typical market activity |
| 10-40% | **Weak** - Significant indecision |
| 0-10% | **Doji** - Complete indecision, no winner |
---
### 2️⃣ Close Position Score (25% of score)
**What it is:**
WHERE the candle closed within its range (high to low).
**What it tells you:**
- For a **bullish (green) candle**: Closing near the HIGH means buyers were still eager at the end = STRONG
- For a **bearish (red) candle**: Closing near the LOW means sellers were still eager at the end = STRONG
**Visual Example:**
```
Strong Bullish: Weak Bullish:
(closes near high) (closes near middle)
┌───┐ ← Close here │
│ │ ┌─┴─┐ ← Close here
│ │ │ │
│ │ │ │
└───┘ └───┘
│ │
```
**Why it matters:**
If price went UP but then sellers pushed it back down before the candle closed, that's a sign of weakness. The bulls couldn't hold their ground.
**How to interpret:**
| Close Position | For Bullish Candle | For Bearish Candle |
|----------------|-------------------|-------------------|
| 80-100% | Strong (near high) | Weak (near high) |
| 50-80% | Moderate | Moderate |
| 20-50% | Weak | Moderate |
| 0-20% | Very Weak (near low) | Strong (near low) |
---
### 3️⃣ Relative Volume - RVOL (25% of score)
**What is Volume?**
Volume is the NUMBER of shares/contracts traded during that candle. Think of it as "how many people participated."
**What is RVOL?**
RVOL compares TODAY'S volume to the AVERAGE volume.
**Formula:**
```
RVOL = Current Volume ÷ Average Volume (last 20 candles)
```
**What it tells you:**
- **RVOL = 1.0**: Normal activity (same as average)
- **RVOL = 2.0**: DOUBLE the normal activity (2x more traders involved)
- **RVOL = 0.5**: HALF the normal activity (fewer traders involved)
**Why it matters:**
A big price move with LOW volume is suspicious - it might not last.
A big price move with HIGH volume is confirmed - many traders agree.
**Think of it like voting:**
- High volume = Many people voted for this direction
- Low volume = Only a few people voted, decision might change
**How to interpret:**
| RVOL | Meaning | Signal Quality |
|------|---------|----------------|
| 2.0+ | Very High - Institutional activity likely | ⭐⭐⭐ Excellent |
| 1.5-2.0 | High - Significant interest | ⭐⭐ Good |
| 1.0-1.5 | Above Average | ⭐ Acceptable |
| 0.7-1.0 | Below Average | ⚠️ Caution |
| < 0.7 | Low - Lack of interest | ❌ Unreliable |
---
### 4️⃣ Size vs ATR (20% of score)
**What is ATR?**
ATR stands for "Average True Range." It measures how much the price TYPICALLY moves.
**What this component measures:**
How big is THIS candle compared to how big candles USUALLY are?
**Formula:**
```
ATR Ratio = This Candle's Size ÷ Average Candle Size (ATR)
```
**What it tells you:**
- **ATR Ratio = 2.0**: This candle is TWICE as big as normal = Significant move
- **ATR Ratio = 1.0**: This candle is normal sized
- **ATR Ratio = 0.5**: This candle is HALF the normal size = Minor move
**Why it matters:**
A 50-point move in a stock that normally moves 100 points is small.
A 50-point move in a stock that normally moves 20 points is HUGE.
Context matters!
**How to interpret:**
| ATR Ratio | Meaning |
|-----------|---------|
| 2.0+ | **Expansion** - Unusually large move, potential breakout |
| 1.5-2.0 | **Large** - Significant momentum |
| 1.0-1.5 | **Above Average** - Notable move |
| 0.5-1.0 | **Normal** - Typical movement |
| < 0.5 | **Small** - Insignificant, might be noise |
---
## 🧮 How the Final Score is Calculated
The indicator combines all 4 components with these weights:
```
Final Score = (Body Ratio × 30%) +
(Close Position × 25%) +
(RVOL Score × 25%) +
(Size Score × 20%)
```
**Result: A score from 0 to 100**
---
## 📊 Understanding the Strength Score
| Score | Classification | What It Means | Should You Trade It? |
|-------|---------------|---------------|---------------------|
| **70-100** | 🟢 STRONG | High conviction move, reliable signal | ✅ Yes - Good setup |
| **40-70** | 🟡 MODERATE | Average move, needs confirmation | ⚠️ Maybe - Add other indicators |
| **0-40** | 🔴 WEAK | Low conviction, unreliable | ❌ No - Wait for better setup |
---
## 🏷️ Special Pattern Markers
The indicator also detects special candlestick patterns:
### ⚡ Power Candle
**Requirements:**
- Body Ratio > 70% (strong body)
- RVOL > 1.5 (high volume)
- Close Position > 80% (closes near the extreme)
**What it means:** The BEST possible signal. Everything aligns perfectly.
### Ⓜ️ Marubozu
**Requirements:**
- Body Ratio > 90% (almost no wicks)
**What it means:** Complete dominance by bulls or bears. Very strong continuation signal.
### ◆ High Volume Doji
**Requirements:**
- Doji candle (tiny body)
- High volume
**What it means:** Many traders are fighting, but no one won. Often signals a REVERSAL is coming.
---
## ⚙️ Settings Explained
### Volume Settings
| Setting | Default | What It Does |
|---------|---------|--------------|
| Volume Lookback Period | 20 | How many candles to average for "normal" volume |
| RVOL Threshold | 1.5 | What counts as "high" volume (1.5 = 50% above average) |
### ATR Settings
| Setting | Default | What It Does |
|---------|---------|--------------|
| ATR Period | 14 | How many candles to calculate average movement |
| ATR Multiplier | 1.5 | What counts as a "large" candle |
### Strength Thresholds
| Setting | Default | What It Does |
|---------|---------|--------------|
| Strong Candle Threshold | 70 | Score needed to be "strong" |
| Weak Candle Threshold | 30 | Score below this is "weak" |
### Label Filter (Important!)
TradingView limits indicators to **500 labels maximum**. Use filters to see more history:
| Filter Mode | Shows | Best For |
|-------------|-------|----------|
| All Candles | Every single candle | Short-term charts (5min, 15min) |
| Strong Only (70+) | Only strong candles | Longer history, key signals only |
| Moderate+ (40+) | Moderate and strong | Balance of detail and history |
| Custom Minimum | Your choice | Full control |
**Tip:** On daily charts, use "Strong Only" to see months of history instead of just a few weeks.
### Label Settings
| Setting | What It Does |
|---------|--------------|
| Label Size | tiny / small / normal / large |
| Show Decimal Places | Show "72.5" instead of "73" |
| Label Style | With background bubble OR just text |
---
## 📖 How to Read the Info Table
The table in the corner shows details for the CURRENT (most recent) candle:
| Row | Meaning |
|-----|---------|
| **Candle Strength** | The final score (0-100) |
| **Direction** | BULLISH / BEARISH / DOJI |
| **Body Ratio** | Percentage of candle that is body |
| **Close Position** | Where it closed (0-100) |
| **Upper Wick** | Size of upper wick as % |
| **Lower Wick** | Size of lower wick as % |
| **RVOL** | Current volume vs average (1.5x = 50% above average) |
| **Size/ATR** | Candle size vs average size |
| **Classification** | STRONG / MODERATE / WEAK |
| **Vol Confirmed** | Is volume above threshold? |
| **Pattern** | Special pattern detected |
---
## 🎓 How to Use This Indicator
### Step 1: Add to Chart
1. Open Pine Editor in TradingView
2. Paste the code
3. Click "Add to Chart"
### Step 2: Adjust Filter (if needed)
- If you see "max labels reached," change filter to "Strong Only (70+)"
- This lets you see more candles in history
### Step 3: Look for Strong Signals
Focus on candles with:
- ✅ Score **70+** (bright green or red)
- ✅ **RVOL > 1.5** (confirmed by volume)
- ✅ Special markers (⚡, M, ◆)
### Step 4: Avoid Weak Signals
Be careful with candles that have:
- ❌ Score **below 40** (muted colors)
- ❌ **RVOL < 1.0** (no volume confirmation)
- ❌ Large wicks (rejection happened)
---
## 💡 Trading Tips for Beginners
### ✅ DO:
1. **Wait for strong candles (70+)** before entering trades
2. **Confirm with volume** - Look for RVOL > 1.5
3. **Use at support/resistance levels** - Strong candles at key levels are more meaningful
4. **Combine with other indicators** - RSI, MACD, or moving averages
5. **Practice on demo first** - Learn to recognize strong vs weak candles
### ❌ DON'T:
1. **Trade every candle** - Not all candles are worth trading
2. **Ignore volume** - A strong candle with low volume is suspicious
3. **Fight the trend** - Strong bearish candles in an uptrend might just be pullbacks
4. **Over-leverage** - Even strong signals can fail
---
## 📝 Quick Reference Cheat Sheet
```
STRONG CANDLE CHECKLIST:
□ Score 70+
□ RVOL > 1.5
□ Body Ratio > 60%
□ Close Position > 75% (bullish) or < 25% (bearish)
□ At key support/resistance level
WEAK CANDLE WARNING SIGNS:
□ Score < 40
□ RVOL < 0.7
□ Large wicks (> 30%)
□ Doji pattern
□ Small candle (ATR Ratio < 0.5)
```
---
## ⚠️ Important Disclaimers
1. **No indicator is 100% accurate** - Always use stop losses
2. **Past performance ≠ future results** - Markets change
3. **This is a tool, not a strategy** - Combine with other analysis
4. **Practice first** - Use paper trading before real money
---
## 🔔 Alerts Available
Set alerts for:
- Strong Bullish Candle (with volume confirmation)
- Strong Bearish Candle (with volume confirmation)
- Power Candle detected
- Marubozu detected
- High Volume Doji detected
---
## ❓ FAQ
**Q: Why are some candles missing labels?**
A: TradingView limits indicators to 500 labels. Use filters to see more history.
**Q: The label colors are hard to see. Can I change them?**
A: Yes! Go to Settings → Colors and customize all colors.
**Q: Should I only trade strong candles?**
A: Strong candles are MORE reliable, but not guaranteed. Always use proper risk management.
**Q: What timeframe works best?**
A: Works on all timeframes. Higher timeframes (4H, Daily) tend to have more reliable signals.
**Q: Can I use this for crypto/forex/stocks?**
A: Yes! This indicator works on any market with candlestick data and volume.
---
## 📚 Glossary
| Term | Definition |
|------|------------|
| **Bullish** | Price is going UP / Buyers are winning |
| **Bearish** | Price is going DOWN / Sellers are winning |
| **Doji** | Candle where open and close are nearly equal (indecision) |
| **Marubozu** | Candle with no wicks (full body) |
| **RVOL** | Relative Volume - current volume vs average |
| **ATR** | Average True Range - typical price movement |
| **Wick/Shadow** | The thin lines above/below the candle body |
| **Support** | Price level where buyers tend to step in |
| **Resistance** | Price level where sellers tend to step in |
| **Breakout** | When price moves beyond support/resistance |
---
**Happy Trading! 📈**
*Remember: The best traders are patient traders. Wait for strong setups.*

GC1 Orderflow Engine - sudoTLDR
This indicator measures relative buying and selling pressure by comparing GC1! futures returns against XAU price returns, normalized by their own volatility and weighted by GC1! volume. The result is a pressure histogram and line that show whether futures orderflow is leading, lagging, or diverging from spot gold in real time.
What this indicator does
The Orderflow Engine is designed to answer one core question:
Is GC1! futures orderflow applying net pressure in the same direction as XAU, or pushing against it?
It does this by isolating relative strength and weakness between futures and spot, rather than looking at price direction alone.
How the pressure calculation works
1. GC1! futures returns and XAU returns are calculated bar by bar
2. Each return is normalized by its own recent volatility
3. The normalized XAU return is subtracted from the normalized GC1! return
This creates a relative pressure value:
Positive pressure - GC1! futures are outperforming XAU
Negative pressure - GC1! futures are underperforming XAU
Near zero - futures and spot are moving in balance
To emphasize meaningful activity:
GC1! volume is converted into a normalized score
Higher-than-normal futures volume increases the weight of the pressure
Low-volume pressure is naturally dampened
The final output is clamped to keep the scale stable across different market conditions.
Visual output
Histogram
Green bars - positive futures pressure
Red bars - negative futures pressure
Gray bars - neutral or minimal pressure
Pressure line
A smoother view of the same pressure data
Useful for spotting momentum shifts and divergence
Zero line
Represents balance between futures and spot
Crosses often mark changes in orderflow control
Optional annotations
Regime shift markers based on futures participation
Optional percent-change labels for studying pressure acceleration
How to use it
-Confirm whether price moves are supported by futures orderflow
-Spot early divergence between GC1! and XAU
-Identify absorption , distribution , or initiative behavior
-Filter entries by trading only when pressure aligns with your bias
-This tool is best used as confirmation and context, not as a standalone signal generator.
Design philosophy
-Self-normalizing across sessions and volatility regimes
-No fixed thresholds that break over time
-Focused on relative behavior, not prediction
-Built to pair naturally with the Participation Regime indicator

Smart Money Concepts - Absorption Smart Money Concepts - Absorption (SMC-ABS)
Absorption event detector using split-volume VWMA ribbons, entropy filtering, and elasticity validation
Overview
This indicator highlights potential absorption/defense events: moments where price touches a volume-weighted band and then rejects, while additional filters confirm that market conditions are not random/noisy.
What it plots
• Energy ribbons (bands): two split-volume VWMA ribbon sets - Buy-weighted (cyan) and Sell-weighted (magma).
• ABS markers: printed when touch + rejection + validation conditions are met (see Logic section).
• Dashboard (HUD): real-time metrics such as price/volume z-scores, delta, entropy state, and resonance momentum states.
Core logic
1) Volume engine
The script builds Buy Volume and Sell Volume series using one of two modes:
• Geometry (candle-range split): estimates buy/sell participation from the close position within the candle range.
• Intrabar (precise): uses lower-timeframe up/down volume to derive buy/sell flows when data is available.
2) Split-VWMA resonance score
For multiple periods (5, 10, 20, 30, 40, 50), the script computes:
• A standard SMA of price.
• A Buy-weighted VWMA of price (weighted by Buy Volume).
• A Sell-weighted VWMA of price (weighted by Sell Volume).
Resonance is derived from the normalized divergence between the SMA and the split VWMAs, aggregated across the available periods.
3) Validation filters
Signals can be filtered by the following components (each toggleable):
• Volume-weighted entropy: a fractal-efficiency style disorder metric (TR-sum vs range) adjusted by relative volume; high entropy blocks signals.
• Momentum alignment (resonance velocity) : direction filter requiring positive velocity for buy events and negative velocity for sell events.
• Elasticity (recoil vs penetration): rejection quality check based on the bounce-back strength relative to the penetration depth into the fast band.
Absorption event conditions (ABS markers)
ABS markers are generated using the fastest ribbon band (length 5) for the touch/rejection logic:
• Buy absorption: low touches/penetrates the Buy band and the candle closes back above it, with filters passing.
• Sell absorption: high touches/penetrates the Sell band and the candle closes back below it, with filters passing.
Note: acceleration/deceleration is displayed in the HUD as a state; the primary directional filter is the resonance velocity.
Settings
• Volume Model: choose Geometry or Intrabar.
• Intrabar LTF: lower timeframe used by the Intrabar model (only applies when Intrabar is selected).
• Global Lookback: lookback window used for z-score statistics and related calculations.
• Quantum Filters: toggles and thresholds for entropy, momentum alignment, and elasticity validation.
• Dashboard Settings :/ Energy Ribbons / Absorption Events: controls for visuals and filtering behavior.
Usage notes and limitations
• Signals are most reliable after candle close. On the forming candle, conditions can change until the bar closes.
• Results depend on the availability and quality of volume data for the selected symbol and exchange.
• The Geometry mode is an estimate based on candle structure; it is not tick-accurate order flow.
• Terms such as “quantum” and “physics” are metaphorical labels for statistical filters and validation heuristics.
Disclaimer
This tool is provided for analytical and educational use only. It does not constitute investment advice. Trading involves risk.
Important note about Intrabar data and TradingView plan limits
This indicator is volume-dependent. When using the Intrabar model, the best results typically come from very low intrabar timeframes such as 1 tick or 1 second (if your symbol and data feed support it). Please check your TradingView subscription plan and data entitlements - access to 1-second/1-tick lower timeframes is commonly restricted to higher-tier plans (often referred to as Premium/Ultra tiers). If intrabar data is not available, the script falls back to relative buy/sell volume estimation (Geometry mode), and results may be less precise.

GC1 Participation Regime - sudoThis indicator analyzes COMEX GC1! futures activity and maps it directly onto your XAU price chart, allowing you to see when gold futures participation meaningfully increases or fades - without cluttering your workflow.
Here is the TLDR version of the description (below):
The "regime" is calculated by measuring how active GC1! futures are, compared to their own recent history. On each bar, the indicator looks at two things - volume (how much trading occurred) and true range (how much price actually moved). Each of these is compared to its recent average using a normalized score, which simply answers whether today’s activity is higher, normal, or lower than usual. Those two normalized values are then combined into a single participation score , optionally smoothed to reduce noise. That score is compared against user-defined thresholds and classified into one of four regimes - Low, Normal, High, or Extreme participation . In short, the regime shows whether current GC1! futures activity is unusually quiet or unusually active relative to its own recent behavior , without making any directional assumptions.
What this indicator does
-Measures GC1! futures volume and true range relative to their own historical behavior using z-scores
-Combines those metrics into a single participation score
-Classifies the market into four participation regimes
Low
Normal
High
Extreme
Projects those regimes directly onto the XAU price chart
Visual elements
Background shading
-Gray - Low participation
-Blue - Normal participation
-Green - High participation
-Orange - Extreme participation
Regime shift markers
-Upward triangle below price when participation increases
-Downward triangle above price when participation decreases
Volume-informed candle coloring (optional)
-High GC volume + bullish candle
-High GC volume + bearish candle
-Low GC volume + bullish candle
-Low GC volume + bearish candle
These visuals help you instantly identify whether price movement is occurring with real futures participation or during thinner conditions.
How to use it
-Identify high-quality environments for execution when participation is elevated
-Filter breakouts, trends, and reversals based on whether GC futures are involved
-Avoid overconfidence during low-participation regimes, where price moves are more prone to failure
-Use regime transitions as context , not signals!!
-This indicator is designed to be contextual , not predictive .
Customization
-Adjustable lookback lengths for volume and range
-Fully tunable regime thresholds
-Optional background shading
-Optional regime shift markers
-Optional candle recoloring based on GC volume behavior
Everything can be dialed up or down depending on how visually minimal you want your chart to be.
Notes
-Built specifically around COMEX GC1! futures
-Designed to disappear if GC data is unavailable
-Works on all intraday and higher timeframes

Price Contraction / Expansion1. Introduction
The Price Contraction / Expansion indicator highlights areas of market compression and volatility release by analyzing candle body size and volume behavior. It provides a fast, color-coded visualization to identify potential breakout zones, accumulation phases, or exhaustion movements.
This tool helps traders recognize when price action is tightening before a volatility expansion — a common precursor to strong directional moves.
2. Key Features
Dynamic body analysis: Compares each candle’s body size with a moving average to detect contraction (small bodies) and expansion (large bodies).
Volume confirmation: Measures whether volume is unusually high or low compared to its recent average, helping filter false breaks.
Color-coded system for clarity:
Yellow: Contraction with high volume (potential accumulation or strong activity).
Blue: Contraction with normal volume or expansion with low volume (neutral/reduced participation).
Green: Expansion in bullish candle (buyer dominance).
Red: Expansion in bearish candle (seller dominance).
Customizable parameters: Adjust body and volume averaging periods and thresholds to fit different market conditions or timeframes.
3. How to Use
Identify contraction zones: Look for blue or yellow bars to locate areas of price compression — these often precede breakouts or large movements.
Wait for expansion confirmation: A shift to green or red bars with increasing volume indicates that volatility is expanding and momentum is building.
Combine with context: Use this indicator alongside trend tools, liquidity zones, or moving averages to confirm directional bias and filter noise.
Adapt thresholds: In highly volatile markets, increase the “Threshold multiplier” to reduce false contraction signals.
This indicator is most effective for traders who focus on volatility behavior, market structure, and timing potential breakout opportunities.

Momentum & Breakout Confirmationwatch momentum build in real time on the current candle so you can confirm weather a breakout is indeed a breakout or will be a fake out. This is what it does
This is a Momentum & Breakout Confirmation (MBC) indicator that analyzes the current candle in real-time to determine if it's a strong continuation move or possible reversal. Here's the breakdown:
What It Measures:
Momentum Strength - How much % the candle moved:
STRONG = >0.5% move
MEDIUM = 0.2-0.5%
WEAK = <0.2%
Direction - Simply bullish (green candle) or bearish (red candle)
Four Confirmation Factors:
Volume Surge - Is volume 1.5x above the 20-period average?
Move Size - Is the candle body larger than 0.5x ATR (significant)?
Body Strength - Is the body >60% of total candle range (strong conviction, minimal wicks)?
Trend Aligned - Does it align with 9/21 MA trend direction?
The Scoring System:
Adds 1 point for each confirmation factor met (max 4 points)
3-4 points = "STRONG CONTINUATION" 🚀
2 points = "LIKELY CONTINUATION"
1 point = "WEAK SIGNAL"
0 points = "POSSIBLE REVERSAL" ⚠️
Key Difference from TPC:
TPC uses multi-timeframe SuperTrend for strategic entries
MBC focuses on the current candle only - it's asking "Is THIS candle showing real momentum or is it weak/fake?"
Practical Use:
Great for confirming if a breakout or move is "real" with strong conviction behind it, or if it's low-volume/weak-bodied and likely to fail. The table updates live so you can watch momentum build during the candle formation.
Hope it helps. if you guys have any ideas for any indicators you want made please feel free to dm me as i like a good challenge lol ill sit here and try to code anything now im not saying i will be 100 percent successful but i will try for you, thanks for all the support from all you guys i def do appreciate it.

Effort-Result Divergence [Interakktive]The Effort-Result Divergence (ERD) measures whether volume effort is producing proportional price result. It quantifies the classic Wyckoff principle: when price moves easily, momentum is real; when price struggles despite heavy volume, absorption is occurring.
Think of ERD as "energy efficiency" for price movement — green means price is gliding, red means price is grinding.
█ WHAT IT DOES
• Measures volume EFFORT relative to average volume
• Measures price RESULT relative to ATR-normalized movement
• Computes ERD = Result minus Effort (each scaled 0-100)
• Flags statistical divergences via Z-score analysis
• Absorption events: high effort, low result (negative ERD)
• Vacuum events: low effort, high result (positive ERD)
█ WHAT IT DOES NOT DO
• NO buy/sell signals
• NO entry/exit recommendations
• NO alerts (v1 is educational only)
• NO performance claims or guarantees
This is a context tool for understanding market participation quality.
█ HOW IT WORKS
The ERD analyzes two dimensions of market activity and compares them.
EFFORT (Volume Intensity)
Compares current volume to a moving average baseline:
Effort Ratio = Volume ÷ SMA(Volume, Length)
Effort Score = clamp(100 × Effort Ratio ÷ Effort Cap)
High effort means above-average volume participation.
Low effort means below-average volume participation.
RESULT (Price Efficiency)
Measures how much price moved relative to expected volatility:
Result Ratio = |Close − Previous Close| ÷ ATR
Result Score = clamp(100 × Result Ratio ÷ Result Cap)
High result means price moved significantly for the volatility regime.
Low result means price barely moved despite market activity.
ERD SCORE
ERD = Result − Effort
• Positive ERD: Result exceeds effort → price moved easily (vacuum/thin liquidity)
• Negative ERD: Effort exceeds result → price struggled (absorption/accumulation)
• Near zero: Balanced effort-to-result relationship
STATISTICAL DIVERGENCE DETECTION
Z-score analysis identifies statistically significant extremes:
Z = (ERD − Mean) ÷ StdDev
• Absorption Event: Z ≤ −threshold (extreme negative ERD)
• Vacuum Event: Z ≥ +threshold (extreme positive ERD)
█ INTERPRETATION
GREEN BARS (Positive ERD)
Price moved with relatively little volume effort. This suggests:
• Thin liquidity / low resistance
• Strong directional interest
• Momentum is "real" — not forced
RED BARS (Negative ERD)
Heavy volume was used but price barely moved. This suggests:
• Absorption / accumulation occurring
• Large players opposing the move
• Inefficiency — someone is working hard for little result
THE KEY INSIGHT
When you see:
• Down moves = high effort (red spikes)
• Up moves = low effort (green bars)
This means: It's easier for price to go up than down.
That is asymmetric strength — classic bullish pressure.
The reverse (red on up moves, green on down moves) signals bearish pressure.
PRACTICAL RULES
Without any other indicators:
• Avoid shorting when ERD is mostly green and red spikes appear only on down candles
• Be cautious buying when ERD turns red on up candles (signals absorption of buying pressure)
• Vacuum events (extreme green) often precede continuation or pause — not violent reversal
• Absorption events (extreme red) often precede reversals or range formation
█ VOLUME DATA NOTE
This indicator uses the volume variable which represents:
• Exchange volume on stocks and futures
• Tick volume on Forex and CFD instruments
Tick volume is a proxy for activity, not actual exchange volume. The indicator remains useful on Forex as relative volume comparisons are still meaningful, but interpretation should account for this limitation.
█ INPUTS
Core Settings
• Volume Average Length: Baseline period for effort calculation (default: 20)
• ATR Length: Volatility normalization period (default: 14)
• Effort Cap: Volume ratio that maps to 100% effort (default: 3.0)
• Result Cap: ATR multiple that maps to 100% result (default: 1.0)
Divergence Detection
• Z-Score Lookback: Statistical analysis window (default: 100)
• Z-Score Threshold: Standard deviations for event flags (default: 2.0)
Visual Settings
• Show ERD Histogram: Toggle main display
• Show Zero Line: Toggle reference line
• Show Divergence Markers: Toggle event circles
• Show Effort/Result Lines: Display component breakdown
█ ORIGINALITY
While Wyckoff's effort-versus-result principle is well-established, existing implementations are typically:
• Purely visual with no quantification
• Pattern-based requiring subjective interpretation
• Not statistically normalized for comparison across instruments
ERD is original because it:
1. Normalizes both effort and result to 0-100 scales for direct comparison
2. Uses ATR for result normalization (adapts to volatility regime)
3. Applies statistical Z-score for objective divergence detection
4. Provides quantified output suitable for systematic analysis
█ DATA WINDOW EXPORTS
When enabled, the following values are exported:
• Effort (0-100)
• Result (0-100)
• ERD Score
• Z-Score
• Absorption Event (1/0)
• Vacuum Event (1/0)
█ SUITABLE MARKETS
Works on: Stocks, Futures, Forex, Crypto
Best on: Instruments with reliable volume data (stocks, futures, crypto)
Timeframes: All timeframes — interpretation adapts accordingly
█ RELATED
• Market Efficiency Ratio — measures price path efficiency
• Wyckoff Volume Spread Analysis — conceptual foundation
█ DISCLAIMER
This indicator is for educational purposes only. It does not constitute financial advice. Past performance does not guarantee future results. Always conduct your own analysis before making trading decisions.

Money VolThe indicator displays the trading volume in monetary terms and its ratio to the average trading volume over 100 periods. It highlights volumes that are 2x, 5x, 10x, or less than 2x the average.
Индикатор показывает объем торгов в денежном выражении, отношение к среднему объему торгов за 100 периодов, подсвечивает х2, х5, х10 и меньше более чем х2

MarketMind LITEM🜁rketMind LITE ────────────────────
Essential Market Awareness, Reduced to Its Core
M🜁rketMind LITE is a lightweight market awareness tool designed to display essential situational context .
It provides basic orientation and movement awareness without interpretation, risk framing, diagnostics, or decision guidance.
This script is designed as a standalone awareness layer. It does not evaluate trade quality, issue signals, or influence decision-making.
WHAT IT DOES ────────────────────
M🜁rketMind LITE presents a minimal, static view of current market conditions focused entirely on awareness rather than analysis.
The system displays only essential context, allowing traders to stay oriented without introducing judgment, noise, or implied direction.
The script provides visibility into:
Time-of-day session context
Basic market regime classification (trending, range-bound, mixed)
Short-term momentum direction only (up, down, neutral)
A clean, static HUD display
M🜁rketMind LITE also includes a minimal visual state indicator that reflects recent price responsiveness, intended to be observed over time alongside the trader’s own experience.
The goal is to support awareness without influence .
HOW TO USE IT ────────────────────
M🜁rketMind LITE is not a signal generator.
It is designed to remain visible in the background of any chart, offering quiet orientation while traders rely entirely on their own process for analysis and execution.
Common use cases include:
Maintaining session awareness
Preserving context during focused trading periods
Reducing cognitive load while monitoring markets
M🜁rketMind LITE does not evaluate risk, alignment, or opportunity.
It simply shows what is happening.
DESIGN PHILOSOPHY ────────────────────
M🜁rketMind LITE is intentionally minimal.
It includes only essential awareness elements and excludes all interpretive or evaluative logic:
Situational context only
Directional momentum (up / down / neutral)
No diagnostics, confidence, or conviction framing
No process, risk, or quality assessment
Presentation controls only (HUD on/off, size, position)
Nothing is inferred.
Nothing is suggested.
This script shows market state without interpretation.
WHO IT IS FOR ────────────────────
M🜁rketMind LITE is suited for traders who:
Want passive situational awareness
Prefer minimal on-chart information
Already operate with a defined decision process
It is not designed for:
Analytical or diagnostic use
Risk evaluation or context synthesis
Traders seeking guidance or confirmation
IMPORTANT NOTES ────────────────────
M🜁rketMind LITE does not provide financial advice
No system can predict future price behavior
This tool is designed for awareness only
Used appropriately, M🜁rketMind LITE helps traders stay oriented without interference.

Auto-Anchored Fibonacci Volume Profile [Custom Array Engine]Description:
1. The Theoretical Foundation: Structure vs. Participation In professional technical analysis, traders often struggle to reconcile two distinct datasets: Price Geometry (where price should go) and Market Participation (where money actually went).
Why Fibonacci? (The Structure) Fibonacci Retracements map the mathematical structure of a trend. They identify psychological and algorithmic "interest zones" (0.382, 0.5, 0.618) where a correction is statistically likely to terminate. However, Fibonacci levels are theoretical—they are "lines in the sand" that do not guarantee liquidity or reaction.
Why Volume Profile? (The Verification) Volume Profile maps the historical exchange of shares at specific price levels. It reveals "fair value" (High Volume Nodes) and "market imbalance" (Low Volume Nodes). It is the only tool that verifies if a specific price level was actually accepted by institutional participants.
2. Underlying Calculations (The Custom Engine) This script operates on a custom-built calculation engine that bypasses standard built-in functions entirely. It uses Pine Script Arrays to build a Volume Profile from scratch. Here is the breakdown of the proprietary code logic:
A. The "Smart-Fill" Distribution Algorithm (Solves Gapping)
The Problem: Standard volume scripts often assign a candle's entire volume to a single price row. In volatile markets or steep trends, this creates visual "gaps" or a "barcode" effect because price moved too fast to register on every row.
My Solution: I wrote a custom loop that calculates the vertical overlap of every candle against the profile grid.
The Math: Volume Per Bin = Total Candle Volume / Bins Touched.
The Result: If a single volatile candle spans 10 price rows (bins), the script mathematically divides that volume and distributes it equally into all 10 array indices. This generates a solid, continuous distribution curve that accurately reflects price action through the entire candle range, not just the close.
B. Dynamic Arrays & Split-Volume Logic The script initializes two separate floating-point arrays (buyVolArray and sellVolArray) sized to the user's resolution (up to 300 rows). It iterates through the specific time-window of the swing:
If Close >= Open, the calculated volume slice is injected into the Buy Array.
If Close < Open, it is injected into the Sell Array.
These arrays are then visually stacked to render the dual-color profile, allowing traders to see the "Delta" (Buyer vs. Seller aggression) at key structural levels.
C. Custom Garbage Collection (Performance) To enable the "Auto-Anchoring" feature without causing chart lag or visual artifacts ("ghosting"), the script includes a Garbage Collection System. Before drawing a new profile, the script iterates through a tracking array of all existing objects (box.delete, line.delete) and clears them from memory. This ensures the indicator remains lightweight and responsive even when dragging chart margins or switching timeframes.
3. The Synthesis: Why Combine Them? The core philosophy of this script is Confluence . A Fibonacci level without volume is merely a suggestion; a Fibonacci level backed by volume is a defensive wall. By algorithmically anchoring a Volume Profile to the exact coordinates of a Fibonacci swing, this tool allows traders to instantly answer critical questions:
"Is the Golden Pocket (0.618) supported by a High Volume Node (HVN), or is it a Low Volume Node (LVN) that price might slice through?"
"Is the Shallow Retracement (0.382) holding because of structural support, or just a lack of selling pressure?"
4. How to Read the Indicator
The Geometry: The script automatically detects the trend and draws standard Fib levels (0, 0.236, 0.382, 0.5, 0.618, 0.786, 1.0).
The Confluence Check: Look for the Point of Control (Red Line). If this High Volume Node aligns with a key Fib level (e.g., the 0.618), the probability of a reversal increases significantly.
The Imbalance Check: Look for "Valleys" in the profile (Low Volume Nodes). These gaps often act as "slippage zones" where price travels quickly between structural levels.
Buy/Sell Splits: The dual-color bars (Teal/Red) reveal the composition of the volume. A 0.618 level held up by dominant Buy Volume is a stronger bullish signal than one with mixed volume.
5. Settings & Customization
Lookback Length: Sensitivity of the swing detection (Default: 200 bars).
Resolution: Granularity of the profile rows (Default: 100). Higher values provide smoother definition.
Width (%): Responsive sizing that scales the profile relative to the trend's duration.
Extend Lines: Option to project structural levels infinitely to the right.
Disclaimer This script is an analytical tool for visualizing historical market data. It does not provide trade signals or financial advice.

Session Relative VolumeSession Relative Volume is an advanced intraday futures volume indicator that analyzes volume separately for Asia, London, and New York sessions - something standard relative volume tools can’t do.
Instead of aggregating the entire day’s volume, the indicator compares current volume to historical averages for the same session and time of day, allowing you to spot true volume strength and meaningful spikes, especially around session opens.
Background
Relative volume helps traders spot unusual activity: high volume often signals institutional participation and trending days, while low volume suggests weak commitment and possible mean reversion. In futures markets, sessions ( Asia, London, New York ) must be analyzed separately, but TradingView’s Relative Volume in Time aggregates the entire day, masking session-specific behavior - especially during the New York open. Since volume can vary by more than 20× between sessions, standard averages struggle to identify meaningful volume spikes when trader conviction matters most.
Indicator Description
The “Session Relative Volume” indicator solves these problems by calculating historical average volume specific to each session and time of day, and comparing current volume against those benchmarks. It offers four display modes and fully customizable session times
Altogether, it provides traders with a powerful tool for analyzing intraday futures volume, helping to better assess market participation, trader conviction, and overall market conditions - ultimately supporting improved trading decisions.
Parameters
Mode – display mode:
R-VOL: Relative cumulative session-specific volume at time
VOL CUM: Cumulative session volume at time compared to historical average cumulative session-specific volume
VOL AVG: Average session intrabar volume at time compared to historical average session-specific intrabar volume
VOL: Individual bars volume, highlighting (solid color) unusual spikes
Lookback period – number of days used for calculating historical average session volume at time
MA Len – length of the moving average, representing average bar volume within a session based on previous periods (different from historical cumulative volume!). Used only in VOL and VOL AVG modes
MA Thresh – deviation from moving average, used to detect bar volume spikes (bar volume > K × moving average)
Start Time – End Time and Time Zone parameters for each session. The time zone must be set using TradingView’s format (e.g., GMT+1).

Volume Weighted Average Price @Marx_CapitalSimple VWAP indicator edited to not connect the lines between sessions for a cleaner look without vertical lines at session ends.
Session end and start times are customizable.

AKILLI ANALIZ TERMINALI (V20-REVIZE)SMART ANALYSIS TERMINAL (V20-ULTIMATE)
This indicator is a professional-grade analysis terminal designed for both strategic daily analysis (Swing Trade) and real-time intraday trading (Scalp/Day Trade). It allows you to perform a complete technical X-ray of the market on a single dashboard.
CORE FEATURES:
- Dual-Mode Hybrid Engine: Choose between "NIGHT (ANALYSIS)" or "IN-DAY (AGGRESSIVE)" modes in settings. Mathematical periods and target levels update automatically.
- Smart Scoring System: Blends RSI, MACD, EMA, ADX, and Volume data to produce 5 distinct signals from "VERY POSITIVE" to "VERY NEGATIVE."
- Symmetrical Visual Panel: Left panel displays Live Signal, Pivot Balance, Money Flow, and Target/Support; right panel focuses on RSI, Trend, Momentum, and Volume confirmation.
- Money Flow Algorithm: Detects institutional accumulation (Entry) or distribution (Exit) by analyzing price-volume correlation.
USER GUIDE:
1. NIGHT MODE: Use for evening analysis to plan for the next day. Based on EMA 20/50 and standard MACD values.
2. IN-DAY MODE: Use during live sessions on 5m and 15m charts. Catch instant momentum shifts with EMA 9/21 and aggressive settings.

Refined Liquidity Flow IndicatorRefined Liquidity Flow Indicator - How It Works
The Refined Liquidity Flow Indicator is designed to help traders identify the flow of liquidity into and out of the market based on multiple technical factors. It combines price movement, market sentiment, volatility, and volume to give a comprehensive view of market conditions. The indicator gives buy and sell signals by calculating the flow of liquidity based on these factors.
Key Components of the Indicator:
Liquidity Flow Calculation:
The core of the indicator is the liquidity flow calculation, which is based on several factors:
Liquidity Flow=(V×ΔP)+(α×ATR)+(β×RSI)+(γ×ΔP)
Where:
𝑉 is the volume (the amount of trading activity).
ΔP is the price change (the difference between the current and previous closing price).
ATR (Average True Range) is used to measure market volatility.
RSI (Relative Strength Index) reflects market sentiment.
𝛼 𝛽 𝛾
are adjustable weights (parameters) that allow you to control how much influence each factor has on the liquidity flow calculation.
Key Indicators:
Volume (V): The amount of trades occurring in the market. A high volume indicates more activity, which is essential for confirming liquidity flow.
Price Change (ΔP): The difference between the current price and the previous price, which helps assess the strength and direction of the market move.
ATR (Average True Range): A measure of market volatility, indicating how much the price fluctuates over a specified period. A higher ATR suggests greater volatility, which often corresponds with a greater flow of liquidity.
RSI (Relative Strength Index): A momentum oscillator that measures whether a market is overbought or oversold. The RSI can help determine whether the market sentiment is bullish or bearish.
How to Use the Indicator:
Set Up: After adding the Refined Liquidity Flow Indicator to your chart, you can adjust the following settings directly from the indicator's settings panel:
α: Weight for volatility (ATR).
β: Weight for market sentiment (RSI).
γ: Weight for price change.
ATR Length: Customize the period for the ATR.
RSI Length: Customize the period for the RSI.
SMA Length: Customize the period for the Simple Moving Average.
Interpreting Signals:
Green Signal (Liquidity In): Indicates that liquidity is entering the market. This often signals a potential buy opportunity when the price is moving upwards with strong volume and market sentiment.
Red Signal (Liquidity Out): Indicates that liquidity is leaving the market. This typically signals a potential sell opportunity when the price is moving downwards with strong volume and market sentiment.
Fine-Tuning for Your Strategy:
By adjusting the weights and the lengths of the indicators, you can fine-tune the indicator to match your trading style. For example, if you want to give more weight to price movements, you can increase γ. If you want to focus more on market sentiment, adjust β.

