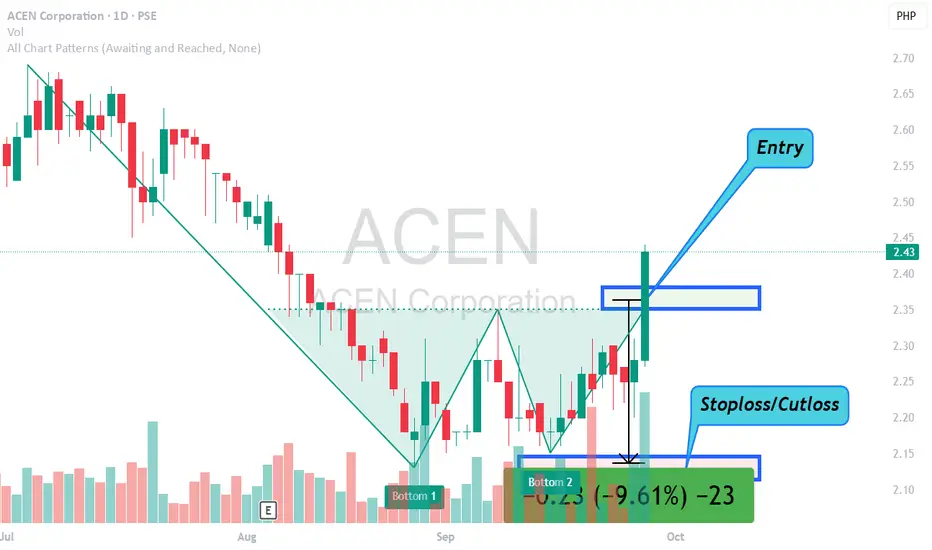
ACEN Bullish ReversalACEN created a bullish reversal chart pattern. A double bottom pattern.
Entry is on the break of the neckline. Put a stoploss or a cutloss point below the second bottom.
If you have entered on the breakout then you have more or less 10 percent risk. (Measured from entry to stoploss)
Lets see how t
AC ENERGY CORP.
No trades
Next report date
—
Report period
—
EPS estimate
—
Revenue estimate
—
0.0005 USD
160.80 M USD
620.79 M USD
9.31 B
About ACEN Corporation
Sector
Industry
CEO
John Eric T. Francia
Website
Headquarters
Makati City
Founded
1969
IPO date
Jan 5, 1970
Identifiers
3
ISIN PHY1001H1024
ACEN Corp. engages in power generation and trading, oil and mineral exploration, development, and production. It operates through the following segments: Philippines, International, and Parent and Others. The Philippines segment includes Retail Electricity Supply, Renewables, Thermal, Project development, Leasing, Bulk water supply, Petroleum and exploration. The International segment represents the operations of ACRI, which is the holding company for all offshore investments. The Parent and Others segment refers to the operations of the Parent Company excluding RES / CO and ACE Shared Services, Inc. It also includes interest expenses incurred by ACEN Finance Limited. The company was founded on September 8, 1969 and is headquartered in Makati City, Philippines.
Related stocks
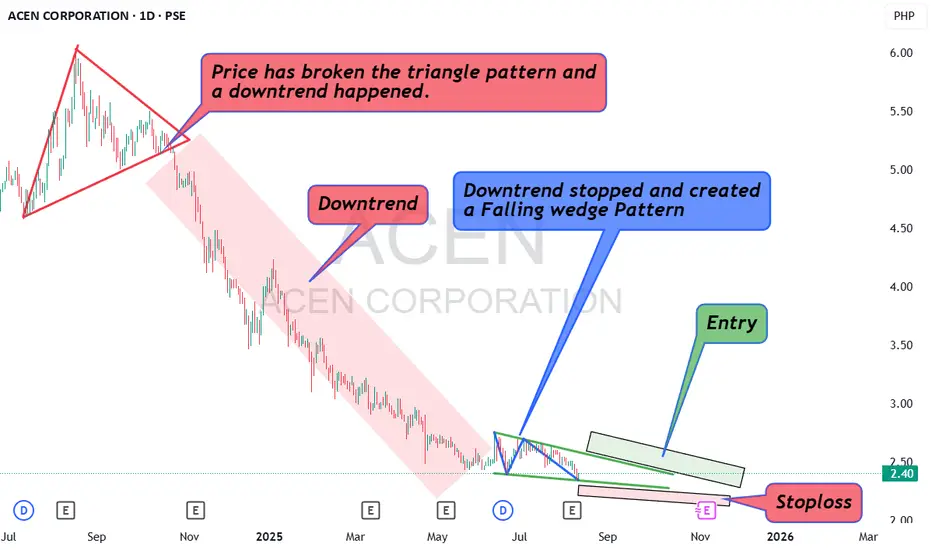
ACEN Trading Idea Aug 10 2025ACEN made a triangle chart pattern. A triangle chart pattern can be bullish or bearish depending which direction the breaks happen. In CAEN's case, it has broken the support side of the triangle. It is a bearish break. After that break, ACEN's price made a downtrend from October 2024 to June 2025. A
ACEN 6.55 | Key Levels for Buy Back energy politics and power
it takes 15 ++ years to recover capex
and with aggressive expansion
it looks like MARKET discounted the future revenue already
should stablize at key levels
for SECURiTIES under collateral
buy back at BRUTAL discount for Holders at the top should be
rewarding for pat


ACEN bounce back? Or deep to the marianas trench? Just simple technical support entry. If is breakdown then so be it😂

Acen growing about to constuct a lot of projectsSolar projects + trend line confirms long. Expecting more growth from acen


See all ideas
Summarizing what the indicators are suggesting.
Neutral
SellBuy
Strong sellStrong buy
Strong sellSellNeutralBuyStrong buy
Neutral
SellBuy
Strong sellStrong buy
Strong sellSellNeutralBuyStrong buy
Neutral
SellBuy
Strong sellStrong buy
Strong sellSellNeutralBuyStrong buy
An aggregate view of professional's ratings.
Neutral
SellBuy
Strong sellStrong buy
Strong sellSellNeutralBuyStrong buy
Neutral
SellBuy
Strong sellStrong buy
Strong sellSellNeutralBuyStrong buy
Neutral
SellBuy
Strong sellStrong buy
Strong sellSellNeutralBuyStrong buy
Displays a symbol's price movements over previous years to identify recurring trends.
AYAL5253870
ACEN Finance Ltd. 4.0% PERPYield to maturity
5.97%
Maturity date
—
CLYB5104573
AC Energy Finance International Limited 5.1% PERPYield to maturity
5.95%
Maturity date
—
See all ACPIF bonds
HSEM
HSBC ETFs PLC - HSBC Emerging Market Screened Equity UCITS ETF Accum USDWeight
0.02%
Market value
61.20 K
USD
HSMS
HSBC ETFs PLC - HSBC Emerging Market Screened Equity UCITS ETF USDWeight
0.02%
Market value
61.20 K
USD
XDG7
Xtrackers MSCI Global SDG 7 Affordable and Clean Energy UCITS ETFWeight
0.14%
Market value
47.88 K
USD
FLQA.USD
Franklin FTSE Asia ex China ex Japan UCITS ETF Accum Shs USDWeight
0.01%
Market value
46.92 K
USD
HSXD
HSBC Asia Pacific EX Japan Screened Equity UCITS ETF Accum Shs USDWeight
0.01%
Market value
46.28 K
USD
Explore more ETFs
Frequently Asked Questions
The current price of ACPIF is 0.0400 USD — it hasn't changed in the past 24 hours. Watch AC ENERGY CORP. stock price performance more closely on the chart.
Depending on the exchange, the stock ticker may vary. For instance, on OTC exchange AC ENERGY CORP. stocks are traded under the ticker ACPIF.
We've gathered analysts' opinions on AC ENERGY CORP. future price: according to them, ACPIF price has a max estimate of 0.07 USD and a min estimate of 0.05 USD. Watch ACPIF chart and read a more detailed AC ENERGY CORP. stock forecast: see what analysts think of AC ENERGY CORP. and suggest that you do with its stocks.
ACPIF reached its all-time high on Sep 2, 2021 with the price of 0.1600 USD, and its all-time low was 0.0100 USD and was reached on Jul 9, 2008. View more price dynamics on ACPIF chart.
See other stocks reaching their highest and lowest prices.
See other stocks reaching their highest and lowest prices.
ACPIF stock is 0.00% volatile and has beta coefficient of −0.06. Track AC ENERGY CORP. stock price on the chart and check out the list of the most volatile stocks — is AC ENERGY CORP. there?
Today AC ENERGY CORP. has the market capitalization of 1.95 B, it has increased by 1.41% over the last week.
Yes, you can track AC ENERGY CORP. financials in yearly and quarterly reports right on TradingView.
AC ENERGY CORP. is going to release the next earnings report on Mar 9, 2026. Keep track of upcoming events with our Earnings Calendar.
ACPIF net income for the last quarter is 17.57 M USD, while the quarter before that showed −21.02 M USD of net income which accounts for 183.57% change. Track more AC ENERGY CORP. financial stats to get the full picture.
Yes, ACPIF dividends are paid annually. The last dividend per share was 0.00 USD. As of today, Dividend Yield (TTM)% is 1.76%. Tracking AC ENERGY CORP. dividends might help you take more informed decisions.
AC ENERGY CORP. dividend yield was 0.00% in 2024, and payout ratio reached 0.00%. The year before the numbers were 0.91% and 21.46% correspondingly. See high-dividend stocks and find more opportunities for your portfolio.
As of Feb 14, 2026, the company has 333 employees. See our rating of the largest employees — is AC ENERGY CORP. on this list?
EBITDA measures a company's operating performance, its growth signifies an improvement in the efficiency of a company. AC ENERGY CORP. EBITDA is 1.47 M USD, and current EBITDA margin is 12.14%. See more stats in AC ENERGY CORP. financial statements.
Like other stocks, ACPIF shares are traded on stock exchanges, e.g. Nasdaq, Nyse, Euronext, and the easiest way to buy them is through an online stock broker. To do this, you need to open an account and follow a broker's procedures, then start trading. You can trade AC ENERGY CORP. stock right from TradingView charts — choose your broker and connect to your account.
Investing in stocks requires a comprehensive research: you should carefully study all the available data, e.g. company's financials, related news, and its technical analysis. So AC ENERGY CORP. technincal analysis shows the sell today, and its 1 week rating is sell. Since market conditions are prone to changes, it's worth looking a bit further into the future — according to the 1 month rating AC ENERGY CORP. stock shows the strong sell signal. See more of AC ENERGY CORP. technicals for a more comprehensive analysis.
If you're still not sure, try looking for inspiration in our curated watchlists.
If you're still not sure, try looking for inspiration in our curated watchlists.