When Arctic Storm Meets Government ShutdownNYMEX: Micro Henry Hub Natural Gas Futures ( NYMEX:MNG1! )
A “Perfect Storm” is brewing by weather catastrophe and man-made events.
On Thursday, November 6th, forecaster Atmospheric G2 said that it predicted colder than normal weather over the Eastern US for November 11-15. Driven by the expectations that record low temperatures will boost heating demand for natural gas, NYMEX Henry Hub natural gas futures ( AMEX:NG ) moved sharply higher.
The lead December contract (NGZ5) hit a daily high of $4.42 per MMBtu, up 18 cents (+5%) from the prior day. The contract settled at $4.357, up 12.5 cents or +2.95%. Total daily volume for all NG contract months reached 590,250 lots, an increase of 118,770 from the prior day. Total Open Interest was 1,556,062 contracts.
Then, just a day later, Atmospheric G2 put out another forecast. It said that warmer-than-normal temperatures are expected in the western two-thirds of the US for November 12-16 and are expected to remain above-normal for November 17-21. NGZ5 closed at $4.315 on Friday, down 0.96%. Another bearish factor came from Baker Hughes, which reported a 2.25-year high in the number of active US natural gas rigs.
On Sunday night, as the early winter blast begins to hit the ground, natural gas futures market opens for the week up 3.3% at $4.447. NGZ5 pulled back on Monday and is currently trading at $4.375. Shall we say, “Buy the rumor, Sell the fact”?
The news of a massive arctic storm moving the market is nothing new. During the past winter, on December 29, 2024, the Weather Co. and Atmospheric G2 released a weather forecast showing colder temperature in the East. When the futures market opened the next day, Henry Hub futures prices surged 20%, hitting a new 52-week high of $4.20. My write-up on January 6, 2025, explored how to trade the weather.
The Polar Vortex is expected to bring record amount of snow in the Great Lakes. Chicago and South Bend could see up to 12 inches of snow within 24 hours, due to the infamous “Lake Effect”. Florida and the Panhandle area could see temperature dropping from the 60s (Fahrenheit) to the mid-20s by Tuesday.
What stands out about this winter blast is its timing, happening very early in the season. Comparing to last winter, the first major snowstorm came in mid-January.
The winter storm threatens to bring air travel to a standstill. The impact will compound as the 40-day-long US government shutdown already reduced air flight capacity by 10%, causing massive cancellations and delays.
In the latest news, the US Senate may have reached a deal to end the government shutdown. Hopefully, it will happen in time ahead of Thanksgiving, the busiest travel season in the U.S.
The ideal instrument Trading the Weather
Natural gas is a leading energy source. The U.S. Energy Information Administration (EIA) estimates U.S. electricity production at 4.18 trillion kilowatt-hours in 2023.
• About 43.1% of the electricity was generated by natural gas.
• Nuclear power contributed to 18.6%, while coal had a 16.2% share.
• Renewables accounted for a 21.4% share, including 10.2% from Wind, 5.7% from Hydro, and 3.9% from Solar.
Electricity is hard to store, while its demand is highly unpredictable. Unforeseen changes in power demand could send shock waves into the market. In winter months, weather conditions have the biggest impact in natural gas demand.
In addition to power generation, the biggest natural gas usage is for heating homes, factories and commercial offices. According to the EIA data, 48% of US households use natural gas for space heating, water heating and cooking.
The heating consumption varies by season and by region, while the biggest contributing factor is temperature. As long-range weather forecasts are extremely difficult, natural gas prices are highly reactive to news of upcoming winter storms.
Heating Degree Day (HDD) is the number of days in a month where the average daily temperature is below 68 degrees Fahrenheit. Energy traders deploy HDD analysis and weather forecast models to predict temperature trends, electricity demand and subsequent natural gas use.
Trading with Micro Henry Hub Futures
Micro Henry Hub natural gas futures (MNG) offer smaller-sized versions of CME Group’s liquid benchmark Henry Hub futures (NG) contracts. The Micro futures have a contract size of 1,000 MMBtu, which is 1/10th of the standard contract.
The Micro contracts allow traders to control a large contract value with a small amount of capital to take advantage of significant margin offsets.
With Monday evening quote of 4.375, each December 2025 contract (MNGZ5) has a notional value of $4,375. Buying or selling one contract requires an initial margin of $367. The next lead contract, January 2026 (MNGF6), is currently quoting at 4.601, for a notional value of $4,601. The initial margin is $354.
Since hitting the 52-week low of $3.62, MNGZ5 has gone up 20%. Meanwhile, MNGF6 is down 25% from its 52-week high reached in March 2025.
As we have seen in the past, unpredictable weather events could send large shocks to natural gas prices. We have recognized the pattern of weather forecasts driving futures prices up, and then the prices trending back down in the midst of the storm. In my opinion, if we see another major winter storm coming in December, MNGF6 has the potential to move much higher.
With Micro Henry Hub contracts, traders could potentially realize sizable gains with a small capital requirement. For MNGF6, traders enjoy a built-in leverage of 13:1 (= 4601/354).
Hypothetically, if MNGF6 moves up 5% to $4.831 with lower temperature forecasts, the 0.23 price gain would translate into $230 for a long futures position, given the contract size at 1,000 MMBtu. Using the initial margin of $354 as a cost base, the trade would produce a theoretical return of 65.0% (=230/354).
The long futures position would lose money if natural gas prices moved lower. Traders could set up a stop loss to hedge the downside risk when entering the long futures order.
Happy Trading.
Disclaimers
*Trade ideas cited above are for illustration only, as an integral part of a case study to demonstrate the fundamental concepts in risk management under the market scenarios being discussed. They shall not be construed as investment recommendations or advice. Nor are they used to promote any specific products, or services.
CME Real-time Market Data help identify trading set-ups and express my market views. If you have futures in your trading portfolio, you can check out on CME Group data plans available that suit your trading needs www.tradingview.com
Trade ideas

Natural gas probable price projectionIt is clear form the chart Naturalgas has broken the latest pivot.
if price breaks the given level may reach to higher levels.

Naturalgas probable price projectionAs it is clear from the chart , price is following through parallel channel
1. if price breaks and sustains above the channel it may test higher levels
2. if price respects the channel then it moves downwards
NATGAS Bearish Breakout! Sell!
Hello,Traders!
NATGAS broke down from the bearish wedge, signalling displacement and a shift in order flow. After sweeping internal liquidity, price is expected to expand lower toward the marked target demand zone. Time Frame 4H.
Sell!
Comment and subscribe to help us grow!
Check out other forecasts below too!
Disclosure: I am part of Trade Nation's Influencer program and receive a monthly fee for using their TradingView charts in my analysis.


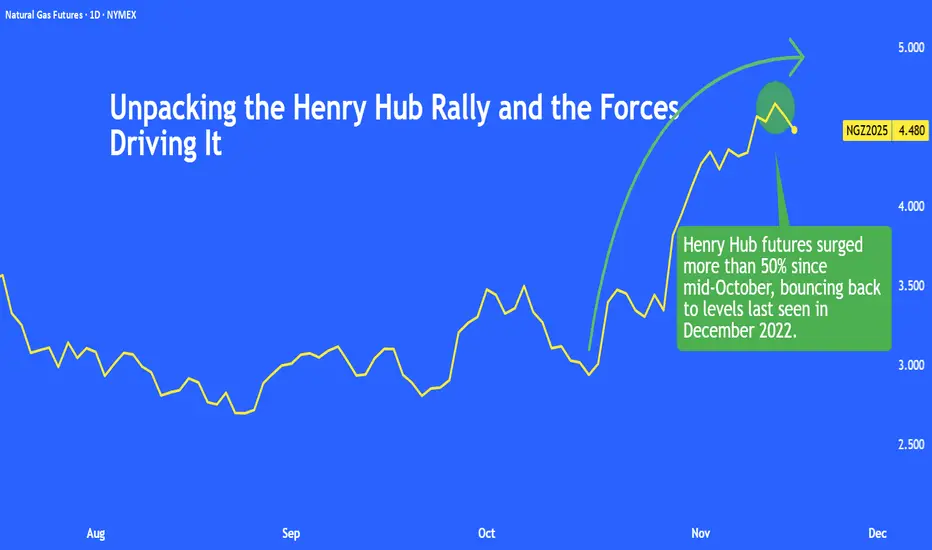
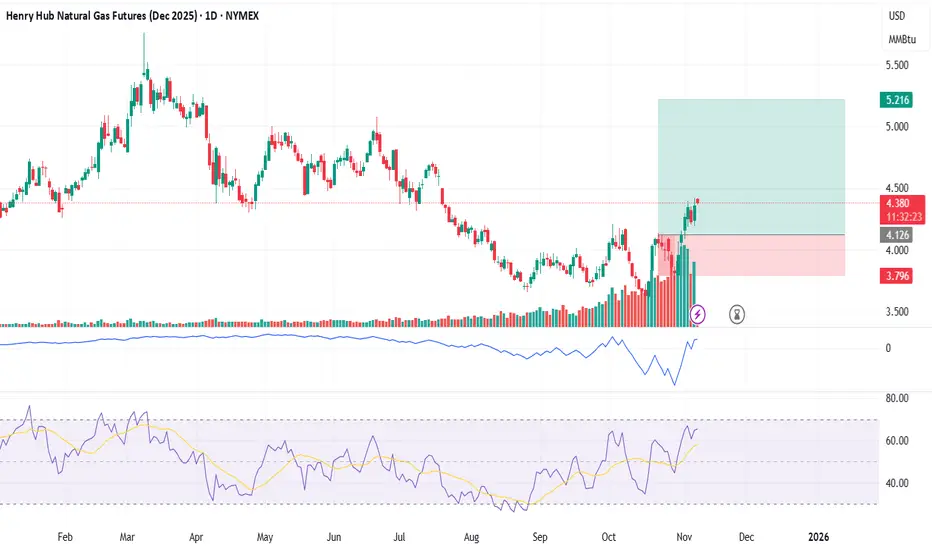
Unpacking the Henry Hub Rally and the Forces Driving It CME Henry Hub futures have surged since mid-October, reaching levels last seen in December 2022. This is an impressive rally given strong U.S. production and elevated inventories
This paper breaks down the key drivers behind the price spike and the market trends that continue to steer Henry Hub futures.
Surging LNG Demand Lifts Henry Hub Futures
The surge in CME Henry Hub futures was driven by strong export demand and record LNG activity. Flows to the eight major U.S. LNG terminals have averaged around 17.8 bcf/d this month, surpassing October’s record (16.7 bcf/d), as global buyers continue to seek U.S. supply.
Source: EIA
According to Reuters (via LSEG data), the U.S. became the first nation to export 10.1 million metric tonnes (mmt) of LNG in a single month in October, up from 9.1 mmt in September.
Europe remained the top destination, taking 6.9 mmt as the region rebuilt inventories ahead of winter and continued to diversify away from Russian gas.
Exports to Asia also climbed, supported by regional growth, energy transition policies, and Taiwan’s phaseout of nuclear power.
The EIA expects U.S. LNG exports to average 14.9 bcf/d this year (25% higher than 2024) and rise another 10% in 2026.
Rising domestic power demand, led by data centres’ soaring electricity use, adds another layer of structural support to gas consumption.
Together, robust export growth and strong power demand create a tighter domestic balance.
Colder Outlook Boosts Natural Gas Sentiment
Colder-than-expected winter forecasts sparked a mid-October rebound in Henry Hub futures as traders unwound shorts after weather models shifted toward stronger heating demand.
NOAA’s 16/Oct seasonal outlook indicated that La Niña conditions are likely to persist through winter, raising the probability of below-average temperatures across northern U.S. states.
These forecasts, while fluid, triggered a repricing of weather risk, with potential production disruptions and pipeline freeze-offs adding to market sensitivity.
The market is now focused on December’s cold risk: near-term demand may soften into Thanksgiving, but structural support and the prospect of a colder December continue to buoy sentiment. Meanwhile, record LNG exports provide a firm floor for Henry Hub prices this winter.
Henry Hub Gained Despite Rising Production and High Storage Levels
Henry Hub prices have continued to surge even as U.S. natural gas production in the Lower 48 states hit a record 109 bcf/d so far in November, up from 107 bcf/d in October. The rise in output typically acts as a bearish factor for prices.
Source: EIA
Over the past six weeks, storage injections have exceeded expectations in five of those weeks.
Source: Investing.com
Additionally, inventories are about 4.2% above the five-year seasonal average (2020–2024).
Source: EIA
While record production and elevated storage levels are weighing on sentiment, strong LNG exports and colder weather forecasts are providing enough support to sustain the recent rally in Henry Hub prices.
Options Skew Signals Caution Now, Optimism Ahead
The front-month November contract shows heavier put positioning, indicating short-term caution.
Source: CME QuikStrike
However, higher call open interest in subsequent contracts suggests that market participants expect Henry Hub prices to strengthen in the months ahead.
Source: CME QuikStrike
Despite the recent price surge, put OI remains concentrated around the USD 3 strike, indicating downside hedging. In contrast, call open interest is higher and more broadly distributed above USD 4.6, suggesting expectations for further upside potential.
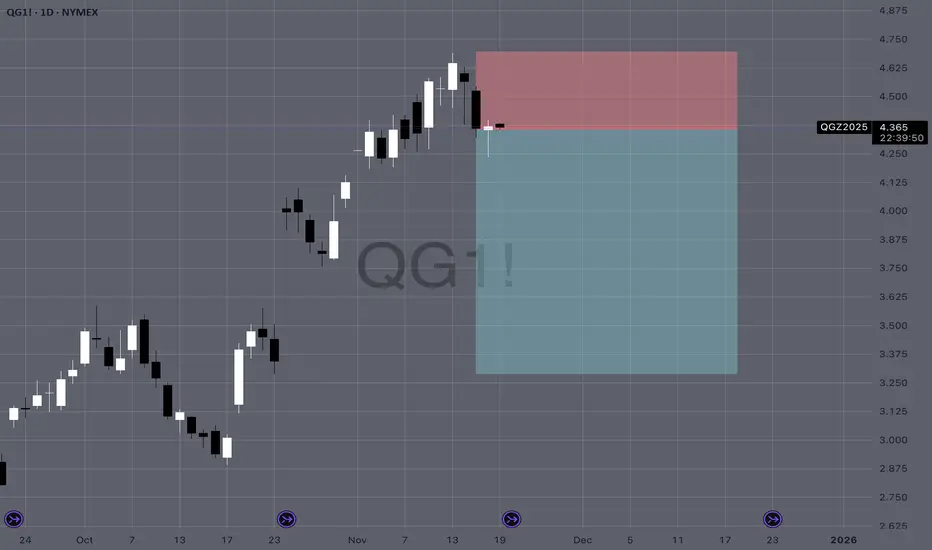
Historical Trade Set-up
Winter-driven heating demand, combined with record U.S. LNG exports, provides a firm seasonal tailwind for Henry Hub prices.
Although natural gas prices tend to firm toward year-end, volatility remains high. For example, the January contract (NGF2025) between mid-November 2024 and the end of December, Henry Hub prices rallied but experienced sharp swings.
In 2023, an outright long in the January contract (NGF2024) ultimately finished at a loss by expiration.
Given the CME Henry Hub futures contract size of 10,000 MMBtu, the gross mark-to-market loss for going long on the NGF2024 contract would have been USD 6,080 per contract between 17/Nov/2023 and 27/Dec/2023:
PnL = (3.227 – 2.619) × 10,000 = USD 6,080
To mitigate volatility and hedge, traders often use calendar spreads. Entering one in mid-November 2023 would have generated a gain even though an outright NGF long had declined.
The gross mark-to-market profit on the NGF2024/NGG2024 calendar spread would have been USD 1,300 per contract.
The spread generated a profit because the later-month NGG2024 contract declined more than the front-month NGF2024 contract. In calendar spreads, gains occur whenever the later month lags the front month—either by falling more or rising less.
For Henry Hub, this typically happens when near-term demand or supply conditions keep the front month relatively firmer, allowing the trade to capture month-to-month price differences with lower overall market exposure.
This content is sponsored.
MARKET DATA
CME Real-time Market Data helps identify trading set-ups and express market views better. If you have futures in your trading portfolio, you can check out on CME Group data plans available that suit your trading needs at tradingview.com/cme .
DISCLAIMER
This case study is for educational purposes only and does not constitute investment recommendations or advice. Nor are they used to promote any specific products, or services.
Trading or investment ideas cited here are for illustration only, as an integral part of a case study to demonstrate the fundamental concepts in risk management or trading under the market scenarios being discussed. Please read the FULL DISCLAIMER the link to which is provided in our profile description.
NattyGurl shortNatural gas is absolutely screaming short right now and here's the setup everyone's missing we just came off a massive shoulder season where demand completely falls off a cliff because nobody needs heating and nobody's cranking air conditioning yet so inventories have been building like crazy and we're sitting way above the five year average for storage levels which puts a ceiling on any rally attempts then you look at the production side and US producers are pumping at near record levels because they were incentivized by those higher prices we saw earlier and now that supply is flooding the market right when we need it least the weather forecasts are showing mild temperatures across most of the country for the next two weeks which kills any weather premium that might've been baked in and let's not forget LNG export capacity isn't growing fast enough to absorb all this excess supply so it's just piling up domestically plus the technical setup is brutal we're seeing lower highs and lower lows forming with momentum indicators rolling over hard and every time natgas tries to bounce it gets sold into because the fundamentals are just too heavy the risk reward here favors the downside in a major way because even if we get a random cold snap or some production hiccup the upside is capped by those bloated inventories while the downside has plenty of room to run toward two dollars or lower if this oversupply situation persists through summer so yeah the trade is pretty obvious here you want to be short natgas and stay short until we see actual demand destruction on the supply side or storage levels start drawing down meaningfully.
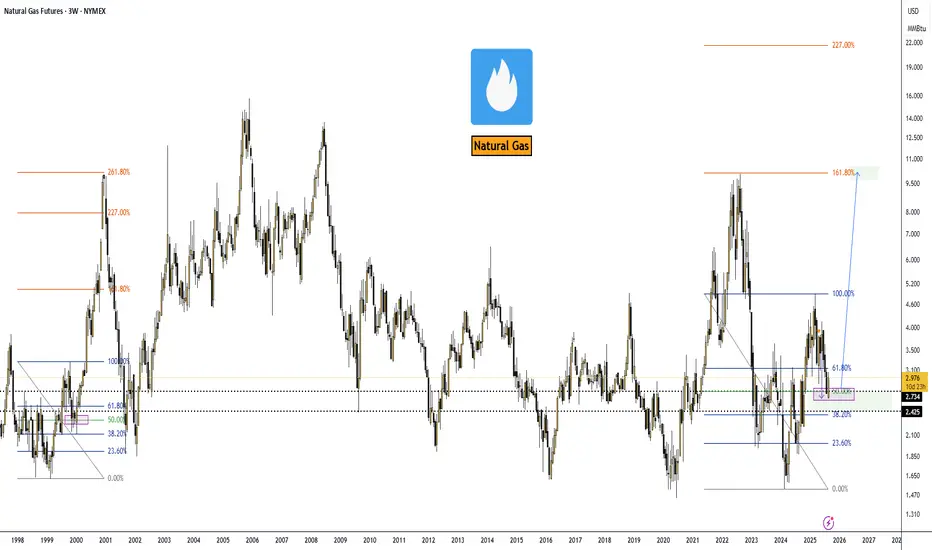
Natural Gas Market Outlook — September 01, 2025.VANTAGE:NG #NaturalGas #NatGas (NYMEX:NG1!) 🔵 Natural Gas Market Outlook — September 01, 2025.
Alright, here’s the skinny on NatGas. Back on April 28, 2025, I was calling for a dip into the $2.74 zone—and guess what? We tagged it right on schedule.
Now the game flips: I’m hunting long entries with the first serious target sitting at $10.00.
Could we overshoot? Absolutely. If momentum really gets cooking, the Fibo 227% extension lines up at roughly $21.00. But let’s not get greedy yet—$10 stays the main milestone for the next big leg.
Macro Drivers
➖ Exports: LNG shipments are the elephant in the room. Europe’s still thirsty, Asia’s paying up, and U.S. cargos are cashing in.
➖ Production: Flat. Shale guys aren’t rushing to flood the market unless we break above $3.20+.
➖ Geopolitics: Russia’s LNG rerouting and Middle East jitters keep a bid under global gas.
➖ Utilities & Consumers: Domestic demand is softer thanks to renewables transitions, but that’s a sideshow compared to export flows.
Big Picture
EIA pegs Henry Hub at $3.60 in 2025 and $4.30 in 2026, but frankly, that’s conservative. With demand from data centers, electrification, and global LNG growth, upside is more likely than not.
Trade View
➡️ I’m treating $2.74 as the cycle low. Any dips near that level look like golden tickets for long positioning into 2026. First pit stop: $10.00. If bulls get rowdy, keep an eye on $21.00 as the stretch target.
➡️ Bottom line: NatGas just gave us the reset we were waiting for. From here, risk/reward favors the long side. Strap in—it’s gonna be a volatile ride, but that’s where the money gets made.
2.89 then 10This channel is not providing individualized trading or investment advice, nor is it a banking service, brokerage service, trading service, investment service or money management service

Gold | Oil | Dollar | Silver | Natural Gas Price ForecastGold | Oil | Dollar | Silver | Natural Gas Price Forecast
NYMEX:NG1! NYMEX:CL1! COMEX:SI1! COMEX:GC1!

NaturalGas Probable price movement
1. price is taking support at parallel.
2. if price sustains here may reach higher levels

A lot happening…Greater uptrend channel still in tact. New downtrend channel in formation but will probably be negated due to the shifting 4 hour timeframe. I think this contract will settle around 4.5 at expiration and the next contract (Jan) will drop like a rock on the switch. I am buying shorts for Jan 4.7 and above. And buying longs for this contract anything below 4.3

Natural gas is poised for a strong rally!If it finds support and holds at this price level, natural gas will continue to rise!
This is beyond doubt.

NATGAS - LONG LONG TERM targetNATGAS - LONG LONG TERM target
This is my evaluation about NatGas for the next week with a long term vision for this winter.
So I think we are in final 5° wave and probably we can break resistence area in 4$ zone

Gold | Oil | Dollar | Silver | Natural Gas Price ForecastGold | Oil | Dollar | Silver | Natural Gas Price Forecast
NYMEX:NG1! NYMEX:CL1! COMEX:SI1! COMEX:GC1!

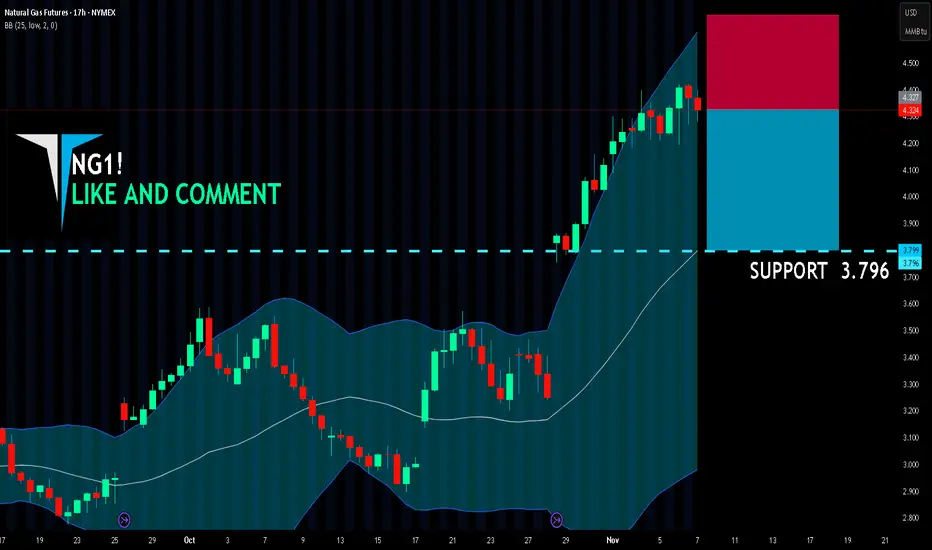
NG1! BEST PLACE TO SELL FROM|SHORT
NG1! SIGNAL
Trade Direction: short
Entry Level: 4.327
Target Level: 3.796
Stop Loss: 4.678
RISK PROFILE
Risk level: medium
Suggested risk: 1%
Timeframe: 17h
Disclosure: I am part of Trade Nation's Influencer program and receive a monthly fee for using their TradingView charts in my analysis.
✅LIKE AND COMMENT MY IDEAS✅
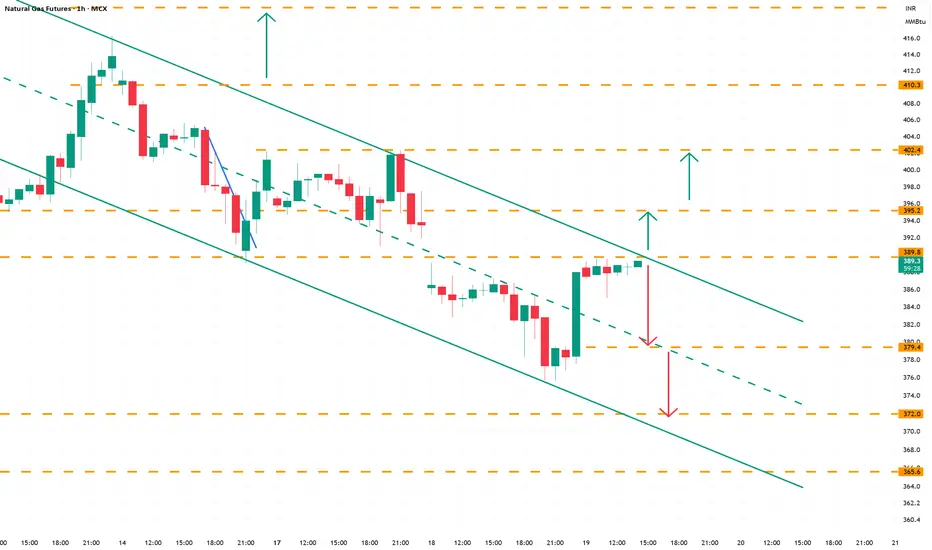
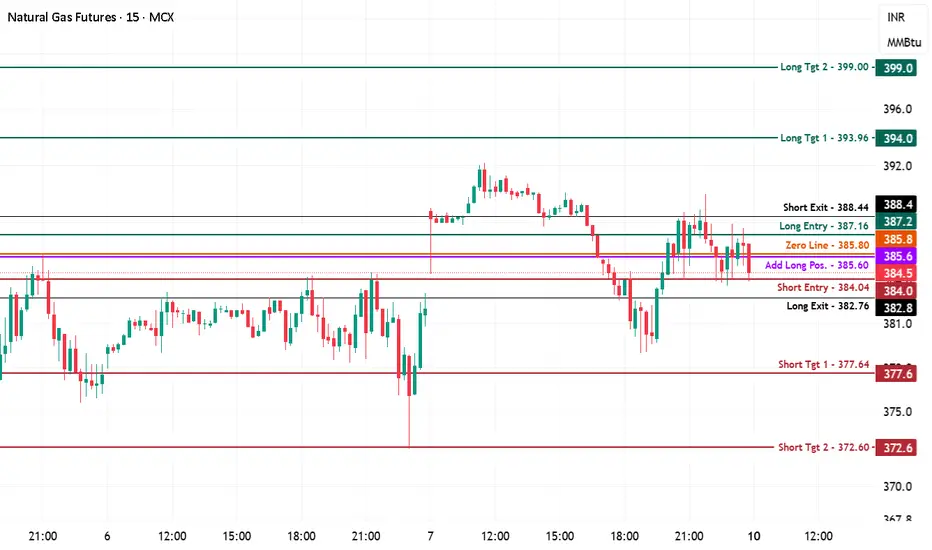
Natural Gas MCX Future - Intraday Technical Analysis - 10 Nov.MCX:NATURALGAS1!
MCX:NaturalGas — Chart Pathik Intraday Insights | 10-Nov-25
(If these levels have worked for you, a quick boost or comment is a small gesture that keeps these posts flowing and the community lively!)
Natural Gas
is pivoting at 380.2, consolidating tightly just below the zero line of 385.8 after a string of false breaks and tight rotations. Every like, comment, or share turbocharges ongoing analysis and keeps the market community sharp!
Bullish Structure:
Long opportunities build above 387.16, momentum confirmed by a solid push through prior day resistance.
Targets: 394.0 (major booking zone), 399.0 (stretch breakout target)
Control: Stops can be set near 385.6 or trailed at the zero line for risk adjustment
Bearish Structure:
Shorts are favored below 384.04, especially on rejection at the add-long (385.6) or if zero line holds as resistance.
Targets: 377.6 (partial/profit), 372.6 (extended move if breakdown takes hold)
Control: Fast reversal above long entry or failed breakdowns should prompt quick covers
Neutral Zone:
385.8 remains the intraday pivot—trade light until market reveals direction.
Consistent setups create method and discipline, so you can act rather than react in this ever-moving market.
If you’re gaining value, engage below—help Chart Pathik reach more traders, and show you’re part of a learning-first community!
NATGAS Set To Grow! BUY!
My dear friends,
Please, find my technical outlook for NATGAS below:
The price is coiling around a solid key level - 4.324
Bias - Bullish
Technical Indicators: Pivot Points Low anticipates a potential price reversal.
Super trend shows a clear buy, giving a perfect indicators' convergence.
Goal - 4.368
Safe Stop Loss - 4.295
About Used Indicators:
The pivot point itself is simply the average of the high, low and closing prices from the previous trading day.
Disclosure: I am part of Trade Nation's Influencer program and receive a monthly fee for using their TradingView charts in my analysis.
———————————
WISH YOU ALL LUCK

A long cyclical play on Natural Gas(NG) on the end of the yearAt the end of the year the demand for Natural Gas(NG) will soar as the temperature enters the winter season. This trade idea has a some degree of risk associated as some contracts are already in play and some reserves are already in place so the full execution of price will probably be lagging to the month of March of the next year.
Natural gas Near expiration, the spread between spots and future is about 1000 pounds, it may goes to ranges between 3.5-3 7. But near target is about 3 95

4 hr timeframe going downAfter 4 hr cross we will be heading back towards $4. If we break above $4.4 that would negate this analysis

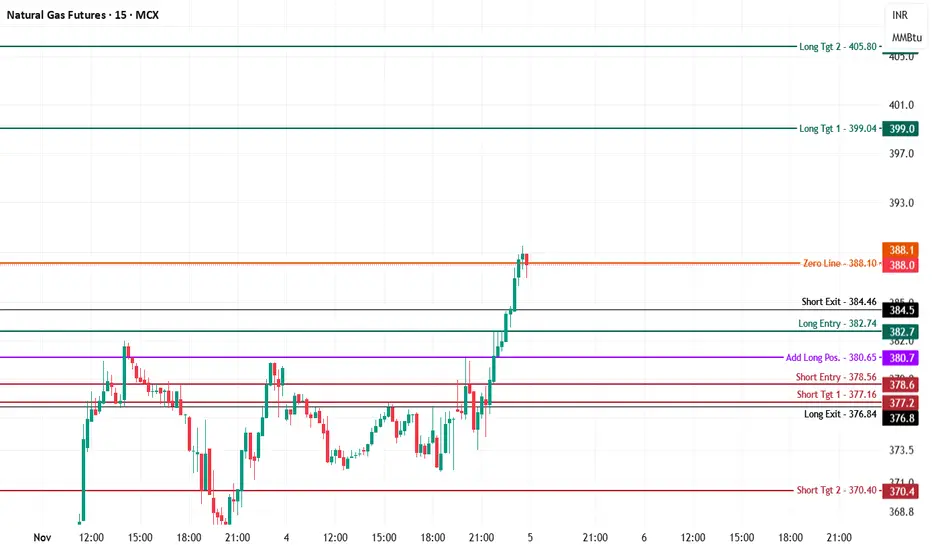
Natural Gas - Intraday Technical Analysis for 5th Nov., 25MCX:NATURALGAS1!
MCX Natural Gas Futures — Chart Pathik Insights | 5-Nov-25
Natural Gas launches into the new session trading at 388.0, now attempting to secure higher ground after a powerful upside rally that pushed price through multiple resistance clusters before meeting supply near the zero line (388.1). Volatility remains primed with the day's breakout highs being tested for strength.
Bullish Structure:
Long bias is active above 382.74, with conviction growing so long as price maintains above the zero line and confirms new footholds in higher levels.
Upside Levels:
399.0: Immediate resistance for booking or fast trades after a continuation move.
405.8: Ambitious stretch target for the most aggressive bulls.
Risk Management: Longs should now be protected by trailing stops near the add-long (380.7) or immediately beneath new swing structures if volatility resumes.
Bearish Structure:
Short opportunities emerge only if price slips below 378.56, reversing the intraday momentum and reclaiming lost support.
Downside Targets:
377.16: First target for counter-trend scalps or defensive shorts.
370.4: Full retracement extension for sustained bear attacks.
Risk Management: Shorts to be covered or reduced if price bounces strongly back above recent swing highs or reclaims 382.74.
Neutral/Turn Risk:
The 388.1 zero line is today's battleground. Expect hesitation and possible chop near this band—position sizing and patience are warranted while price digests the rally.
Use these levels to stay mapped for intraday clarity, balanced risk, and emotionless execution. If Chart Pathik analysis powers your trading edge, boost, comment, and share—community support keeps upgrades coming.
Follow for adaptive logic, battle-tested pivots, and resilient strategy focus in every market scenario.
NATGAS Will Keep Growing! Buy!
Hello,Traders!
NATGAS Price has broken out above the horizontal demand area with strong momentum, confirming bullish order flow. A clean displacement shows potential continuation toward the 4.50$ target zone. Time Frame 5H.
Buy!
Comment and subscribe to help us grow!
Check out other forecasts below too!
Disclosure: I am part of Trade Nation's Influencer program and receive a monthly fee for using their TradingView charts in my analysis.
