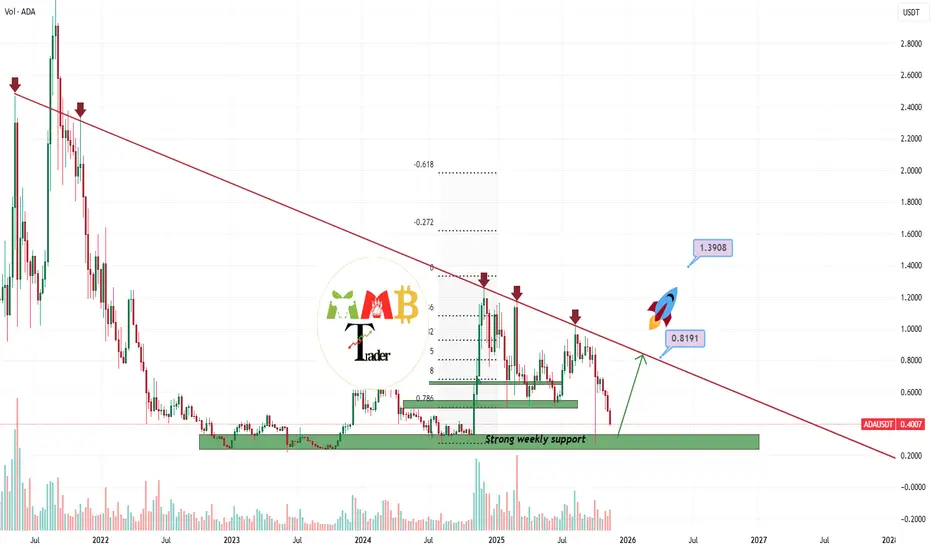
ADAUSDT first target to hit is now +100% (0.80$)ADAUSDT is currently trading within a bearish market structure, experiencing significant downward pressure. However, it's crucial to note that the asset is approaching a major weekly support level. From a technical perspective, the current price zone around $0.40 could present a potential accumulati

ADA - BUY SETUP (NOV 2025)ADA - BUY SETUP (NOV 2025)
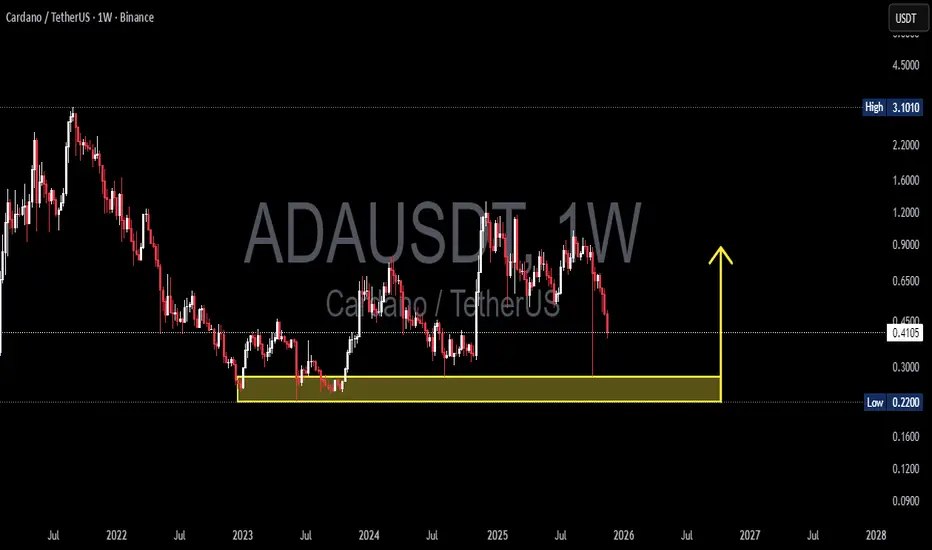
ADA is currently at strong support, making it a solid long-term investment. Hold onto it as it has the potential to reach $3.

ADA/USDT | Cardano Slides to 0.38 and Bears Keep Pushing!By analyzing the CRYPTOCAP:ADA chart on the 3 day timeframe, we can see that price finally dropped to 0.38, which confirms the bearish pressure we talked about earlier. ADA is now trading near 0.40 and the chart still looks weak. Buyers are not showing real strength and momentum is clearly on the

Cardano (ADA) – Weekly Technical Analysis
ADA has been moving inside a large Symmetrical Triangle since the 2021 peak — a long-term consolidation pattern that typically leads to a strong breakout once price compression reaches its end.
When observing the major support line of the triangle, the price has shown a clear repetitive behavior:

LongAccording to the analysis of the waves and the help of the Gann method, it can be expected that the price will return to the green zone again.
This is my personal opinion. Please don't use it as your trading criteria. Good luck

ADA USDT LONG SIGNAL---
📢 Official Trade Signal – ADA/USDT
📈 Position Type: LONG
💰 Entry Price: 0.4134
---
🎯 Take-Profit Targets (Partial Exits):
TP1 = 0.4230
TP2 = 0.4305
TP3 = 0.4370
TP4 = 0.4445
TP5 = —
---
🛑 Stop-Loss: 0.4045
📊 Timeframe: 15m
⚖️ Risk/Reward Ratio: 3.55
💥 Suggested Leverage: 5× – 10×
---

ADA/USDT — Major Reversal or Deep Breakdown?ADA/USDT on the weekly timeframe has returned to one of the most decisive zones since 2022.
The 0.275–0.22 region is not just another support — it is a historical demand and accumulation block where major reversals have repeatedly formed.
This week, ADA once again tapped this zone with a long downs
ADA USDT LONG SIGNAL---
📢 Trade Signal: ADA/USDT
📈 Position Type: Long
💰 Entry Price: 0.4630
---
🎯 Take-Profit Targets (Partial Exits)
TP1: 0.4710
TP2: 0.4765
TP3: 0.4835
TP4: —
TP5: —
TP6: —
---
0.4550
🛑 Stop-Loss: 0.4625
⚖️ Risk/Reward Ratio: 3.91
💥 Suggested Leverage: 5× – 10×
⏱ Timeframe: —
---
🧠 Te


See all ideas
Summarizing what the indicators are suggesting.
Oscillators
Neutral
SellBuy
Strong sellStrong buy
Strong sellSellNeutralBuyStrong buy
Oscillators
Neutral
SellBuy
Strong sellStrong buy
Strong sellSellNeutralBuyStrong buy
Summary
Neutral
SellBuy
Strong sellStrong buy
Strong sellSellNeutralBuyStrong buy
Summary
Neutral
SellBuy
Strong sellStrong buy
Strong sellSellNeutralBuyStrong buy
Summary
Neutral
SellBuy
Strong sellStrong buy
Strong sellSellNeutralBuyStrong buy
Moving Averages
Neutral
SellBuy
Strong sellStrong buy
Strong sellSellNeutralBuyStrong buy
Moving Averages
Neutral
SellBuy
Strong sellStrong buy
Strong sellSellNeutralBuyStrong buy
Displays a symbol's price movements over previous years to identify recurring trends.