Our opinion on the current state of APHAlphamin (APH) is a tin mining and exploration company operating out of Mauritius. Its primary asset is just over 80% of Alphamin Bisie Mining which has a tin mine in the DRC. The company claims that it is the best tin ore body in the world. In a report for the year to 31st December 2022 the company
Alphamin Resources Corp.
No trades
Next report date
—
Report period
—
EPS estimate
—
Revenue estimate
—
0.0937 USD
95.94 M USD
502.64 M USD
599.45 M
About Alphamin Resources Corp.
Sector
Industry
CEO
Maritz B. Smith
Website
Headquarters
Grand Baie
Founded
1981
IPO date
Oct 21, 1982
Identifiers
2
ISIN MU0456S00006
Alphamin Resources Corp. engages in the acquisition, exploration, and development of mineral resource properties. It holds interest in the Bisie Tin project in Democratic Republic of Congo. The company was founded on August 12, 1981 and is headquartered in Grand Baie, Mauritius.
Related stocks

Alphamin Resources C&H and waiting for a brim break to R18.78 Cup and Handle is forming with Alphamin Resources.
We need the price to break above the Brim level before we action this.
21> 7 Price >200 - Mixed
RSI>50 - Bull divergence
Target R18.78
CONCERNS:
Price action shows an unhealthy chart - Volatile candles.
Sideways consolidation for extended period

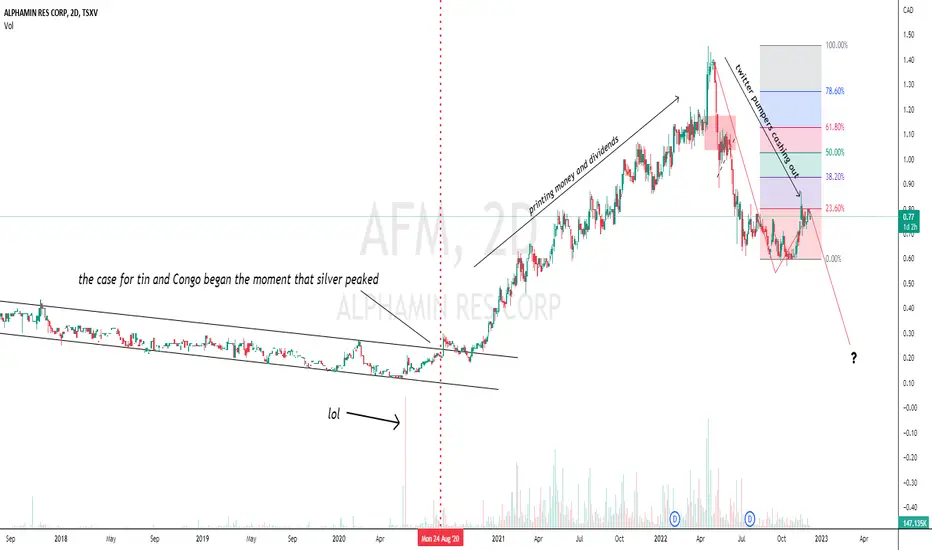
Alphamin: China risk on tradeLower volume than when it made its run (peeking out sometime when tin reached 50k
Cup & Handle maybe forming
50ma crossed the 200 day
tin price gone from 17k-(in the november to 32k as of today) with talk of china re-opening! One of the most profitable mines on earth
youtu.be
When will someone take

APH CautionAlpha Min Tin Mining has rallied on commodities!
See how to trade, but if you did not get the low, be cautious.
Timing the MA is critical entry points.
But I'm just a learner here.
Enjoy the RISK!
Regards Graham.

ALPHAMIN RESOURCES CORPTin at $30000
this company makes $60million at 23k tin
4% of the worlds tin production
Pomised to pay dividend Q1 2022
Negatives its in DRC

See all ideas
Summarizing what the indicators are suggesting.
Oscillators
Neutral
SellBuy
Strong sellStrong buy
Strong sellSellNeutralBuyStrong buy
Oscillators
Neutral
SellBuy
Strong sellStrong buy
Strong sellSellNeutralBuyStrong buy
Summary
Neutral
SellBuy
Strong sellStrong buy
Strong sellSellNeutralBuyStrong buy
Summary
Neutral
SellBuy
Strong sellStrong buy
Strong sellSellNeutralBuyStrong buy
Summary
Neutral
SellBuy
Strong sellStrong buy
Strong sellSellNeutralBuyStrong buy
Moving Averages
Neutral
SellBuy
Strong sellStrong buy
Strong sellSellNeutralBuyStrong buy
Moving Averages
Neutral
SellBuy
Strong sellStrong buy
Strong sellSellNeutralBuyStrong buy
Displays a symbol's price movements over previous years to identify recurring trends.
Frequently Asked Questions
The current price of AFMJF is 0.9400 USD — it has decreased by −4.24% in the past 24 hours. Watch Alphamin Resources Corp. stock price performance more closely on the chart.
Depending on the exchange, the stock ticker may vary. For instance, on OTC exchange Alphamin Resources Corp. stocks are traded under the ticker AFMJF.
AFMJF stock has fallen by −1.47% compared to the previous week, the month change is a 5.63% rise, over the last year Alphamin Resources Corp. has showed a 48.51% increase.
AFMJF reached its all-time high on Feb 11, 2005 with the price of 1.5300 USD, and its all-time low was 0.0600 USD and was reached on Aug 7, 2009. View more price dynamics on AFMJF chart.
See other stocks reaching their highest and lowest prices.
See other stocks reaching their highest and lowest prices.
AFMJF stock is 6.70% volatile and has beta coefficient of 1.05. Track Alphamin Resources Corp. stock price on the chart and check out the list of the most volatile stocks — is Alphamin Resources Corp. there?
Today Alphamin Resources Corp. has the market capitalization of 1.25 B, it has increased by 9.95% over the last week.
Yes, you can track Alphamin Resources Corp. financials in yearly and quarterly reports right on TradingView.
Alphamin Resources Corp. is going to release the next earnings report on Mar 6, 2026. Keep track of upcoming events with our Earnings Calendar.
AFMJF net income for the last quarter is 34.69 M USD, while the quarter before that showed 32.27 M USD of net income which accounts for 7.51% change. Track more Alphamin Resources Corp. financial stats to get the full picture.
Yes, AFMJF dividends are paid monthly. The last dividend per share was 0.03 USD. As of today, Dividend Yield (TTM)% is 8.27%. Tracking Alphamin Resources Corp. dividends might help you take more informed decisions.
Alphamin Resources Corp. dividend yield was 5.61% in 2024, and payout ratio reached 55.45%. The year before the numbers were 6.67% and 120.00% correspondingly. See high-dividend stocks and find more opportunities for your portfolio.
EBITDA measures a company's operating performance, its growth signifies an improvement in the efficiency of a company. Alphamin Resources Corp. EBITDA is 297.58 M USD, and current EBITDA margin is 50.24%. See more stats in Alphamin Resources Corp. financial statements.
Like other stocks, AFMJF shares are traded on stock exchanges, e.g. Nasdaq, Nyse, Euronext, and the easiest way to buy them is through an online stock broker. To do this, you need to open an account and follow a broker's procedures, then start trading. You can trade Alphamin Resources Corp. stock right from TradingView charts — choose your broker and connect to your account.
Investing in stocks requires a comprehensive research: you should carefully study all the available data, e.g. company's financials, related news, and its technical analysis. So Alphamin Resources Corp. technincal analysis shows the sell today, and its 1 week rating is buy. Since market conditions are prone to changes, it's worth looking a bit further into the future — according to the 1 month rating Alphamin Resources Corp. stock shows the buy signal. See more of Alphamin Resources Corp. technicals for a more comprehensive analysis.
If you're still not sure, try looking for inspiration in our curated watchlists.
If you're still not sure, try looking for inspiration in our curated watchlists.