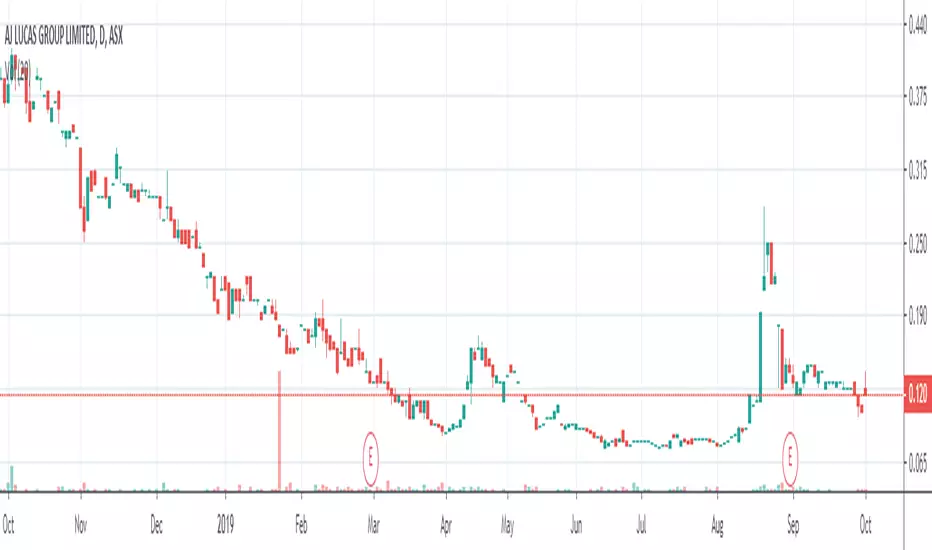
AJ Lucas Loan Note Facility ExtensionAJ Lucas was up by more than 10%, a day after confirming that it has reached an agreement that paves the way for it to amend terms associated with its Loan Note facility. OCP Asia, the debt provider, has agreed to defer the pay-down requirement of a $20 million loan facility to October 25, 2019, fro
Next report date
—
Report period
—
EPS estimate
—
Revenue estimate
—
−0.0072 USD
−9.87 M USD
95.75 M USD
1.38 B
About AJ Lucas Group Limited
Sector
Industry
CEO
Greg Runge
Website
Headquarters
Brisbane
Founded
1993
ISIN
AU000000AJL1
FIGI
BBG000F4LPT4
AJ Lucas Group Ltd. engages in the provision of drilling services. It specializes in engineering design and construction services. The firm operates through: Drilling, and Oil & Gas segments. The Drilling segment provides drilling services to the coal industries for the degasification of coal mines and associated services and commercial extraction of gas. The Oil & Gas segment refers to the commercialization of unconventional and conventional hydrocarbons in the United Kingdom. The company was founded in 1950 and is headquartered in Brisbane, Australia.
Related stocks
Summarizing what the indicators are suggesting.
Oscillators
Neutral
SellBuy
Strong sellStrong buy
Strong sellSellNeutralBuyStrong buy
Oscillators
Neutral
SellBuy
Strong sellStrong buy
Strong sellSellNeutralBuyStrong buy
Summary
Neutral
SellBuy
Strong sellStrong buy
Strong sellSellNeutralBuyStrong buy
Summary
Neutral
SellBuy
Strong sellStrong buy
Strong sellSellNeutralBuyStrong buy
Summary
Neutral
SellBuy
Strong sellStrong buy
Strong sellSellNeutralBuyStrong buy
Moving Averages
Neutral
SellBuy
Strong sellStrong buy
Strong sellSellNeutralBuyStrong buy
Moving Averages
Neutral
SellBuy
Strong sellStrong buy
Strong sellSellNeutralBuyStrong buy
Displays a symbol's price movements over previous years to identify recurring trends.
Frequently Asked Questions
The current price of AJLGF is 0.0080 USD — it has decreased by −2.44% in the past 24 hours. Watch AJ Lucas Group Ltd. stock price performance more closely on the chart.
Depending on the exchange, the stock ticker may vary. For instance, on OTC exchange AJ Lucas Group Ltd. stocks are traded under the ticker AJLGF.
AJLGF stock has fallen by −2.44% compared to the previous week, the month change is a −2.44% fall, over the last year AJ Lucas Group Ltd. has showed a 900.00% increase.
AJLGF reached its all-time high on Feb 29, 2008 with the price of 4.2500 USD, and its all-time low was 0.0005 USD and was reached on Dec 19, 2023. View more price dynamics on AJLGF chart.
See other stocks reaching their highest and lowest prices.
See other stocks reaching their highest and lowest prices.
AJLGF stock is 2.50% volatile and has beta coefficient of 1.92. Track AJ Lucas Group Ltd. stock price on the chart and check out the list of the most volatile stocks — is AJ Lucas Group Ltd. there?
Today AJ Lucas Group Ltd. has the market capitalization of 9.13 M, it has increased by 1.42% over the last week.
Yes, you can track AJ Lucas Group Ltd. financials in yearly and quarterly reports right on TradingView.
AJ Lucas Group Ltd. is going to release the next earnings report on Mar 4, 2026. Keep track of upcoming events with our Earnings Calendar.
AJLGF net income for the last half-year is −2.35 M USD, while the previous report showed −7.08 M USD of net income which accounts for 66.83% change. Track more AJ Lucas Group Ltd. financial stats to get the full picture.
No, AJLGF doesn't pay any dividends to its shareholders. But don't worry, we've prepared a list of high-dividend stocks for you.
As of Dec 8, 2025, the company has 281 employees. See our rating of the largest employees — is AJ Lucas Group Ltd. on this list?
EBITDA measures a company's operating performance, its growth signifies an improvement in the efficiency of a company. AJ Lucas Group Ltd. EBITDA is 11.81 M USD, and current EBITDA margin is 12.33%. See more stats in AJ Lucas Group Ltd. financial statements.
Like other stocks, AJLGF shares are traded on stock exchanges, e.g. Nasdaq, Nyse, Euronext, and the easiest way to buy them is through an online stock broker. To do this, you need to open an account and follow a broker's procedures, then start trading. You can trade AJ Lucas Group Ltd. stock right from TradingView charts — choose your broker and connect to your account.
Investing in stocks requires a comprehensive research: you should carefully study all the available data, e.g. company's financials, related news, and its technical analysis. So AJ Lucas Group Ltd. technincal analysis shows the sell today, and its 1 week rating is sell. Since market conditions are prone to changes, it's worth looking a bit further into the future — according to the 1 month rating AJ Lucas Group Ltd. stock shows the sell signal. See more of AJ Lucas Group Ltd. technicals for a more comprehensive analysis.
If you're still not sure, try looking for inspiration in our curated watchlists.
If you're still not sure, try looking for inspiration in our curated watchlists.