ALGOUSD- UPDATEDespite the decline across the market ALGO is one of the few coins which didn't dump hard, this shows us buyers are holding strong, we can see a wick below the trendline and horizontal support which would of " stop hunted " traders which already entered long with there stops below the structure, now the liquidity has been removed i don't see why a breakout and continuation wont follow, will be watching on lower timeframes for valid entry confirmations.
Trade ideas

Target for ALGO/USDI can see a confluence of fibonacci extension levels 1.618 and 2.618.
The price has bounced of the 1.618 level of the bigger extension and is aiming towards 2.618 following an uptrend (above 200 ema)


Algo is a favoriteAnthony scaramucci ~ "The Future is bright. The more you learn about
@Algorand the more you will realize how big a part of the future it be. Carbon Negative Crypto. "
For some reason this crypto resonates as a whole with me. Fundamentally and technically, from a logical viewpoint.
While Mr BTC or ALTS may actually be entering a bear period for a while, this may not stop ALGO from rising. Remember when the market was down earlier this year and ALGO was rising?
BTC dumping could actually prove another chance for ALGO to break from this irrational correlation. I mean it's not like BTC is the S&P and ALGO is one of it's featured companies. Money outflow from crypto will only be when IR rise.
You can see every dip is bought perfectly on RSI bouncing off the trendline. If we retest 200EMA I will expect another huge buying opportunity, that being said any price sub 2$ resistance is a great entry point if you are thinking 2025 and beyond.
Keep accumulating and staking my friends, even take a small leverage position on FTX if your feeling this ;P
(Disclaimer not financial advice, just rational thought and a little bias)


Algousd Potential price moveMonthly Chart shows Ascending triangle. Current price is in a consolidation phase that will allow price to break out of lower side of rising wedge. after rising wedge is completed we have an ascending upward channel that is expanding on the top side that will allow break out of the ascending triangle.
Expect a massive dip. and then enjoy the ride to new highs.
Possible low if rising wedge lower side break out occurs potential low .70-.80

Algorand (ALGO) in a stable 2 day price wedge and room to growAlgorand (ALGO) in a stable 2 day price wedge and room to grow.
Enough free space to orange or even red resistance on the RSI.
Attention:
The OBV support (green trendline channel) should not break.
😎
Drop me a nice comment if you'd like me to analyze any other cryptocurrency or do another comparison.
*no financial advice
do your own research before investing

ALGO , pinching wedgesee the coiling at the end of the range, looks healthy and ready to move to upside. Market agnostic, play tight to the levels .


Algorand headed downBased on the previous bull cycle trend of BTC and the last local top trends of ALGO, my prediction is that between Dec 10th and 22nd, ALGO will bottom somewhere between $1 and 1.10 - putting it about 60% down from it's ATH (excluding it's single day peak when it was listed on a new exchange)... I have set a buy order at 1.061 (as a form of insurance in case it doesn't go quite as low as I expect). As of today, there is a massive buy wall at $1.50, but I'm not sure how strong that will hold up if a mass sell-off scenario were to occur.
This is mostly a personal chart, but I'd like to share publically to get feedback from others.

algo/usdTesting/tracking elliot wave theory. Please do not trade off idea without S/L. Not financial advice.

$ALGO ALGO appears to have a 3rd test of the 50 RSI (third time’s the charm) on the way as well as the MACD curling up, histogram is lightening. The triangle looks ready to pop and has reached its apex.
Unfortunately, the daily moving averages don’t seem to be giving any signs at least to me, so please point it out if you see something.
Despite this I’m overall bullish on Algorand & can see $5 easily

Bullish Bat Trying To Hold On To Levels of Support Algo is right above support and showing a bullish harmonic here and somewhat of a morning star candlestick reversal it's worth a shot trying to catch a move up to the next resistance zone from here.


ALGOUSD Fibonacci CircleI have drawn up some Fib circle describing a bullish move to a spot that has been a previous trend rejection point (red ovals)
Price comparison points can be drawn between the green ovals
Major trendline in bold white line
The Cup and Handle pattern is an addition that supports the bull idea

ALGO Outlook Looks BullishHave been a big fan of Algorand here lately. Hard to find the channel, it's subject to change. However if it were to stay in this current channel then outlook for the next few years looks promising and a good buy and hold coin.

ALGOUSDThe market has be consolidation for about two month we expecting a break to 4$ before the end of year

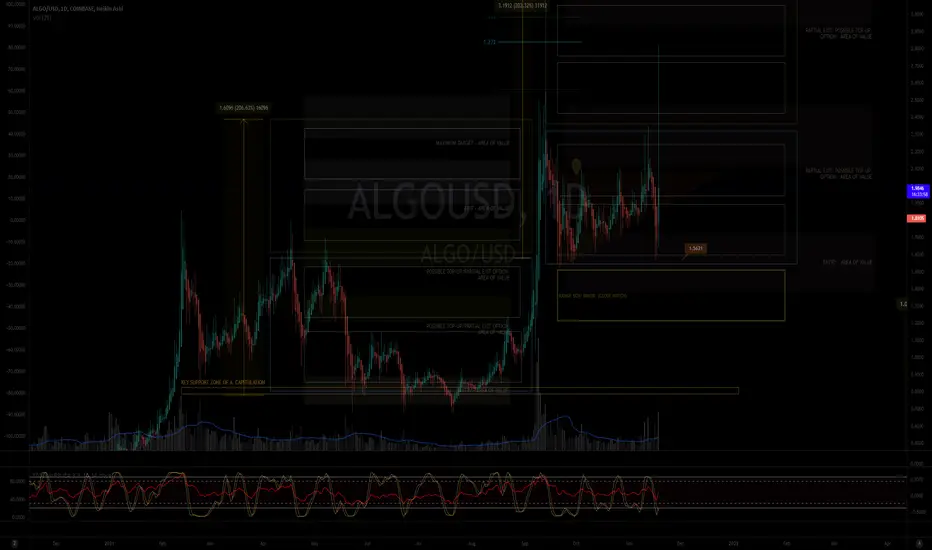
MY MINIMALIST CHART ANALYSIS FOR ALGORAND $ALGO
ON TRACK WITH OUR TARGET AREA OF VALUES
11.18.21
1422H +8 SINGAPORE
Disclaimer:
The findings of the following analysis are the sole opinions of the publisher of this idea and should not be taken as a piece of investment advice.
ALERT:
VITAL SIGN A-OK, WE WILL FINISH THIS SWING.
The Market has amazingly moved along the TOPS and BOTTOMS of our BOXES, signifying TURNING POINTS of PRICE ACTION.
We are now looking at an ENTRY that we can TOP-UP for our Investment FIB 0.618.
Congratulating all those who have climbed the SWING together with me.
REMINDER:
INDICATED ARE ENTRIES, PARTIAL EXITS/TOP-UPS, EXITS, and MAXIMIZED AREAS OF VALUE
"FOLLOW THE WHITE RABBIT!"
Just Follow the TOPS and BOTTOMS of the BOXES as a GUIDE where the MARKET will take you.
HOW TO USE THIS MINIMALIST CHART
Created on a MONTHLY, WEEKLY & DAILY Analysis (The Dynamics of the Market.)
It is designed for SWING TRADES at the BOTTOM. I do not SHORT, though, you can still use it.
You can CLICK AND hold THE CHART and PAN or DRAG IT.
TARGET ZONE IDENTIFICATION
The LARGE BOXES (Tops and Bottoms) are MAJOR pivot points that will occur sometime in the future. While the SMALL BOXES (Tops and Bottoms) are MINOR pivot points.
These can be entries to a BUY/ SELL POSITION, EXIT/PARTIAL EXIT/TOP-UP AREAS,
and, if you wish to hold longer for a MAXIMUM TARGET EXIT AREA OF VALUE - CONSERVATIVE (If price action conditions are right at that given moment.)
At times I include WAY BEYOND PARABOLIC Price TARGETS depending on The Character of the Market (CRYPTOS ONLY).
Watch out for your Volume, Chart Patterns, Candlestick Math, FIB COILS ( ABC ), Price Action, FIB LEVELS, Market Dynamics, especially institutional and retailer trading psychology.
Wishing you all The Best Trades and Thank you all for your Appreciation and Support of My Work.
Much thanks to My 3 Mentors. They are so much of a Blessing that I also wish to Share.
Vive Le Autist!
Vive Le Egalitarianism!
ALGO in and out at 8-10%Juat took a small position, looking for some kind of win today LOL!
8-10% and Im back out / fingers crossed


ALGO rejected 3 times........I get long 10x at 1.85. probably will be liq BUT if it clumb price target will be around 2.25 for 200% profit


Algo is looking very strongAlgo has been above $2 many times recently and is triggered to explode up right now.
This is not financial advice.
