ALGOAlgo entering reaccumulation, final levels before it starts to move. Let's see if this level holds. Algo is following structure well. Once the market picks back up we should know better with the overall look. I see 2.80 as a near term target
Trade ideas

ALGOAlgo entering reaccumulation, final levels before it starts to move. Let's see if this level holds. Algo is following structure well. Once the market picks back up we should know better with the overall look. I see 2.80 as a near term target

ALGO POP SOON. Impending Breakouts EVERYWHERE in Crypto. Just another trade I am taking in ALGO. Pennant flag breakout with rising MACD and MAC above ZERO line. Price has retraced to support and appears to want o breakout higher soon. RISK 1% on trade.
Entry = $1.87475
SL = $1.69454
TP = $3.48
R = 8.88

ALGORAND LONGAlgorand is a blockchain Pure Proof of Stake based.
Entry price: 1.519
Take profit_1: 2.061
Take profit_2: 2.531
Stop loss: 1.138
Position: LONG
The RSI indicator is into oversold area.

ALGO STANDS STRONGAlgorand was showing the strongest type of structure prior to the sell-off in crypto throughout todays Asian-Session.
Considering this neutral pennant has held, and that price does not fall below 1st support at 1.70 USD then ALGO looks clear to re-test the top of the wedge around 2.30USD, 2nd Resistance.
Bitcoin must hold above 60K USD for this trade idea to stay valid, should BTC/USD fail to do so then new lows are inbound on ALGO around 1.55USD
1ST SUPPORT: 1.70 USD
2ND SUPPORT: 1.55 USD
1ST RESISTANCE 2.00 USD
2ND RESISTANCE 2.30 USD
“Any opinions, news, research, analyses, prices, other information, or links to third-party sites contained on this website are provided on an "as-is" basis, are intended only to be informative, is not an advice nor a recommendation, nor research, or a record of our trading prices, or an offer of, or solicitation for a transaction in any financial instrument and thus should not be treated as such. The information provided does not involve any specific investment objectives, financial situation and needs of any specific person who may receive it. Please be aware, that past performance is not a reliable indicator of future performance and/or results. Past Performance or Forward-looking scenarios based upon the reasonable beliefs of the third-party provider are not a guarantee of future performance. Actual results may differ materially from those anticipated in forward-looking or past performance statements. easyMarkets makes no representation or warranty and assumes no liability as to the accuracy or completeness of the information provided, nor any loss arising from any investment based on a recommendation, forecast or any information supplied by any third-party."

Long Term ALGO TargetsLooking for new highs to ~$#.25-3.30
Good change to retest former resistance around 1.75 prior to blast off

Algorand (ALGO) - November 15Hello?
Welcome, traders.
By "following", you can always get new information quickly.
Please also click "Like".
Have a nice day.
-------------------------------------
(ALGOUSD 1W Chart) - Mid-Long-Term Perspective
Above 0.76754798 point: uptrend expected to continue
(1D chart)
First resistance section: near point 2.30117362
Second resistance section: 2.84473154-3.02591751
Support section: 1.57642973-1.75761570
We need to see if we can sustain the price above the 1.90329264-1.97455023 segment.
If it goes down, you should check to see if you find support in the support zone.
If the price holds above the 1.90329264-1.97455023 range, I would expect a move to move above the first resistance level.
------------------------------------------
(ALGOBTC 1W chart)
4309 Satoshi-6469 Satoshi section or more: Expected to create a new wave.
Above the 2886 Satoshi point: Expected to turn to an uptrend.
Currently, it is forming a box section below the 4309 Satoshi point and walking sideways.
------------------------------------------
We recommend that you trade with your average unit price.
This is because, if the price is below your average unit price, whether it is in an uptrend or in a downtrend, there is a high possibility that you will not be able to get a big profit due to the psychological burden.
The center of all trading starts with the average unit price at which you start trading.
If you ignore this, you may be trading in the wrong direction.
Therefore, it is important to find a way to lower the average unit price and adjust the proportion of the investment, ultimately allowing the funds corresponding to the profits to regenerate themselves.
------------------------------------------------------------ -----------------------------------------------------
** All indicators are lagging indicators.
Therefore, it is important to be aware that the indicator moves accordingly with the movement of price and volume.
However, for the sake of convenience, we are talking in reverse for the interpretation of the indicator.
** The MRHAB-O and MRHAB-B indicators used in the chart are indicators of our channel that have not yet been released.
(Since it is not publicly available, you can use this chart without any restrictions by sharing this chart and copying and pasting the indicators.)
** The wRSI_SR indicator is an indicator created by adding settings and options to the existing Stochastic RSI indicator.
Therefore, the interpretation is the same as the traditional Stochastic RSI indicator. (K, D line -> R, S line)
** The OBV indicator was re-created by applying the formula to the DepthHouse Trading indicator, an indicator disclosed by oh92. (Thanks for this.)
** Support or resistance is based on the closing price of the 1D chart.
** All descriptions are for reference only and do not guarantee a profit or loss in investment.
(Short-term Stop Loss can be said to be a point where profit and loss can be preserved or additional entry can be made through split trading. It is a short-term investment perspective.)
---------------------------------

ALGOUSD - updateMost likely price is still in the wave B. As such, it will test the prior high, and make a harsh move down in the wave C to complete a large flat.
It will be a huge daily corrective pattern before the next bull run.

$ALGO could test previous ATHIf it does test the ATH it may not break through it on the first try, it will probably be the second unless it comes in with incredible volume and velocity. If it doesn't break out it could break down to the 1.87 level, the lower bound of the pennant/triangle.
My money's on Algorand breaking out and flipping ADA then ETH.

ALGOUSD Day Trade Long KRAKEN:ALGOUSD
4 hour timeframe bearish trend consolidation, looking for a bounce up to fib 38 for a quick day trade.


ALGO with symmetrical triangle breakoutALGO with a symmetrical triangle breakout. I decided to mix it up and include some Elliot wave theory. It looks like the first impulse is over but the second impulse is just beginning. Mind you if it had the same market cap as ADA it'd be at $10.80 (at the time of this post)
Looks like we could be heading to the high 3's and maybe even break into the low 4's with Algorand.
*HYPOTHETICAL* Just want to see how it turns out when you combine wave theory with traditional TA, like h&s or triangles.
No bs, I am the most bullish out of every crypto out there. even bitcoin

ALGO | Close above 2.05 B U L L I S H ! ! ! Looking for this daily candle to close above the 2.05 for a retracement back tot he 2.05 area or 2.05 region. Short term higher lows for confirmation to long. Price hasn't closed above 2.05 since September 19th.
What are you seeing ? ? ?

ALGO going for ATH??If ALGO finally breaks its resistance at $2.26 we are probably going to see ALGO at its ATH again. But if it gets rejected again we're going to have a triple top and in result of that ALGO will fall to about $1.90 or below. Just keep an eye on ALGO!!!!!

Algorand is promising to touch 8 for next one monthAlgorand is promising to touch 8 for next one month

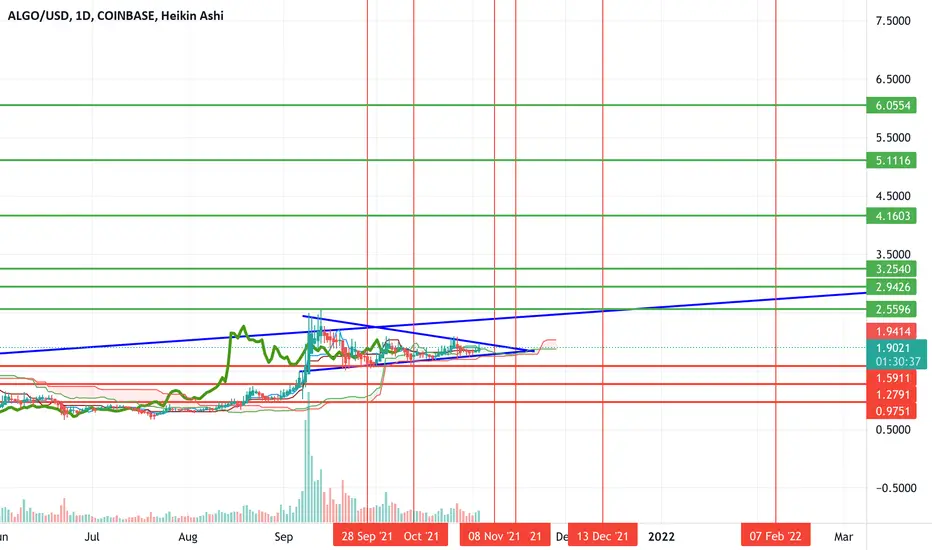
$ALGO targets $6 over the LT but w/ ST potential downside riskI think the next time we touch the blue trend line running through the middle of the chart, it should break. Which would give $algo great upside to the higher green targets w/ a potential of $6 as the final target. The key level to break on the upside is $2.56 (ATH) which would provide a path for continuation upwards.
However, the question is, what is the path to get there? I don't think the trade is as simple as it looks from the chart at the moment.
While there appears to be a flag that has formed on the chart, and the indicators are looking good, I think BTC could potentially take Algo down with it, if it were to fall.
I think the most likely scenario from here is that we break down from the flag (or break up and roll over) and find support at $.96-1.23 before the uptrend resumes. Reason being, that I'd have a hard time seeing Algo running straight up without retesting those lows first.
Let's see how it plays out. I added some key dates on the chart for changes in price action to watch.
AlgoBeen stocking up! look for entry if it retests previous levels. Algo is a great project. Follow me for more winning charts!

ALGORAND BREAKING OUT! Another resistance level breaking. In the words of @CryptoTrading_KenStandfield - the Altcoins are being pulled by Bitcoin's gravity.
I am seeing so many ALTS breaking out!
Target 1: $2.40
Target 2: $2.60 - $2.70
Come on the Alts!
Boom,
theRaggy

ALGO could be headed to $3Algorand crypto, symbol $ALGO, has a nice ascending triangle breakout on the daily timeframe (assuming prices hold as of this time). My target for this is around $3 USD. Volume looks good so far.
This is not financial advice, do your own research.


Algorand Elliott wave projection updateAnalysis based on Elliott wave projection and it is an update to an old idea
Black line is for exiting your position gradually

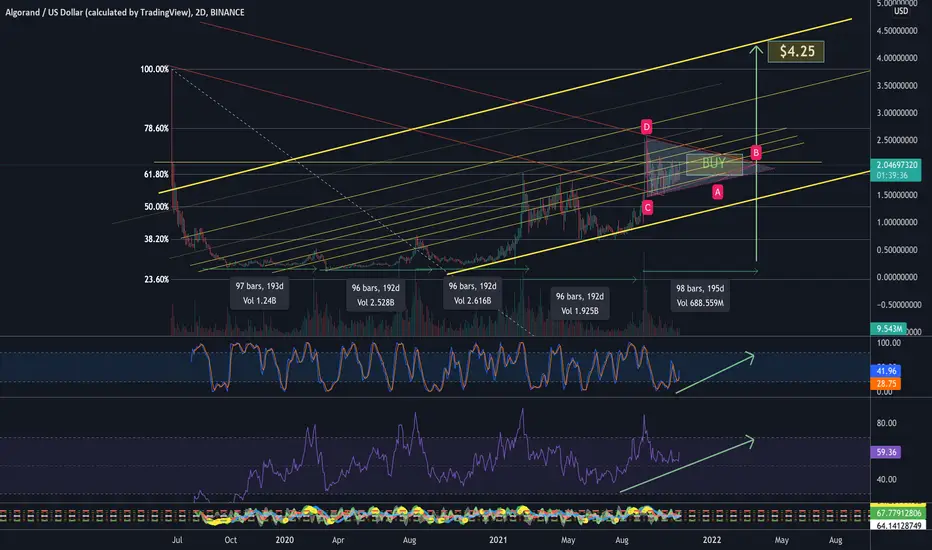
ALGO +100% by March 2022 $4.25We can see in this technical analisys that ALGO is repeating its moves every 192 days.
This would be the 5th time it is repating this.
So, what is this chart telling us?
You could see, on my previous update y that the flag was perfectly executed on the preditid time. We can see now that besides ALGO jumped 15% these past days it is in accumulation proccess, and those are just sign of strength. Collect gold nuggets!
There is not point to have your money sleeping there during the rest of the accumulation proccess or flag formation. You can use it for other projects in between, unless you decide to buy and leave it as a investment.
As a trader I would recommend you to buy at the next dip or just at the resistance level before the break out. This could be even at $2.20. You would still double your money in a short period of time.
There is a big fight between protocols since ETH sky rocketted. Every one is looking for the new "cheap" aquivalent ETH projects. Money is going to SOL, AVAX, ALGO, and many others.
DeFis are stuck at due to this fight and last month BTC dominance.
Despite all of this, news and toke updates..., charts talk by themselves.
I timed ALGO as you can see in the chart. 5 consecutive periods of aprox 192 days.
I hope this help you the get richer.
Apprecite the hard work by pressing like and feel happy to follow for updates.
Happy trading,
Raf
ALGO doing the move ?
ALGO seem to be breaking out of his triangle but i would stay cautious as long as we don't have a daily above 2.05$.
If it does close above then the plan would be to buy any retest of 1.95$ and target 2.5$ as 1st TP which would be what i would play since MACD daily is turning bullish.
If it close under then we would need to rethink the upper trendline of the pattern perhaps and exclude the price action of 10 to 12th september which is missleading.
Ideally we want a daily close at 2.1$ so both trendline would become potential support combine with the current resistance area 1.95$/2.05$
Let's see how this will play out
