NVDA Sitting on Critical Demand — Bounce or Breakdown? (Nov 19)NVDA has been sliding straight down inside a clean descending channel, and now price is pressing right into the major daily demand zone around 176–184. This is the same zone that saved NVDA back in September and October.
Tomorrow (Nov 19) will be all about whether buyers finally show up — or if this demand gets taken out and the next leg down begins.
📌 NVDA — Daily Structure (1D)
NVDA is sitting right on top of the rising macro trendline. This structure has held for months, so this is a real decision point.
Key levels:
* 184–186 → top of demand
* 176–178 → deeper sweep
* 164 → next liquidity if demand breaks
As of now, price hasn’t reacted strongly. It’s still controlled selling. This zone is the “make or break” for NVDA’s trend.
📌 NVDA — Intraday Trend (1H)
Your 1H chart is clean: lower highs, lower lows, and perfect trendline respect.
Short-term zones for tomorrow:
Resistance:
* 184–186 → first lid
* 190–192 → major lid + trendline rejection zone
Support:
* 177.5 → HVL + GEX support
* 175–176 → liquidity sweep
* 170 → next magnet if selling accelerates
Unless NVDA clears 186, the intraday trend stays bearish.
📌 NVDA — GEX Roadmap for Nov 19
This is the key layer for tomorrow’s behavior.
CALL Walls / Resistance
* 192 → primary wall
* 195 → secondary
* 200–207 → high resistance cluster
PUT Support / Downside Risk
* 178 → strongest support
* 175 → heavy put wall
* 170 → could magnetize if pressure increases
NVDA is literally sitting on the 178 region at the close.
📈 Bullish Scenario (Bounce)
NVDA must hold 177–180 early in the session.
If buyers defend demand:
1. Break above 184–186
2. Push into 190–192
3. Break 192 → momentum can extend toward 195 → 200
But no reclaim = no upside.
📉 Bearish Scenario (Continuation)
If NVDA opens weak or rejects 184–186 again:
1. First target → 177.5
2. Lose 177 → 175
3. Lose 175 → vacuum into 170
Structure stays bearish as long as we remain below 186.
🔎 My Outlook for Nov 19
NVDA is sitting on strong demand, but there’s still no real bounce.
GEX bias is neutral → leaning bearish unless we break above 186.
Bias:
* Neutral → Bearish below 186
* Bullish only above 190
Watch 186 early — that level decides everything.
📌 Summary
* Daily demand: 176–184
* Intraday trend: Bearish
* GEX support: 178 → 175
* Resistance above: 186 → 190 → 192
* Bearish continuation below 180
* Bullish only if NVDA reclaims 186 → 190
⚠️ Disclaimer
This analysis is for educational purposes only. Not financial advice. Always trade your own plan and manage risk carefully.
NVIDIA Corporation Shs Cert Deposito Arg Repr 0.04166667 Sh
No trades
Market insights

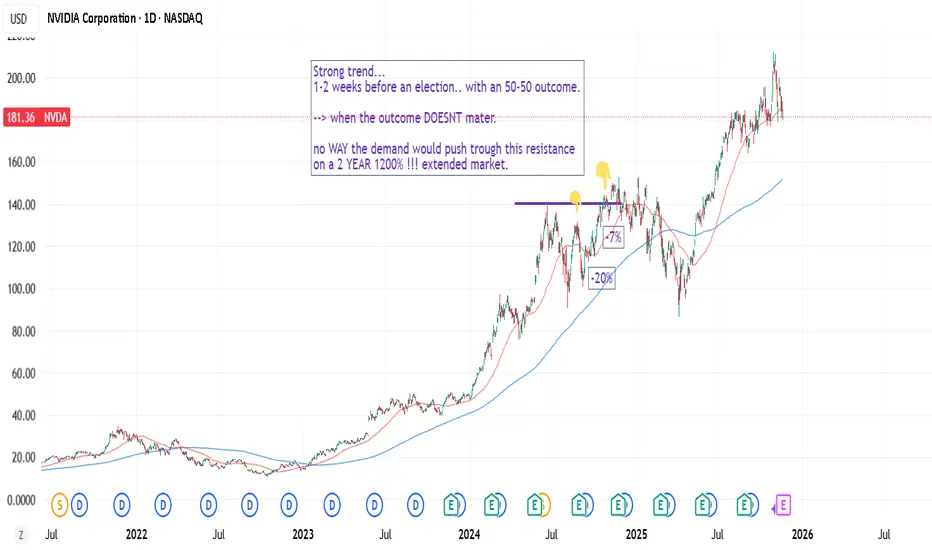
Markets are predictable. Trading S/D imbalances.Pre-election. 1200% extension after a 2-year rally. Facing ATH with strong trend and expectations.
This is a rule or factorial based approach. What most people think - is usually how most people are positioned, or usually also is the logical truth.
When something extends... and some risks emerge -- you can't really trust charts (ie demand strength). that's a prejudgement? ie sloppy way to look at things.
Also somewhat predictable is the 2 year rally, 3rd year weakness. If markets stall -- markets sells off on expectations of that "rule" lol
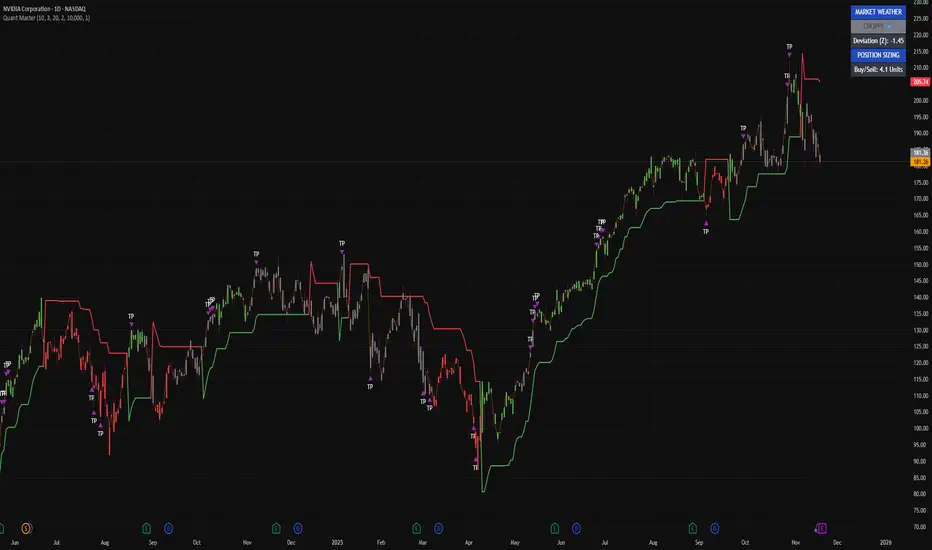
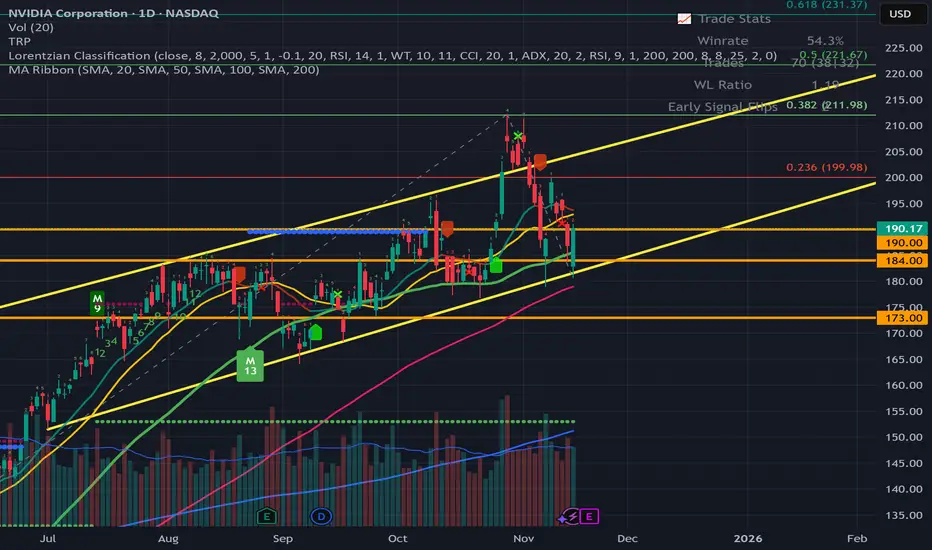
I’m reading NVIDIA through pure structureThis is NVDA on the 1-day with my Quant Master Trend System, and right now the message is simple: we’ve transitioned from impulse to instability.
The ribbon is still red from the recent flip, and every candle since that flip has respected the stop level. That’s the part most people miss — when the ribbon turns red while Market Weather is CHOPPY, it means the trend engine isn’t aligned. There’s pressure, but not clean momentum.
That’s exactly what you’re seeing here.
NVDA topped, printed a string of TP clusters during distribution, and then lost its green momentum base. Once that base broke, it instantly acted as resistance — a classic behavior in this model. The current deviation reading at Z ≈ -1.45 confirms price is stretched, but not in capitulation. This is structural unwind, not panic selling.
Look back at the last time NVDA printed this signature:
Green ribbon → long rally → heavy TP clustering → red flip → CHOPPY weather → multi-week digestion phase.
The system is showing the same rhythm right now.
So here’s how I see it:
The uptrend is no longer intact.
Momentum has shifted from expansion to dispersion.
Market Weather says don’t trust breakouts, don’t trust dips.
The clean trend is gone — this is recalibration.
And until NVDA builds a fresh green momentum base and holds above it, I’m treating every bounce inside red conditions as a continuation of the unwind.
NVDA Earnings Breakout Setup — QuantSignals V3 | Bullish CallNVDA QuantSignals V3 Earnings 2025-11-18
Instrument: NVDA
Date: 2025-11-18
Signal Type: Earnings (Pre-Earnings Position)
Model: QuantSignals V3
Direction: Calls
Confidence: 65%
Conviction: Medium
Earnings Date: 2025-11-19
Earnings Estimate: $1.27
Expiry: 2025-11-21
Options Setup
Strike Focus: $185.00
Entry Range: $6.45 – $6.55
Implied Move: $14.15 (7.7%)
Profit Target: $13.00
Stop Loss: $3.25
IV: 106.5% (elevated due to earnings)
PCR (Flow Intel): 0.37 (bullish)
24h Move: –1.91%
Price & Technicals
Current Price: $183.79
Katy Prediction Target: $184.60 (+0.44%)
Trend Classification: Neutral (50% confidence)
RSI: 31.3 (near oversold)
MACD: +2.17
Momentum (ROC): –7.42%
Support: $179.65
Resistance: $187.55
AI Forecast (Katy Model)
• Time-series predicts steady upward movement
• Range projection: $183.79 → $184.80 (+0.55%)
• Confidence moderate, trajectory shows bullish bias despite neutral label
Fundamental & News Notes
• Strong historical earnings performance (100% beat rate)
• Mixed news sentiment but leaning optimistic
• Nvidia positioned as key market driver for earnings week
• Pre-earnings selling pressure suggests potential reversal
Risk Notes
• Moderate risk due to high implied volatility
• Earnings event introduces binary outcome
• Premiums elevated; smaller sizing recommended
• Monitoring pre-market on 11/19 essential
NVDA: 1 week before earnings effect. Supply-demand imbalance.Parretto principle (20-80): small important things can have great influence in grand scheme of things. Some events have greater weight, than say 80-90% of daily events.
Stocks move based on Supply-demand dynamics (disbalance etc), patterns or trends are just a feedback.
The problem with using charts as a feedback for strength (or feedback for S-D strength) is that: (1) on a expensive market, with extended prices (with high supply too), (2) during important NVDA earnings, it's almost predictable how markets would sink, or at least be volatile.
Demand stalls. Supply gets worried. Price down.
//People are risk averse. Hence.. predictable.

NVDA HAGIA SOPHIA!The Hagia Sophia pattern has now fully formed; it just needs the crack! and the Hook!
No matter what your vague hunches and feelings are about AI, the charts will always win.
You can't "buy the dip" unless you know when to "Sell the Rip"!
If you can't see this resistance area, I don't know what to tell you.
Everyone is bullish at the top of a bubbliotious market without exception!
Click boost, Like, Subscribe! Let's get to 5,000 followers. ))
NVDA Earnings Setup – Massive Opportunity AheadNVIDIA NASDAQ:NVDA has surged +48% since our last analysis, continuing to lead the AI rally with exceptional momentum. Now, all eyes are on earnings—and the setup is massive. The options market is pricing in a ±7.5% implied move, which could mean a $345B shift in market cap. That’s one of the biggest potential earnings moves in history.
🔥 Key Catalysts:
Strong institutional buying
AI/data center demand in focus
Sky-high expectations priced in
💡 Trade Setup:
Entry: $180–$182
Take Profit Targets: $200 / $210
Stop Loss: $174
This is a high-volatility event. Manage risk accordingly and size positions carefully.

NVIDIA – Limited Correction or Sentiment Change?There is no getting away from it, NVIDIA’s earnings, which are due on Wednesday after the close are making traders nervous. The problem with being the largest company in the world by market capitalisation (approx.$4.53 trillion) with a roughly 7.5% weighting in the S&P 500 and closer to 10% weighting in the Nasdaq 100 is that everything related to your company matters, especially when you are seen as the global AI benchmark at a time when traders are wondering if lofty valuations given to the leading companies in the space are justified or not.
Suddenly, stories like Softbank selling its entire NVIDIA stake of $5.8 billion last week, gets more headline space in the financial press and now your Q3 earnings are potentially being seen as important to the direction of market sentiment and risk appetite as whether the Federal Reserve decides to cut interest rates again at its final meeting of the year on December 10th.
The earnings, when they are released are anticipated to be strong, with Reuters reporting analysts expecting an average 54% year on year rise on Q3 earnings per share. However, while traders may be judging the actual results against market expectations, they may also be keen to hear the updates from CEO Jensen Huang regarding future revenue and chips sales moving forward.
With the potential for extra volatility in NVIDIA’s share price across the next 48 hours being apprised of the technical backdrop could be important.
Technical Update: Limited Correction or Sentiment Shift?
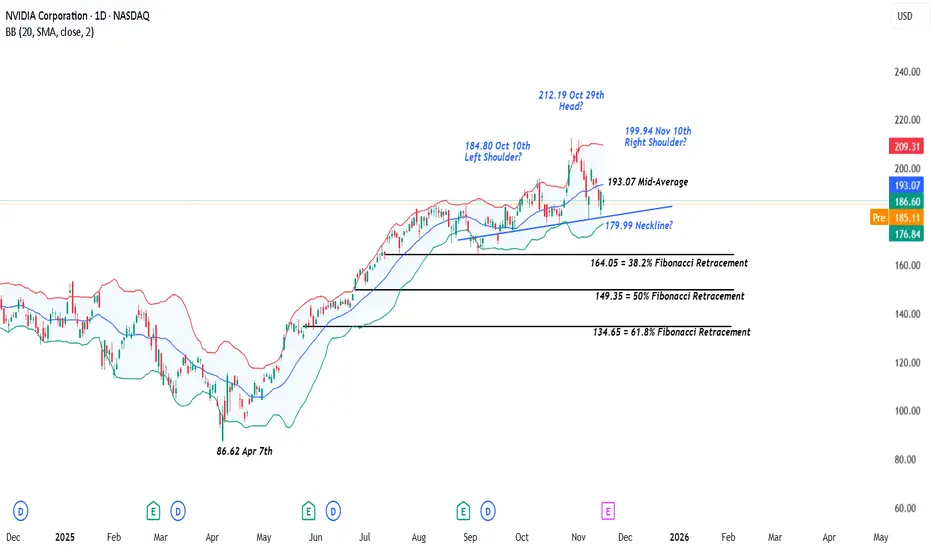
It has been a choppy period for the Nvidia share price since mid-September 2025, activity that has seen 3 distinct highs in price posted. As the chart below shows, these stand at 184.80 on October 10th, 212.19 from October 29th and 199.94, scored on November 10th.
As you can also see on the chart, the 2nd of these 3 peaks at 212.19, is higher than the other 2, which is important from a technical perspective. This may lead some analysts to suggest this activity could be forming a potential Head and Shoulders top pattern.
It is important to stress that a Head and Shoulders pattern must be completed by a close below the ‘neckline’ or the trend connecting recent price lows, which in the case of Nvidia currently stands at 179.99.
Even then, completion of such a pattern isn’t a guarantee of a sentiment shift, but as we approach Nvidia earnings on Wednesday, risks may turn towards increased price volatility, and being aware of potentially relevant support and resistance levels may prove useful.
[bWhat if Closes Below 179.99 Support are Seen?:
Having seen recent price weakness held and reversed to the upside by the uptrend currently standing at 179.99, this could now be viewed as the first support focus. However, with it also possibly being the neckline of a potential Head and Shoulders pattern, it may prove to be pivotal moving forward.
While there is no guarantee closes that below the support at 179.99 may lead to a further phase of price weakness, it might skew risks towards continued declines. Focus may then turn towards 164.05, a level equal to the 38.2% retracement level of April to October strength, possibly even towards 149.35, which is the 50% retracement.
What if 179.99 Support Remains Intact?:
As already said, any Head and Shoulders pattern must see closes below neckline support to suggest a completion and risks for further price declines. For Nvidia the 179.99 support is still intact on a closing basis, and it could be argued this is not yet a valid reversal pattern.
As such, while the 179.99 level holds, traders may view recent price declines as a limited correction within what could still be classed as an uptrend in price.
However, if a further phase of price strength is to materialise, traders may require closes back above the still rising Bollinger mid-average currently at 193.07. Such moves if seen, could then lead to tests of 199.94 the November 10th high, even on towards 212.19, the October 29th extreme.
The material provided here has not been prepared accordance with legal requirements designed to promote the independence of investment research and as such is considered to be a marketing communication. Whilst it is not subject to any prohibition on dealing ahead of the dissemination of investment research, we will not seek to take any advantage before providing it to our clients.
Pepperstone doesn’t represent that the material provided here is accurate, current or complete, and therefore shouldn’t be relied upon as such. The information, whether from a third party or not, isn’t to be considered as a recommendation; or an offer to buy or sell; or the solicitation of an offer to buy or sell any security, financial product or instrument; or to participate in any particular trading strategy. It does not take into account readers’ financial situation or investment objectives. We advise any readers of this content to seek their own advice. Without the approval of Pepperstone, reproduction or redistribution of this information isn’t permitted.
Nvidia (NVDA) Price Action Statistics Around EarningsWith Nvidia set to release earnings after the US close on Wednesday, I take a look at recent price action around past reports, the Nvidia chart and the Nasdaq.
Matt Simpson, Market Analyst at City Index.

NVDIA - Earnings Setup for This WeekHello Everyone , Followers,
NVDIA will release its financial reports on Wednesday after market closed. I would like to share my view and follow up level depends on good and bad reports
Bullish Scenario
If earnings beat + guidance strong → next target: 221 - 222
Bearish Scenario
Weak numbers → potential drop to between 173.00 - 176.00
🔹 Key Support Zones
First support: 184.00
Deeper support: 173.00
🔹 Resistance Levels
Main resistance: 199.00 - 200.00
Breakout target: 221 - 222
🔹 Outlook
As long as It stays above 190.00 , momentum remains bullish.
A breakdown below that level could open the door for a deeper pullback. This is depends on Results of financial reports.
🔹 My Plan
I will wait for the financial report before i buy it . With a bearish scenario my buy level is between 176-173 then probably i will hold it for next 5 years.
If it can achive to stay above 190 and if you like to take a risk then you can buy it above this level .
If you enjoy and like clean, simple analysis — follow me for more.
Have a lovelly and Sunny Weekend to all.
NVDA QuantSignals V3 — Katy Flags Subtle Reversal MoveNVDA (QuantSignals V3)
Market Structure:
NVDA is showing neutral-to-weak momentum with price hovering near short-term resistance at $189–190. Buyers are losing strength, and the tape shows lower high formations, signaling potential exhaustion.
Trend Outlook:
The Katy 1M model flags soft downside pressure. Despite the neutral trend reading, intraday structure leans toward a controlled pullback, supported by moderate volatility (16.5%).
Order Flow Insight:
Momentum flow appears to be slowing, with reduced upward volume. The micro-trend suggests fade-the-rip behavior—small rallies may get sold into.
Key Levels:
Resistance: $189.40 / $191.70
Support: $188.00 / $186.80
Short Trigger Zone: $188.50–$189.00
Vision Summary:
NVDA shows lower momentum, weak buyer conviction, and a short-biased micro-shift. Best setup aligns with a tight short scalp targeting the next liquidity pocket below $188.00.
NVDA earnings thsi week - will that be catalyst for a move?Its been another few months of great bullish moves on NVDA, however the last couple of weeks have been choppy. We rejected the $200 level and now find ourselves sat above $180 and the Weekly 20MA.
If the numbers are good then I'm sure the giddiness will take us higher. If the numbers are poor the you have to ask will $180 and the Weekly 20MA act as support, or will they collapse? If they do, what will happen to tech and US markets in general? It means that its going to be an interesting week!

Ahead of Nvidia’s (NVDA) Earnings: How the Price Could MoveAhead of Nvidia’s (NVDA) Earnings: How the Price Could Move
On Wednesday, after the close of the main US trading session, Nvidia will release its quarterly results — a report seen not merely as another batch of corporate data but as a crucial test for the entire AI-driven bull run.
NVDA shares are up more than 40% since the start of the year, and the company must now prove that this surge is justified and that the AI revolution is still accelerating. According to media reports, Wall Street analysts remain optimistic:
→ Revenue: forecast around $54.9bn, implying roughly 56% year-on-year growth.
→ Earnings per share (EPS): about $1.25 (previous quarter: $1.05).
What should investors focus on?
Of particular importance will be:
→ data on Data Centre revenue, a key indicator of whether the AI boom remains intact;
→ forward guidance, as the market is looking for reassurance that Big Tech will continue to spend heavily on AI.
Technical Analysis of the Nvidia (NVDA) Chart
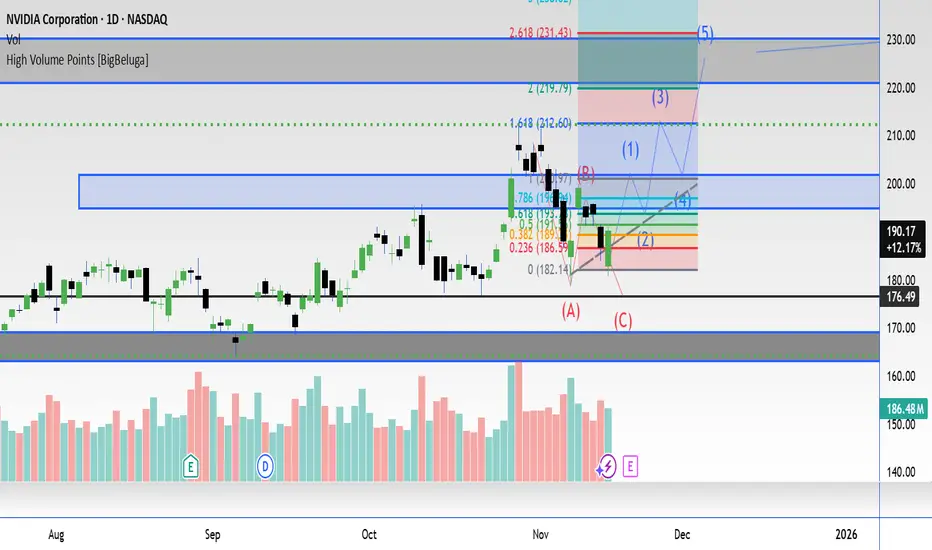
Recent price action in NVDA points to a sequence that can be interpreted as bearish:
→ 28 October: a strong rally above the psychological $200 level;
→ a failure to hold above that barrier;
→ a pullback on rising volumes (Nasdaq data) with expanding candles in early November.
In the broader market context, it is notable that early November has seen NVDA underperforming major equity indices, signalling firm resistance from sellers around $200.
From a bullish perspective, the decline from the all-time high resembles a correction pattern (shown in red) within a larger uptrend.
However, there is a risk that the market’s high expectations will not be met when the earnings report is published. If that happens, NVDA could extend its decline towards the lower boundary of the rising channel, where support lies near $165.
This article represents the opinion of the Companies operating under the FXOpen brand only. It is not to be construed as an offer, solicitation, or recommendation with respect to products and services provided by the Companies operating under the FXOpen brand, nor is it to be considered financial advice.

$NVDA | The Next Big Leg?NVIDIA has been a textbook case of Smart Money structure this cycle.
✅ Break of Structure (BOS) confirmed
✅ Trendline + MA confluence support at ~$177
✅ Strong premium zone rejection near $195
✅ Fibonacci extension eyeing $231.80
🔑 Levels to Watch:
$177 = Key support (trendline + MA)
$195 = Resistance zone (premium supply)
$231 = Next target if bullish momentum continues
💡 Game Plan:
Above $177 = Long bias toward $195 → $231
Break below $177 = Retrace toward $153 equilibrium
⚡️ Tech + AI flows remain strong; NVDA could be gearing up for another explosive move.
📢 Question to the community:
👉 Do you think NASDAQ:NVDA pushes through $195 straight to $231, or do we retest $153 first?
#NVDA #TradingView #Stocks #Fibonacci #SmartMoneyConcepts #AI #Bullish

$NVDA | Fib Expansion Points to $212.81 → Is the AI Supercycle JWaverVanir International LLC | Weekly Fibonacci Roadmap
📅 June 25, 2025 | +7.27% Day | Post-Stock Split Momentum
NVIDIA ( NASDAQ:NVDA ) continues to dominate the AI-driven tech rally. After reclaiming the 1.618 Fibonacci level ($128.35), price has broken above the 0.886 retracement ($146.72) and is now pressing higher with bullish volume.
🧠 Fibonacci Insights:
🔺 1.786 Fib Extension: $207.76
🎯 Primary Target: $212.81 (Golden Projection)
🚀 Long-term Fib targets extend into $250–290+ zone (2.618–3.0 extensions)
🔻 Red trendline below signals well-respected diagonal support since early 2023
📊 Price Outlook:
Current Price: $154.31
Short-term Path: Bullish breakout → $168.21 → $178.43
Next Major Resistance: $212.81
Support to Hold: $139.93 / $128.35 (previous Fib clusters)
🧩 Catalysts Ahead:
Q2 Earnings (Late August 2025) – Focus on AI/data center revenue acceleration.
NVIDIA Blackwell GPU shipments – Institutional uptake will confirm pipeline robustness.
AI Sovereign Demand – U.S., UAE, Singapore and Saudi Arabia investing in GPU infrastructure.
AI Arms Race – Competitive moat widening vs. AMD, Intel.
AI App Ecosystem Expansion – Surge in demand for inferencing chips (L4, L40, GB200).
Post-Stock Split Rotation – Retail inflow and fresh institutional allocations.
📌 Summary:
NVIDIA is not just a chipmaker — it’s the core of the modern AI stack. With clear Fibonacci structure and geopolitical tailwinds, the next target is $212.81. Watch dips into $140s for potential reload zones.
🔖 Hashtags:
#NVDA #NVIDIA #AIstocks #WaverVanir #FibExtension #FibonacciTrading #AIboom #BlackwellGPU #GPUpower #PostSplit #TechLeadership #TradingView #SMC #AIarmsrace

NVDA – First Signs of Stabilization After a Heavy Selloff (11/17NVDA finally showed the first real sign of stabilization after multiple days of controlled selling. The move off the lows wasn’t random — when you zoom into the different timeframes and combine it with the GEX landscape, the bounce actually makes a lot of sense. NVDA dropped right into a deep put zone, bottomed, and then climbed back with intent.
Let’s break down what’s really happening here.
1️⃣ 1-Hour Chart — Downtrend, but Buyers Finally Stepped Up
The 1H chart shows NVDA breaking every minor support for days, sliding cleanly down the descending channel. The selling pressure cooled only when price touched the 178–181 region. That’s where the trendline support met previous liquidity pockets, and buyers reacted instantly.
What’s notable is how quickly NVDA recovered back toward 190. That tells me two things:
1. Sellers covered aggressively at the low.
2. Buyers were waiting to step in near that trendline.
Important 1H levels:
* 190–192: First resistance test
* 194–195: Critical zone NVDA couldn’t reclaim last time
* 199–202: Bigger resistance if momentum expands
* 178–181: Strong demand zone that started the bounce
The 1H is showing the first shift from “straight down” to “controlled bounce.”
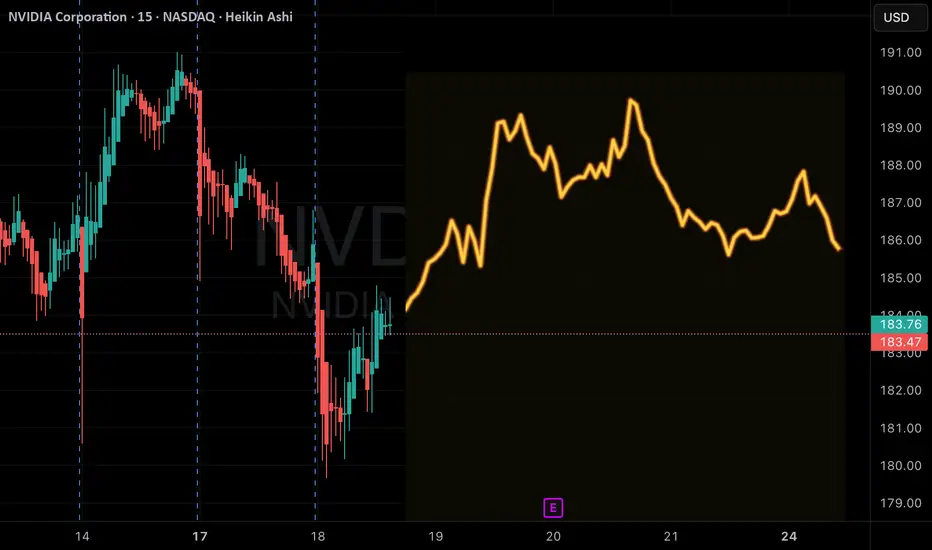
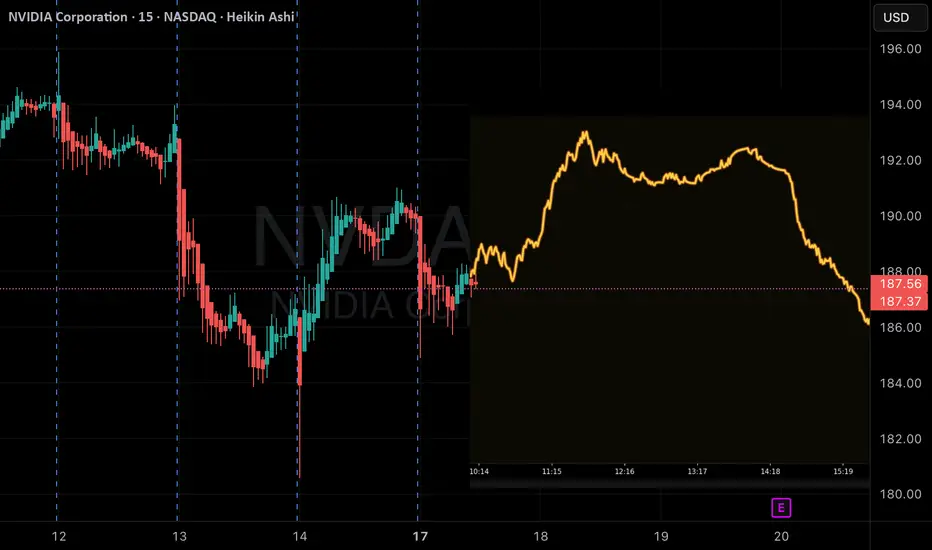
2️⃣ 15-Minute Chart — Momentum Turning Upward, but Needs Confirmation
The 15M chart shows NVDA reclaiming multiple small bullish FVGs on the way up. The most important part is how NVDA handled the intraday pullbacks — each dip was shallow and got bought quickly.
That’s what early reversal behavior looks like.
Key things I see on the 15M:
* Bullish FVGs forming under price → buyers absorbing dips
* Short-term resistance at 191–192 → price hesitating here
* Trendline reclaim gives NVDA room to test higher
The 15M doesn’t confirm a strong uptrend yet, but it shows a clear shift in character from sellers dominating to buyers at least competing.
3️⃣ GEX (1-Hour) — Explains Exactly Why NVDA Bottomed Where It Did
This is the part that ties the entire move together.
NVDA bounced precisely at the deep PUT wall around 178–181, where hedging pressure spikes. That’s why the reversal there was so sharp.
Upside Gamma Levels
* 191: First GEX pull
* 194–195: Heavy GEX cluster
* 200–203: 2nd call wall
* 210: Large GEX10 + 3rd call wall
If NVDA can reclaim 194–195, the move toward 200–203 becomes much easier than it looks on the chart alone.
Downside Gamma Levels
* 182: Pivot zone
* 178: Main put wall — the exact level that stopped the selling
* 175–170: Only activates if NVDA loses 178 decisively
The GEX structure is clean:
* Sellers lose power above 192
* Buyers lose control below 182
* Real battle zone sits between 188–192
This is the kind of GEX map that makes traders ask:
“Why does NVDA always bounce or stall at the same weird levels?”
(And yes — GEX gives the answer.)
🎯 How I’m Trading NVDA for 11/17
🔼 Bullish Scenario (Preferred Only Above 192)
NVDA needs to clear 192 with strength. If that happens:
Stock Trade Idea:
* Entry: 192.20–192.50
* Targets:
* 194
* 195
* 198
* 200–203 (call wall zone)
Options Idea:
* 195C or 200C
* Momentum-based trade IF NVDA reclaims 192 with volume
* Scale at each GEX zone
This is the cleanest setup.
🔽 Bearish Scenario (Only Valid If NVDA Rejects 192 or Loses 182)
Entry #1 (Aggressive):
* Rejects 192 → short into 188
Entry #2 (Stronger Confirmation):
* Break below 182
Targets:
* 180
* 178 (strong put wall)
* 175 (if volatility spikes)
Options Idea:
* 185P for quick moves
* 180P for continuation
* Below 178 → downside accelerates sharply
⚠️ Chop Zone: 188–191
This is the balance area where NVDA is likely to pause, fake out, and trap both sides.
Best avoided unless you’re scalping with tight risk.
Final Thoughts
NVDA finally caught a real bid after a long series of lower highs and lower lows. The bounce wasn’t accidental — it aligned with deep GEX put walls and a structural trendline. Now NVDA sits right below a key resistance at 192. That’s the line that decides whether this becomes a real reversal or just another lower high inside the downtrend.
Above 192 → the chart opens beautifully.
Below 182 → the bears take back control.
Anything between is noise.
Disclaimer
This analysis is for educational purposes only and does not constitute financial advice. Always trade with proper risk management.

NVDANVIDIA is still in an uptrend. Last week, the price hit a new high of $210, but the price was unable to break through this level, so it adjusted down. It is expected that the price will likely test the important support zone at $167-155. If the price cannot break through $155, the price still has a chance to rise.
However, if the price continues to rise in the near future, a correction may also occur.
Long-term trading plan: Wait for the correction to complete before buying.
** This is not financial advice.
🔥Trading futures, forex, CFDs and stocks carries a risk of loss.
Please consider carefully whether such trading is suitable for you.
>>GooD Luck 😊
❤️ Like and subscribe to never miss a new idea!


Nvda- Er this week I believe it has more in the tank!!Nvda smashes ER were going to see a massive inpulse! I don't see in heavy volume selling on the daily.. I think this one will be the last big pop we see before a major correction.. All other hyperscalers have performed and had major gaps on er.. Nvda is next bookmark this!!
Exchange Rate Strategies in the Global Market1. Understanding Exchange Rates and Their Importance
An exchange rate is simply the price of one currency in terms of another, such as 1 USD = 83 INR. But behind this apparent simplicity lies a complex system influenced by macroeconomic factors like inflation, interest rates, political stability, and capital flows.
Exchange rate fluctuations can determine the profit margins of exporters, the cost of imports, and the returns on foreign investments. In the global market, even a small movement—say, a 0.2% shift—can translate into millions of dollars gained or lost.
For this reason, market participants use a variety of strategies to manage risk, hedge currency exposure, and speculate on potential price movements.
2. Major Exchange Rate Strategies in the Global Market
Exchange rate strategies can be broadly classified into three categories:
Hedging Strategies – Used to protect against adverse currency movements.
Speculative Strategies – Aim to profit from expected changes in currency values.
Arbitrage and Carry Trade Strategies – Designed to exploit interest rate differentials or mispricing across markets.
Let’s explore each in detail.
3. Hedging Strategies: Protecting Against Currency Risk
Hedging is the most widely used approach in international business, especially for exporters, importers, and global investors. The goal is not to make a profit, but to avoid loss caused by unpredictable exchange rate movements.
a) Forward Contracts
A forward contract locks in a specific exchange rate for future delivery.
For example, an Indian exporter expecting $1 million payment in 3 months may fear the rupee strengthening, which would reduce rupee earnings. The exporter can fix today’s rate using a forward contract.
Benefits:
Offers certainty
Customizable to the amount and date
Drawbacks:
No benefit if the market moves favorably
Requires contractual commitment
b) Currency Futures
Currency futures serve a similar purpose as forwards but are traded on exchanges. They are standardized and offer more liquidity.
Who uses them:
Traders
Fund managers
Institutions needing transparency and daily settlement
c) Options (Currency Options)
Options provide the right—but not the obligation—to buy or sell currency at a set price.
Example: A call option on USD/INR allows buying USD at a set rate if the market rises.
Advantages:
Asymmetric protection
Gain on favorable moves, protection on unfavorable moves
Disadvantage:
Premium cost
d) Natural Hedging
Instead of using financial instruments, companies adjust their operations:
Borrow in the same currency as earnings
Match import payments with export receipts
Keep foreign currency balances
This reduces risk without needing derivatives.
4. Speculative Strategies: Profiting from Currency Movements
Speculation involves taking calculated positions in currencies, expecting changes in exchange rates. Professional traders, hedge funds, and banks commonly practice these strategies.
a) Trend Following (Momentum Trading)
Currencies often move in trends due to macroeconomic forces.
Traders use technical indicators like moving averages, RSI, and Fibonacci levels to identify upward or downward momentum.
b) Range Trading
Some currency pairs stay within predictable ranges for long periods.
Traders buy when the price touches the lower boundary (support) and sell when it hits the upper boundary (resistance).
c) Breakout Trading
Breakouts occur when currency pairs move beyond established levels due to major news, economic data, or central bank decisions.
Breakout traders aim to enter early and ride the fast movement.
d) Position Trading (Macro Trading)
These traders hold positions for months based on macroeconomic expectations:
Central bank policy divergence
Economic growth differences
Inflation trends
Political stability
Famous macro traders like George Soros used long-term fundamental strategies.
5. Arbitrage and Carry Trade Strategies
These are advanced strategies focused on inefficiencies or interest rate gaps.
a) Triangular Arbitrage
This exploits mispricing among three currencies.
For example, if EUR/USD, USD/JPY, and EUR/JPY exchange rates do not align perfectly, traders can buy one currency and sell another simultaneously for risk-free profit.
b) Covered Interest Arbitrage
This involves using forwards to lock interest rate differentials between two countries.
If a country has higher interest rates, investors borrow in a low-rate currency and invest in a high-rate one, hedging with a forward contract.
c) Uncovered Interest Arbitrage (Carry Trade)
The carry trade is one of the most popular global strategies.
How it works:
Borrow in a low-interest-rate currency (like JPY).
Invest in a high-interest-rate currency (like INR).
Earn the interest rate difference.
Risk:
If the high-rate currency depreciates sharply, losses can exceed gains.
Carry trade often collapses during global risk-off events.
6. Exchange Rate Strategies Used by Governments & Central Banks
Governments also actively manage exchange rates to stabilize the economy.
a) Currency Pegging
A country fixes its currency to another stable currency (USD, EUR, etc.).
Example: The UAE dirham is pegged to the USD.
b) Managed Float
Most currencies (including USD/INR) follow a managed float, where the central bank intervenes occasionally to prevent extreme volatility.
c) Forex Reserves Management
Countries hold large reserves to defend their currency during speculative attacks or to stabilize the exchange rate.
d) Capital Controls
Some nations restrict money movement to manage exchange rate stability.
Example: Limits on remittances or FDI flows.
7. Factors Influencing Exchange Rate Strategy Effectiveness
Several global factors shape the success of any exchange rate strategy:
Interest rate differentials
Trade balances
Inflation levels
Political and geopolitical risks
Commodity price changes (oil, gold, etc.)
Capital flows and investor sentiment
Central bank policy divergence
Understanding these factors enhances strategy accuracy.
8. Choosing the Right Exchange Rate Strategy
The optimal strategy depends on the participant’s profile:
For businesses:
Use hedging (forwards, options, natural hedges).
For traders:
Use speculative strategies (trend, breakout, arbitrage).
For investors:
Use carry trades, macro strategies, and diversified currency portfolios.
For governments:
Use policy tools (interventions, reserves, peg systems).
Conclusion
In the global market, exchange rate strategies form the backbone of international trade, investment security, and financial stability. With rising globalization, volatile currency movements are inevitable, and understanding the right mix of hedging, speculation, and arbitrage strategies can provide a strong edge. Whether one is an exporter managing risk, a trader seeking opportunity, or a policymaker stabilizing the economy, mastering exchange rate strategies enables smarter decisions and stronger resilience in today’s dynamic global market.
NVDA chart AnalysisI am sharing my NVDA chart analysis with other traders on how it can react or what potential prices it can go

$NVDANASDAQ:NVDA reports earnings next week, but I feel the hype is slowing down.
The only catalysts that could keep them strong are deeper ties with Israel’s defense systems and the new military tech initiatives they’re trying to build.
But even with that, the price needs a balance point.
NVDA is too extended it needs a healthy correction before the next leg.

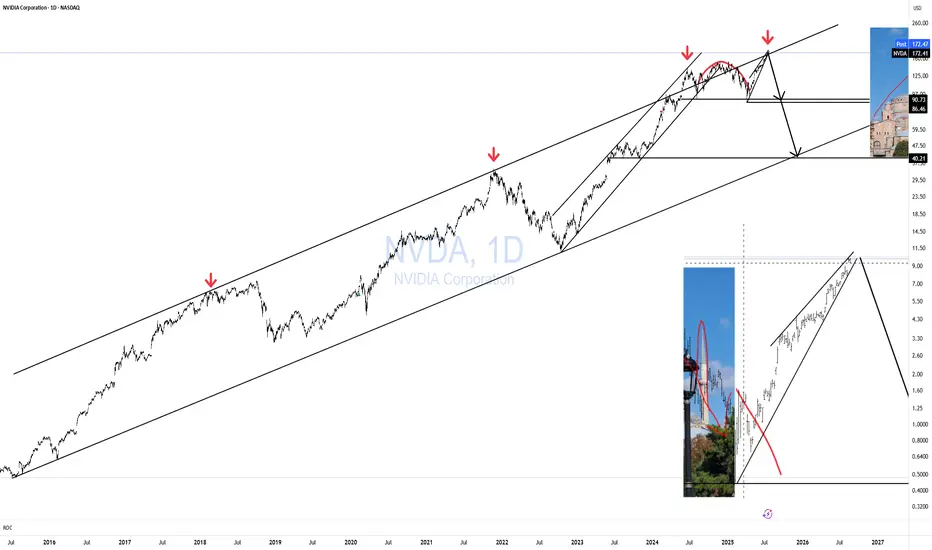
Continuation of the "AI Bubble" A chart for NVDA that illustrates the parabolic curve on this very large timeframe
To expect a curve like this to break is unlikely
AI will have huge implications
The potential of AGI aswell is huge for humanity in general. I don't see a bubble at all.
Weekly timeframe
