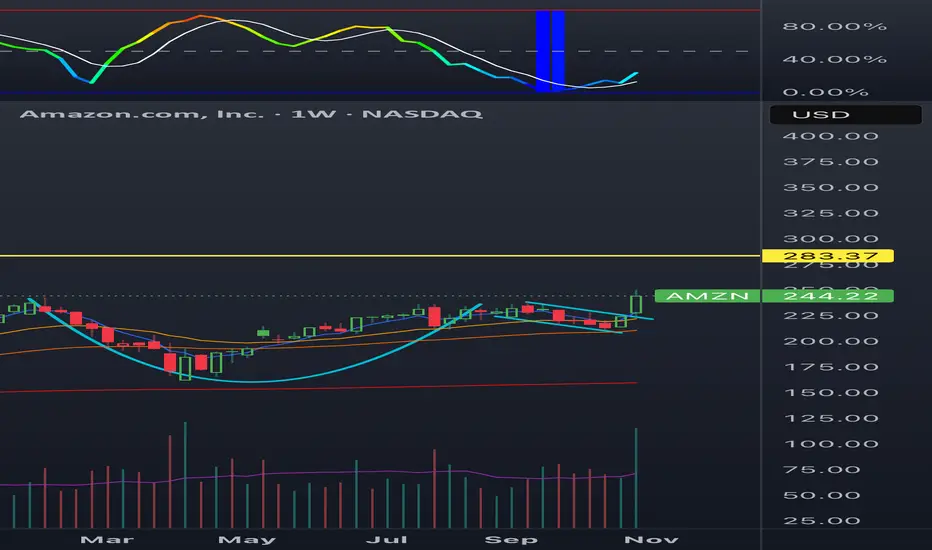
Amazon cup and handle breakout Amazon I have held in size all year. There has been a massive 220 and 240 sell walk for months. The stock has finally broken out. I have trimmed shorted dated calls and remain holding a lot of shares.
My target is a fib on the yellow line, might take a few months since this is a weekly chart. I expect the daily gap to at least partially fill, but who knows.
My plan:
Keep my shares and sell puts on red days
I might add long dated calls if we sweep 232$
Trade ideas
Lucky FOREX Analysis (November 17th-21st 2025)In this week i talked bout EUR/USD AUD/NZD BTC AUD/USD S&P500 AMZN MSFT
Welcome to our weekly market breakdown — get ready for actionable forex insights to guide you through the week ahead. In this episode we cover:
🔍 Major currency pairs and key support/resistance levels
🧲 Trend analysis: where the momentum is shifting and what may be driving it
📆 Economic events to watch (interest rate decisions, inflation releases, central-bank commentary)
🛠️ Trade setups: potential entries, stop-loss zones & profit targets
🎯 Risk management tips: how to approach the week with discipline
Whether you’re a day trader, swing trader or simply keen to stay ahead of the curve, you’ll find value in this edition.
🔔 Remember:
Markets move fast. Use this analysis as one part of your trading decision process—not the whole. Always perform your own due diligence and manage your risk carefully.

Green Energy Trading🔋 1. What is Green Energy Trading?
Green energy trading involves a system where renewable electricity is produced, tracked, valued, and sold. Unlike traditional energy trading, green energy trading requires verifying that the electricity comes from renewable sources. This is done through certificates, audits, and digital tracking systems.
In simple terms:
A solar or wind plant generates electricity.
That electricity is sent into the grid.
A certificate is issued verifying that this electricity came from renewable resources.
Traders, companies, or utilities buy this certificate or the actual power to meet sustainability goals or sell further in the market.
This creates a transparent pipeline where clean power can be monetized and traded like any commodity.
🔄 2. Key Components of Green Energy Trading
(A) Renewable Energy Certificates (RECs)
One of the most important trading instruments.
A REC represents proof that 1 megawatt-hour (MWh) of electricity was produced from a renewable source.
There are two main types of RECs:
Solar RECs (S-RECs) – generated from solar projects
Non-Solar RECs (N-SRECs) – generated from wind, hydro, biomass, etc.
Corporates and institutions buy RECs to meet renewable purchase obligations (RPOs) or sustainability targets.
(B) Green Power Exchanges
Countries now have dedicated trading markets for renewable energy. For example:
India operates green energy segments on IEX and PXIL.
Europe trades green power on EPEX, Nord Pool, and others.
At these exchanges, renewable energy is bought and sold through:
Day-ahead markets
Term-ahead markets
Real-time markets
Green day-ahead markets (GDAM)
Green term-ahead markets (GTAM)
This ensures transparent price discovery and fair competition.
(C) Power Purchase Agreements (PPAs)
A PPA is a long-term contract between a green power generator and a buyer.
Large companies like Google, Amazon, Meta, Reliance, and Tata Steel use PPAs to directly procure renewable energy at fixed prices for many years.
This helps companies reduce electricity cost volatility and carbon footprint.
(D) Carbon Credits & Emission Trading
Although not the same as green energy trading, carbon credit trading supports the green energy ecosystem.
Every ton of CO₂ emission reduced can be converted into a credit and sold to polluting industries.
This system incentivizes renewable projects financially.
⚙️ 3. How Green Energy Trading Works (Step-by-Step)
Step 1: Generation
A renewable energy plant (solar park, wind farm, hydro station) produces electricity and injects it into the power grid.
Step 2: Certification
An agency verifies the energy source and issues RECs or other green certificates.
Step 3: Listing on Exchanges
Producers list their green power or certificates on:
Indian Energy Exchange (IEX)
Power Exchange India Limited (PXIL)
European or American energy markets
Step 4: Bidding & Trading
Buyers such as:
Utility companies
Industries
Corporates
Traders
Distribution companies (DISCOMs)
place bids to purchase renewable energy or certificates.
Step 5: Settlement
Traded units are delivered based on contract type — real-time, day-ahead, or long-term.
🧩 4. Why Green Energy Trading Is Growing
(A) Climate Change Awareness
Countries have committed to reducing carbon emissions under the Paris Agreement.
Green energy trading supports clean energy targets.
(B) Corporate Sustainability (ESG Goals)
Companies now have strict Environmental, Social, and Governance reporting mandates.
Purchasing green energy helps them meet ESG scores.
(C) Falling Renewable Energy Costs
Solar and wind generation costs have dropped drastically in the past decade.
This makes green energy competitive with fossil-based electricity.
(D) Government Regulations
Governments worldwide mandate renewable purchase obligations (RPOs).
Industries must buy a certain percentage of energy from renewable sources.
📉 5. Price Dynamics in Green Energy Trading
Green energy prices depend on:
Seasonal variations (wind peaks in monsoon, solar peaks in summer)
Grid congestion
Demand–supply imbalances
Policy changes
REC market demand
Fuel costs for backup systems
In markets like India, green prices sometimes fall below conventional electricity prices due to oversupply during peak renewable generation hours.
📈 6. Opportunities for Traders
Green energy markets offer multiple trading opportunities:
(A) Volatility-Based Trading
Prices fluctuate across day-ahead, real-time, and intraday markets.
(B) Arbitrage Opportunities
Traders capitalize on:
Time-based price difference
Region-based differences
Certificate value fluctuations
(C) PPA Trading
Some economies allow secondary trading of PPAs.
(D) REC Speculation
RECs can be bought low and sold high as demand increases.
🏭 7. Opportunities for Businesses
Industries Benefit Through:
Lower energy costs
Reduced carbon footprint
Compliance with RPO
Long-term price stability via PPAs
Improved corporate sustainability ratings
Many companies adopt green energy to reduce electricity bills by 20–40%.
🌍 8. Global Growth of Green Energy Trading
Countries leading the growth are:
India
Germany
USA
China
UK
Nordic countries
India’s green day-ahead market (GDAM) and green term-ahead market (GTAM) are among the fastest-growing segments in the energy space.
🤖 9. Digital Transformation in Green Energy Trading
Modern green energy trading uses:
AI-based forecasting
Blockchain for energy certificates
IoT-based smart meters
Cloud-based energy management systems
Virtual power plants (VPPs)
Blockchain ensures transparency, preventing fraud in RECs and PPAs.
🔮 10. Future of Green Energy Trading
(A) Green Hydrogen Trading
Hydrogen produced using renewable energy will form a major trading market.
(B) Battery Energy Storage (BESS) Integration
Stored renewable energy will be traded during peak demand.
(C) Peer-to-Peer Energy Trading
Consumers will directly buy and sell energy through digital platforms.
(D) Carbon-Free 24/7 Markets
Companies will match energy consumption with renewable generation every hour.
🧠 Conclusion
Green energy trading is transforming the global energy landscape. It enables renewable energy producers to monetize their power, provides companies a way to meet sustainability goals, and offers traders new opportunities through certificates, markets, and contracts. As renewable energy grows, green energy trading will continue to expand, becoming one of the most important components of the future energy economy.

Sanctions and Their Role in the Global Market1. Understanding Sanctions
Sanctions are restrictions placed by one country or a group of countries on another nation or entity to enforce international laws or influence political or economic decisions. They are often used as alternatives to military intervention, serving as diplomatic or economic pressure tools. Sanctions can be applied for various reasons — to punish aggression, prevent nuclear proliferation, counter terrorism, or respond to human rights violations.
The key players in imposing sanctions are major economic and political blocs such as the United Nations (UN), the European Union (EU), and powerful individual nations like the United States. The U.S., for instance, uses the Office of Foreign Assets Control (OFAC) to design and enforce sanctions globally.
2. Types of Sanctions
Sanctions come in several forms, each targeting different aspects of an economy or government operation. The most common types include:
Economic Sanctions:
These restrict trade and financial transactions. Examples include import and export bans, restrictions on investments, or freezing of assets. Economic sanctions are intended to weaken a nation’s economic stability.
Trade Sanctions:
Trade restrictions can prevent the export of critical goods like oil, technology, or weapons. For instance, sanctions on Iran’s oil exports have significantly limited its main source of revenue.
Financial Sanctions:
These target banking systems, financial institutions, and access to international payment systems like SWIFT. Russia, for example, faced severe financial isolation after its 2022 invasion of Ukraine.
Travel and Visa Sanctions:
These restrict the movement of political leaders, business executives, or individuals associated with illicit activities.
Military Sanctions:
These include arms embargoes that prevent the sale or supply of weapons and military technology.
Sectoral Sanctions:
These are targeted at specific sectors, such as defense, energy, or finance, to maximize economic pressure while minimizing collateral damage.
3. Objectives of Sanctions
The main goal of sanctions is to influence the behavior of governments or organizations without direct conflict. Their objectives include:
Deterring Aggression:
Sanctions can discourage military invasions or aggressive policies by raising the economic costs of conflict.
Promoting Human Rights:
Countries imposing sanctions often aim to pressure regimes accused of human rights abuses to change their policies or release political prisoners.
Preventing Nuclear Proliferation:
Sanctions against nations like North Korea and Iran are designed to stop the development of nuclear weapons programs.
Countering Terrorism:
Sanctions can block financial channels and assets used by terrorist groups.
Maintaining Global Stability:
Sanctions can be part of a coordinated global response to maintain international peace and uphold the rules-based order.
4. Mechanisms and Enforcement
Sanctions are typically implemented through laws, executive orders, or international agreements. Enforcement mechanisms include:
Asset Freezes: Preventing access to money or property held in foreign accounts.
Export Controls: Blocking the sale of critical goods, technology, or services.
Financial Restrictions: Limiting a country's access to international capital markets or payment systems.
Secondary Sanctions: Penalizing third-party countries or companies that do business with the sanctioned nation.
Monitoring compliance is crucial. Organizations such as the Financial Action Task Force (FATF) help track illegal financial activities and ensure that sanctions are effectively enforced.
5. Impact on the Global Market
The effects of sanctions ripple through the global economy, influencing trade balances, currency values, and market confidence. The impact varies based on the size and integration of the targeted country into the global market.
a. Trade and Supply Chains
Sanctions often disrupt global supply chains. For instance, sanctions on Russia and Iran have affected oil and gas supplies, driving up energy prices worldwide. Similarly, export restrictions on high-tech goods to China have reshaped global semiconductor and electronics markets.
b. Energy Markets
Energy is one of the most affected sectors. Russia’s sanctions after the Ukraine conflict caused global oil and gas price surges, forcing Europe to seek alternative energy suppliers. The Organization of the Petroleum Exporting Countries (OPEC) also faces indirect pressure when sanctions alter global energy supply and demand dynamics.
c. Financial Markets
Financial sanctions can restrict global capital flow. When large economies face sanctions, investors often move funds to safer markets, affecting currency exchange rates and global liquidity. For example, the freezing of Russian foreign reserves shook confidence in the global financial system and led to a rethinking of foreign reserve management by other nations.
d. Currency and Inflation
Countries under sanctions often experience currency depreciation due to restricted foreign investment and reduced exports. This leads to inflation and reduced purchasing power. Conversely, global markets can see inflation spikes when critical exports like oil or metals are restricted.
e. Global Business and Investment
Multinational corporations often have to withdraw from sanctioned regions to avoid penalties. For example, Western companies left Russia in 2022, leading to billions in losses. At the same time, other countries—like China, India, and Turkey—sometimes step in to fill trade gaps, reshaping global business networks.
6. Winners and Losers of Sanctions
Sanctions do not impact all players equally.
Losers:
The sanctioned nation’s economy typically suffers severe downturns—loss of exports, unemployment, and financial isolation. Ordinary citizens bear the brunt of inflation and shortages.
Winners:
Competing countries may benefit by capturing markets vacated by the sanctioned nation. For example, when Western countries stopped buying Iranian oil, Asian importers received discounted rates.
Some nations, particularly those with large domestic markets or resource independence, can mitigate sanctions' effects. Russia and Iran, for example, have developed parallel financial systems and strengthened ties with non-Western economies.
7. Geopolitical and Strategic Consequences
Sanctions also alter geopolitical alliances. Countries facing sanctions often form new partnerships to bypass restrictions. The growing trade between Russia, China, and Iran illustrates the emergence of an alternative economic bloc.
Furthermore, sanctions can accelerate de-dollarization—efforts by countries to reduce reliance on the U.S. dollar in international trade. This trend threatens to reshape the structure of global finance in the long term.
8. Criticisms and Limitations
While sanctions aim to promote peace and justice, they often have unintended consequences. Critics argue that:
Humanitarian Impact: Sanctions can lead to shortages of food, medicine, and essentials, harming civilians more than political elites.
Limited Effectiveness: Some regimes adapt through smuggling, black markets, or new alliances, reducing the intended pressure.
Global Economic Distortion: Sanctions can destabilize global markets, raising costs for consumers worldwide.
Political Misuse: At times, sanctions are used to advance national interests rather than collective global welfare.
9. The Future of Sanctions in a Multipolar World
As global power becomes more multipolar, sanctions may evolve from unilateral tools into complex, multilateral strategies. The rise of alternative payment systems, digital currencies, and regional alliances is challenging traditional sanction mechanisms.
Future sanctions are likely to become more targeted, using data analytics and AI to precisely identify and restrict individuals or companies, minimizing collateral damage. Digital finance, blockchain monitoring, and trade transparency will shape how sanctions are enforced.
10. Conclusion
Sanctions are a central instrument of global diplomacy and economic policy. They influence trade routes, investment flows, and geopolitical alignments across the world. While they serve as a non-violent means to uphold international norms, their ripple effects on the global market can be profound—affecting everything from oil prices to inflation and financial stability.
The challenge for the international community is to design sanctions that are strategic, humane, and effective, achieving political goals without destabilizing the world economy. In an era of interconnected markets, the role of sanctions will continue to grow—reflecting not only power politics but also the evolving architecture of the global financial and trade system.

Global Currency Trends and Challenges1. The Dynamics of Global Currency Trends
Currencies fluctuate continuously due to multiple factors including interest rates, inflation, trade balances, and investor sentiment. In recent years, global currency trends have reflected the broader transitions in the world economy:
a. The Strength of the U.S. Dollar (USD):
The U.S. dollar continues to dominate as the world’s primary reserve currency, accounting for about 58% of global foreign reserves. Its dominance is supported by the stability of the U.S. economy and the depth of its financial markets. However, the dollar’s strength often creates challenges for emerging markets as it raises the cost of imports and foreign debt repayment.
b. The Rise of the Chinese Yuan (CNY):
China has made consistent efforts to internationalize the yuan (renminbi). Through trade settlements, central bank swap agreements, and inclusion in the IMF’s Special Drawing Rights (SDR) basket, the yuan has become an increasingly influential currency in Asia and beyond. The Belt and Road Initiative further enhances its role in regional trade.
c. The Euro’s Resilience (EUR):
Despite political fragmentation and energy crises, the euro remains the second most traded and held currency. The European Central Bank (ECB) has strengthened its credibility through unified monetary policies, although economic disparities among EU member states still pose challenges to its long-term stability.
d. Emerging Market Currencies:
Currencies like the Indian Rupee (INR), Brazilian Real (BRL), and Indonesian Rupiah (IDR) are gaining attention as their economies expand. Yet, these currencies often face volatility due to external factors such as oil prices, foreign investment flows, and geopolitical tensions.
2. Key Global Currency Trends Shaping the Future
a. Shift Toward De-Dollarization:
Many nations are reducing their dependence on the U.S. dollar for trade settlements and reserves. Countries such as Russia, China, and India are increasingly using local currencies for bilateral trade. The establishment of regional payment systems like the BRICS Pay initiative signals a long-term effort to diversify away from dollar dominance.
b. Digital and Central Bank Digital Currencies (CBDCs):
The introduction of digital currencies is transforming how money circulates globally. China’s digital yuan pilot, the European Central Bank’s digital euro project, and the U.S. discussions around a digital dollar show that CBDCs are becoming integral to future monetary systems. They promise faster transactions, greater transparency, and lower cross-border costs but also raise privacy and cybersecurity concerns.
c. Volatility Amid Global Uncertainty:
Geopolitical conflicts, such as the Russia–Ukraine war and Middle East tensions, continue to affect currency markets. These events drive investors toward “safe-haven” currencies like the U.S. dollar, Swiss franc (CHF), and Japanese yen (JPY), increasing volatility in emerging markets.
d. Inflation and Interest Rate Cycles:
Central banks across the globe are battling inflation through aggressive rate hikes. The U.S. Federal Reserve’s monetary tightening has strengthened the dollar, while other currencies have weakened comparatively. Such divergence in interest rate policies creates significant volatility in Forex markets and impacts global capital flows.
e. Technological Integration and Algorithmic Trading:
Advanced analytics and artificial intelligence have changed how currency trading operates. Algorithmic and high-frequency trading (HFT) dominate modern Forex markets, improving liquidity but sometimes amplifying short-term volatility.
3. Major Challenges Facing Global Currencies
a. Inflationary Pressures:
Post-pandemic recovery spending and geopolitical disruptions have triggered persistent inflation across major economies. Currency depreciation is often both a symptom and a cause of inflation, creating a feedback loop that destabilizes developing economies. For example, high inflation in Argentina and Turkey has severely eroded the value of their local currencies.
b. Sovereign Debt and Fiscal Imbalances:
Excessive government borrowing, especially in developing nations, can undermine currency stability. Investors demand higher returns to offset perceived risks, leading to capital flight and exchange rate depreciation. Countries with high external debt face added challenges when the dollar strengthens, as it raises the cost of servicing foreign liabilities.
c. Currency Wars and Competitive Devaluations:
Some nations deliberately devalue their currencies to make exports more competitive, leading to “currency wars.” While this may temporarily boost exports, it can trigger retaliatory devaluations by other nations and disrupt global trade equilibrium.
d. Geopolitical Fragmentation:
Trade conflicts, sanctions, and regional disputes have made currency management more complex. For instance, sanctions on Russia have accelerated the shift toward non-dollar settlements. Similarly, tensions between the U.S. and China have influenced exchange rate policies and investor confidence in Asian markets.
e. The Digital Currency Disruption:
While digital currencies offer efficiency, they also threaten the traditional banking system. Decentralized cryptocurrencies like Bitcoin and Ethereum challenge the authority of central banks, while CBDCs raise questions about data security, financial surveillance, and cross-border regulatory coordination.
4. Regional Perspectives on Currency Challenges
a. North America:
The U.S. dollar’s global dominance remains, but its high value has hurt American exporters. Canada and Mexico, heavily tied to U.S. trade, face indirect pressures from U.S. interest rate policies.
b. Europe:
The eurozone’s challenge lies in maintaining economic cohesion. Energy dependency, especially on imports, continues to pressure the euro. The U.K. pound has also faced volatility post-Brexit due to trade uncertainty.
c. Asia-Pacific:
Asian economies are at the center of global currency evolution. China’s controlled yuan regime, India’s managed float system, and Japan’s ultra-loose monetary stance make the region diverse and influential. However, regional currencies remain vulnerable to U.S. policy changes and commodity price shocks.
d. Latin America and Africa:
These regions experience chronic currency instability due to high inflation, low reserves, and political risks. However, some nations are exploring local currency trade and digital payment systems to stabilize transactions and reduce reliance on the dollar.
5. The Way Forward: Managing Currency Stability
To navigate the future of global currencies, coordinated strategies are essential:
a. Strengthening Monetary Cooperation:
International institutions like the IMF and World Bank must enhance collaboration among central banks to stabilize currency markets during crises.
b. Promoting Transparent Policies:
Countries should maintain credible fiscal and monetary policies to attract investor confidence and reduce speculative volatility.
c. Managing the Digital Transition:
As CBDCs become more common, global frameworks must ensure interoperability, privacy protection, and cyber resilience.
d. Diversification of Reserves:
Central banks are gradually increasing holdings in gold, the euro, and the yuan to balance their portfolios against dollar fluctuations.
Conclusion
Global currency trends reflect the dynamic balance of economic power, technological progress, and geopolitical change. While the U.S. dollar remains dominant, the rise of digital currencies and regional trade systems is reshaping the international monetary landscape. Challenges like inflation, debt, and political tension will continue to test the stability of global currencies. The future will likely see a more diversified, digital, and interconnected currency system — one that demands cooperation, innovation, and adaptability from all nations involved.

Amazon Wave Analysis – 6 November 2025
- Amazon reversed from resistance area
- Likely to fall to support level 0.8000
Amazon recently reversed from the resistance area between the resistance level 250.00, upper daily Bollinger Band and the resistance trendline of the daily up channel from April.
The downward reversal from this resistance area started the active short-term ABC correction 2.
Given the strength of the resistance level 250.00 and the overbought daily Stochastic, Amazon can be expected to fall to the next support level 240.00.

$AMZN with a bullish outlook following its earnings #StocksThe PEAD projected a bullish outlook for NASDAQ:AMZN after a positive over reaction following its earnings release, with an expected accuracy of 75%.

How Currency Trading Works1. Introduction
Currency trading, also called foreign exchange (forex or FX) trading, is the global process of buying and selling different currencies. It’s the largest financial market in the world, with over $7.5 trillion traded daily. The main goal is to profit from fluctuations in exchange rates between currencies — for example, buying euros and selling U.S. dollars if you believe the euro will strengthen.
Unlike stock exchanges that operate in specific locations, the forex market is decentralized and functions electronically through a network of banks, institutions, brokers, and traders. It operates 24 hours a day, five days a week, covering all major time zones — from Sydney to London to New York.
2. Structure of the Forex Market
The forex market operates over-the-counter (OTC), meaning there’s no central exchange. Trades occur electronically between participants worldwide. Key market participants include:
Central Banks: Influence currency values through interest rates and monetary policy.
Commercial and Investment Banks: Provide liquidity and handle large transactions.
Corporations: Exchange currencies for global trade and hedging.
Hedge Funds and Financial Institutions: Engage in large-scale speculation.
Retail Traders: Individuals trading through online brokers.
This decentralized structure ensures constant liquidity and continuous trading opportunities.
3. Currency Pairs and Exchange Rates
Currencies are traded in pairs, such as EUR/USD or USD/JPY.
The first currency is the base currency.
The second is the quote currency.
The exchange rate shows how much of the quote currency is needed to buy one unit of the base currency.
Example:
If EUR/USD = 1.1000, it means 1 euro = 1.10 U.S. dollars.
When a trader buys EUR/USD, they are buying euros and selling dollars, expecting the euro to rise. Selling the pair means expecting the euro to fall against the dollar.
4. Major, Minor, and Exotic Pairs
Currency pairs fall into three main categories:
Major Pairs: Include the U.S. dollar and another major currency like the euro, yen, or pound. (Examples: EUR/USD, USD/JPY)
Minor Pairs (Crosses): Don’t include the U.S. dollar. (Examples: EUR/GBP, GBP/JPY)
Exotic Pairs: Combine a major currency with one from a developing economy. (Examples: USD/INR, EUR/TRY)
Majors are the most liquid and widely traded, while exotic pairs are less liquid but often more volatile.
5. How Forex Trading Works
In forex trading, you buy one currency and sell another simultaneously. For example:
You buy EUR/USD at 1.1000 expecting the euro to rise.
If the rate increases to 1.1100, you can sell for a profit.
If it falls to 1.0900, you incur a loss.
This system allows traders to profit in both rising and falling markets — one of the key attractions of forex.
6. Bid, Ask, and Spread
Each currency pair quote shows two prices:
Bid price: Price at which you can sell the base currency.
Ask price: Price at which you can buy the base currency.
Spread: The difference between the two, representing the broker’s fee.
Example: EUR/USD = 1.1000 / 1.1002 → spread = 0.0002 (2 pips).
Tight spreads mean lower trading costs.
7. Leverage and Margin
Forex trading often involves leverage, which lets traders control large positions with small capital.
For instance, with 1:100 leverage, $1,000 can control a $100,000 position.
If the trade moves 1% in your favor, you gain $1,000; if it moves 1% against you, you lose the same amount.
While leverage boosts potential returns, it also magnifies risks — making proper risk management essential.
8. Fundamental Drivers of Currency Prices
Currency values are influenced by a mix of economic and political factors, including:
Interest Rates: Higher rates attract foreign investment, boosting demand for the currency.
Inflation: Low inflation strengthens a currency’s value.
Economic Growth: Strong GDP and employment data support currency appreciation.
Central Bank Policy: Actions by the Federal Reserve, ECB, or RBI directly move markets.
Trade Balance: Surpluses strengthen a currency; deficits weaken it.
Political Stability: Investors prefer politically stable nations.
Successful traders follow economic calendars and analyze these events to anticipate market reactions.
9. Technical Analysis
Apart from economic fundamentals, traders use technical analysis — studying price charts and patterns to forecast future moves.
Common tools include:
Support and Resistance levels – key price zones where markets tend to reverse.
Candlestick Patterns – like Doji, Engulfing, and Pin Bar.
Indicators – Moving Averages, RSI, MACD, Bollinger Bands.
Trendlines and Channels – to identify overall direction.
Technical analysis helps traders time entries and exits more precisely.
10. Trading Styles
Forex traders use different approaches depending on their risk tolerance and goals:
Scalping: Very short-term trades lasting seconds or minutes.
Day Trading: Positions opened and closed within the same day.
Swing Trading: Holding positions for days or weeks to capture medium-term moves.
Position Trading: Long-term approach based on macro trends.
Each style demands discipline, strategy, and awareness of market volatility.
11. The 24-Hour Forex Market
The forex market operates continuously across four major sessions:
Sydney Session: Opens early but with low volume.
Tokyo Session: Focused on yen and Asian pairs.
London Session: Most liquid and volatile; overlaps with other sessions.
New York Session: Active for USD-based pairs and overlaps with London.
The London–New York overlap (around 7 PM to 10 PM IST) is the busiest period with the most price action.
12. Role of Brokers and Trading Platforms
Retail traders access forex via brokers, who connect them to global liquidity providers. Brokers offer trading platforms like MetaTrader 4 (MT4), MetaTrader 5 (MT5), and cTrader, which display live prices, charts, and order tools.
Two main broker models exist:
ECN/STP Brokers: Directly route orders to the interbank market with transparent pricing.
Market Makers: Quote their own prices and act as the counterparty to trades.
When choosing a broker, traders look for tight spreads, fast execution, and strong regulation.
13. Risk Management
Because leverage and volatility are high in forex, risk management is critical.
Some essential practices include:
Stop-Loss Orders: Automatically limit losses when the market moves unfavorably.
Take-Profit Orders: Lock in gains at preset targets.
Position Sizing: Adjust trade size relative to account balance.
Avoiding Over-Leverage: Using excessive leverage can lead to rapid losses.
Emotional Discipline: Avoid chasing losses or impulsive trades.
Smart risk control ensures longevity in trading, even when not every trade is profitable.
14. Technology and Automation
Technology plays a huge role in modern forex trading.
Algorithmic trading systems and Expert Advisors (EAs) automatically execute trades based on programmed strategies.
AI and big data are increasingly used to analyze sentiment, volatility, and macroeconomic patterns in real time.
Additionally, mobile apps and online platforms have made trading accessible to millions of individuals worldwide.
15. Regulation and Legal Aspects
Due to its global nature, forex regulation varies across countries.
Major regulators include:
U.S.: CFTC and NFA
U.K.: FCA
Europe: ESMA
India: SEBI and RBI
In India, trading is allowed only through recognized exchanges like NSE or BSE, and only in INR-based pairs (USD/INR, EUR/INR, GBP/INR, JPY/INR). Offshore forex trading using foreign brokers is restricted under Indian regulations.
16. Pros and Cons of Currency Trading
Advantages:
High liquidity and 24-hour access
Low transaction costs
Opportunity to profit in both up and down markets
Low capital requirement due to leverage
Challenges:
High risk due to leverage and volatility
Emotional stress and discipline demands
Unpredictable geopolitical and economic shocks
Potential for scams in unregulated regions
Understanding both sides helps traders maintain realistic expectations and develop sustainable strategies.
17. Example of a Simple Trade
Let’s consider a practical example:
Suppose a trader believes that the British pound (GBP) will strengthen against the U.S. dollar (USD) due to better U.K. economic data.
They buy GBP/USD at 1.2500.
Later, the rate rises to 1.2600 — a 100-pip gain.
If the trader’s position size is $100,000, each pip is worth $10.
Profit = 100 pips × $10 = $1,000.
However, if the rate falls to 1.2400, the trader loses the same amount.
This shows how small movements can produce large profits or losses, especially with leverage.
18. The Psychology of Forex Trading
Beyond strategy, trading psychology determines long-term success.
Emotions like fear, greed, and impatience often lead traders to exit early or overtrade.
Maintaining discipline — sticking to a plan, accepting losses, and managing expectations — separates professionals from beginners.
Many traders adopt journals or checklists to review trades and control behavior.
19. Global Importance of Forex Trading
Forex plays a crucial role in the global economy by facilitating:
International trade and investment
Cross-border business operations
Hedging against currency risks
Global financial stability
Every multinational company, bank, and government depends on currency conversion — making forex the lifeblood of global commerce.
20. Conclusion
Currency trading is a dynamic, high-liquidity financial arena that connects economies across the world.
By understanding how currencies are traded, what drives their value, and how to manage risk effectively, traders can navigate this vast market with confidence.
However, success in forex isn’t just about knowledge — it requires patience, emotional balance, and continuous learning. When approached responsibly, currency trading offers a unique opportunity to participate in the heartbeat of the world’s financial system.
Amazon (AMZN): Ready for a New Breakout!Amazon isn’t just delivering packages — it’s delivering earnings surprises and a chart breakout too! 😎
After reporting strong Q3 earnings on 30 Oct 2025 , AMZN’s chart popped with a clean cup & handle breakout on 31 Oct 2025 — just in time for a bullish Halloween rally 🎃🐂
💰 Earnings Highlights :
Revenue : Came in above expectations, boosted by AWS and advertising growth.
EPS : Beat market estimates, showing stronger profitability.
Operating cash flow : Improved significantly — partly thanks to deferred tax effects — giving Amazon more room for CapEx and expansion.
☁️ AWS Power :
AWS continues to lead the way with steady growth and improved margins. Analysts expect momentum to carry into Q4 2025 , supported by rising demand for cloud and AI-driven services.
📊 Technical View :
The chart shows a classic cup & handle breakout — volume confirmation looks solid, suggesting potential continuation into year-end.
🔥 My Take:
When strong fundamentals meet a clean technical setup, that’s where the magic happens. Amazon might just be brewing a latte-fueled rally into Q4 ☕🚀

AMZN Bullish Breakout: Retest Above 238 Toward 255–265AMZN just cleared a four-month rectangle (214–238) with a decisive late-October surge, shifting the daily trend back to bullish. Price now rides above the 20/60/120-day MAs with expanded volatility—classic post-breakout behavior. The former lid at 238 flips to support, while the next clear shelf sits near the psychological 255.
Primary path: look for a constructive pullback into 238–242 to validate the breakout. A daily close above 242, a 1H close >248, or a continuation break through 250.50 can serve as triggers. If buyers defend 238 on the retest, the path of least resistance favors a push into 252–254, then the measured round-number objective at 255, with extension toward 265 if momentum persists and volume stays supportive.
If 238 fails on a decisive close, treat it as a false break and expect rotation back into the prior range, with 230 as the magnet. Invalidation for the bullish idea sits on a firm daily close back below 238; conservative risk placement can sit around 235–236 to protect against a failed retest.
This is a study, not financial advice. Manage risk and invalidations

Why Your Next Trade Means Nothing
🧠 The Notebook Process #2 — Understanding the True Nature of Trading.
Some laws govern everything we do, and trading is no exception, even if it often feels like pure chaos.
Every tick looks random. Every trade feels unique. Yet beneath that noise, a hidden law quietly shapes your results. It’s one of the cornerstones of statistics, and it rules every trading account on Earth: The Central Limit Theorem.
Don’t worry, no math coming your way: just an intuitive truth you can plug directly into your trading mindset.
📖 The Nature of Trading.
Your true profitability, your average win or loss, only begins to emerge and, more importantly, stabilize after a large number of trades.
That’s it. That’s the law.
A single trade? Meaningless. Ten trades? Still noise.
Hundreds of trades? That’s where the truth starts to show. What you see after enough repetitions isn’t randomness anymore: it’s your edge revealing itself.
That’s the Law of Large Numbers and the Central Limit Theorem in motion: pure science.
☑️ What This Means for Traders.
Your system’s real strength, its expectancy, only appears through repetition.
A handful of trades? Still luck. Pure variance, random ups and downs that mean nothing.
A few hundred? Now you’re seeing skill: the signal rising above the noise. In plain English:
“A trading journey can only be evaluated after a large number of trades. That’s why your process matters more than your last result, no matter how good or bad it looked.”
And that’s exactly what The Notebook Process #1 was about: 👉 Evaluate in blocks, not single trades.
💸 Let’s Put the Law to Work:
1️⃣ Take your trading record and compute: Average win, Average loss, and Win rate.
2️⃣ Calculate your expectancy using this simple formula:
(Avg Win × Win Rate) – (Avg Loss × (1 – Win Rate))
3️⃣ That number tells you how much you make (or lose) per trade on average, and more importantly, what you can expect to make in the future.
If it’s positive, you’re trading with an edge. Keep going: reproducibility is what makes it stable.
If it’s negative, stop immediately. The bleeding won’t stop until the math changes.
That’s it. Pure math applied to trading: and believe me, you don’t want to fight this law.
🌍 The Gravity of Trading.
The difference between a trader who understands and one who only tries isn’t talent, it’s focus.
Focus on expectancy, not the win rate, not the reward to risk ratio.
It might seem basic, but so is gravity, and like gravity, it governs you whether you believe in it or not.

The Resurgence of the Commodity MarketIntroduction: The Return of the Commodity Supercycle
In the ever-evolving global financial landscape, the commodity market has made a remarkable comeback after a period of stagnation. From energy to metals, and agricultural goods to rare earth elements, commodities are once again commanding investor attention. This resurgence is not a coincidence—it’s the result of a complex interplay of geopolitical shifts, supply-chain disruptions, climate policies, and global economic realignments.
The early 2020s witnessed extreme volatility due to the pandemic, trade wars, and inflationary pressures. However, by the mid-2020s, commodities began to reassert themselves as a cornerstone of global trade and investment. Whether it’s oil prices surging due to production cuts, gold reclaiming its role as a hedge against inflation, or agricultural commodities thriving under new technological revolutions—this revival is reshaping how investors view raw materials and physical assets.
Understanding Commodities: The Backbone of Global Trade
Commodities are the raw materials essential for industrial production and everyday consumption. They are broadly categorized into:
Energy Commodities – crude oil, natural gas, coal, etc.
Metal Commodities – gold, silver, copper, aluminum, iron ore, etc.
Agricultural Commodities – wheat, coffee, soybeans, sugar, cotton, etc.
Livestock Commodities – cattle, pork, and poultry.
The commodity market operates through two major platforms—spot markets, where physical goods are traded for immediate delivery, and futures markets, where contracts are traded for future delivery at predetermined prices. These markets are not only crucial for producers and consumers but also for investors seeking diversification and protection against inflation.
The Post-Pandemic Economic Reawakening
The COVID-19 pandemic brought global trade to a halt, creating unprecedented demand shocks. However, as economies reopened and recovery began, the demand for commodities soared. Industries rushed to restock raw materials, pushing prices of metals, energy, and agricultural products upward.
Supply Chain Recalibration: The pandemic exposed the fragility of global supply chains. Countries began rethinking their import dependencies, especially in energy and minerals.
Stimulus-Driven Demand: Governments around the world unleashed massive fiscal stimulus packages to boost economic activity, indirectly fueling demand for construction materials, metals, and oil.
Inflation Hedge: With inflation rising globally, investors turned back to commodities as a hedge, boosting demand in futures markets.
This combination of demand revival and constrained supply triggered the beginning of a new commodity upcycle.
Geopolitical Tensions and Their Ripple Effects
One of the strongest catalysts behind the commodity market’s resurgence has been geopolitics. Conflicts and diplomatic realignments have had a direct impact on energy and raw material prices.
Russia-Ukraine Conflict: The war disrupted global energy and grain supplies. Russia, a leading exporter of oil, natural gas, and fertilizers, faced sanctions, leading to supply shortages and price spikes. Ukraine’s grain exports, critical for global food security, were also severely impacted.
Middle East Volatility: Tensions in the Middle East, particularly involving Iran and Israel, have kept oil markets on edge. Any potential disruption in the Strait of Hormuz can impact nearly 20% of global oil supply.
China’s Resource Strategy: China’s efforts to secure long-term supplies of copper, lithium, and rare earth metals have reshaped global trade patterns, pushing other nations to pursue similar strategies.
Such geopolitical events have underscored how commodities are deeply intertwined with international power dynamics, further driving speculative and strategic interest in these markets.
The Green Energy Transition: A New Commodity Boom
The global push toward decarbonization and renewable energy has created a fresh wave of demand for specific commodities. The green revolution isn’t just about technology—it’s about materials.
Copper and Lithium: The shift to electric vehicles (EVs) and renewable power grids has sent demand for copper, lithium, nickel, and cobalt skyrocketing. These metals are essential for batteries, wind turbines, and solar panels.
Silver and Rare Earths: Silver, known for its conductivity, is vital in solar panels, while rare earth elements power everything from smartphones to electric motors.
Biofuels and Carbon Credits: Agricultural commodities like sugarcane and corn are being used for ethanol and biofuel production, adding new dimensions to their market value.
The green energy boom has effectively launched a “new age commodity supercycle”, where metals and minerals once considered niche are now the focal point of trillion-dollar investment flows.
Technological Advancements and Digital Commodities
Technology is transforming how commodities are traded and valued. Advanced analytics, AI-driven forecasting, and blockchain-based smart contracts are modernizing the age-old commodity trading structure.
Blockchain and Transparency: Blockchain ensures traceability in commodity supply chains, helping verify ethical sourcing, especially for minerals like cobalt and gold.
Algorithmic Trading: Automated trading systems now dominate commodity exchanges, bringing efficiency but also higher volatility.
Digital Commodities: The rise of “digital commodities” such as carbon credits and data storage assets introduces a new layer to the market, expanding its traditional boundaries.
These innovations have enhanced accessibility and transparency, attracting new investors and institutional funds to the sector.
Inflation, Interest Rates, and Investor Behavior
Commodities have historically served as a hedge against inflation. As central banks worldwide grapple with balancing inflation control and economic growth, commodities find themselves at the center of monetary policy discussions.
Inflation Hedge: Gold and silver remain the go-to assets for investors seeking protection from currency devaluation.
Interest Rate Impact: While higher interest rates typically strengthen the dollar (making commodities expensive for non-U.S. buyers), they also suppress speculative demand. However, in a persistently inflationary environment, commodities still outperform many asset classes.
Portfolio Diversification: Institutional investors and hedge funds are increasing commodity exposure through ETFs and index funds to reduce portfolio risk amid equity market volatility.
Thus, the commodity market’s resurgence is not only demand-driven but also investor-driven, as market participants recognize its role as a stabilizer during uncertain times.
Agricultural Commodities: The Silent Winners
While energy and metals grab headlines, agricultural commodities are quietly powering a parallel boom. Climate change, shifting consumption patterns, and food security concerns have made agri-commodities more valuable than ever.
Climate Change Impact: Erratic weather patterns have reduced yields in major producing countries, tightening global supplies.
Rising Global Population: A growing population, especially in emerging markets, is pushing up demand for grains, dairy, and edible oils.
Technological Innovations: Precision farming, AI-driven crop analytics, and bio-engineered seeds are improving productivity, balancing supply-demand dynamics.
Commodities like soybeans, corn, and coffee have seen significant price growth as nations prioritize agricultural sustainability and food independence.
Emerging Market Influence and Demand Surge
Emerging economies like India, China, and Brazil are playing a crucial role in sustaining the commodity bull run. Rapid urbanization, industrialization, and infrastructure expansion have created insatiable demand for energy and metals.
India’s Infrastructure Push: Government initiatives like “Make in India” and renewable energy expansion have spiked demand for steel, copper, and coal.
China’s Urban Growth: Despite efforts to shift to a service-based economy, China’s construction and EV sectors remain massive consumers of raw materials.
Africa’s Resource Potential: African nations are emerging as key suppliers of strategic minerals and agricultural goods, reshaping global supply lines.
The commodity trade’s center of gravity is shifting toward the developing world, ensuring that demand remains robust for years to come.
Challenges: Volatility, Speculation, and Sustainability
Despite its strong recovery, the commodity market is not without challenges. Price volatility remains a major concern, often fueled by speculative trading and external shocks.
Speculative Pressure: Hedge funds and institutional investors often amplify price swings through leveraged positions.
Supply Constraints: Political instability, mining regulations, and environmental restrictions can disrupt supply chains.
Sustainability Issues: The environmental footprint of commodity extraction and production is under scrutiny. ESG (Environmental, Social, and Governance) investing is reshaping how funds approach commodity exposure.
For the commodity rally to sustain long-term, balancing profitability with sustainability will be critical.
India’s Role in the Commodity Resurgence
India, one of the world’s fastest-growing economies, stands at the heart of the commodity revival story. With increasing energy needs, a booming manufacturing sector, and a vibrant agricultural economy, India’s commodity exchanges like MCX and NCDEX are seeing heightened activity.
Energy Imports: India’s dependence on crude oil imports makes it sensitive to global price shifts, influencing domestic inflation.
Gold Consumption: India remains one of the top consumers of gold, linking domestic demand directly with international gold markets.
Agri-Exports: Agricultural exports like rice, spices, and sugar are strengthening India’s global trade presence.
Additionally, the Indian government’s focus on renewable energy and green hydrogen places the nation in a unique position to benefit from the global commodity uptrend.
The Road Ahead: A New Commodity Supercycle?
Market analysts increasingly believe that we are at the beginning of a multi-year commodity supercycle, driven by global transformation in energy, technology, and trade. Key factors fueling this outlook include:
Structural demand from green energy and EV sectors.
Chronic underinvestment in mining and exploration.
Persistent geopolitical fragmentation.
Long-term inflationary pressures.
However, the future of this cycle will depend on how nations balance economic growth with climate commitments. Commodities that align with sustainability goals are likely to outperform those that face regulatory or environmental pushback.
Conclusion: The Age of Strategic Commodities
The resurgence of the commodity market is more than a cyclical rebound—it represents a structural shift in how the world values its natural resources. As the global economy transitions toward sustainability, technological innovation, and multipolar trade systems, commodities are reclaiming their central role in economic development and investment strategy.
From oil rigs to lithium mines and from wheat fields to copper smelters, commodities are driving a silent yet powerful revolution in global finance. For investors, this resurgence offers both opportunities and challenges: opportunities to profit from long-term trends, and challenges to navigate volatility and sustainability risks.
In essence, the world has re-entered an era where “resources equal power.” The commodity market’s revival is not just about prices—it’s about the rediscovery of the tangible foundations that sustain modern civilization.
Stocks AmazonPDH/L Strategy with specific patterns that can give us an edge whjile fighting this war zone everyday.

AI as a Catalyst for Global Economic IntegrationIntroduction: A New Era of Intelligent Globalization
Artificial Intelligence (AI) is redefining how the world communicates, trades, and grows economically. Unlike the previous waves of globalization powered by industrialization or digital communication, the AI revolution represents a more intelligent and automated form of global integration. It is not just connecting markets—it is aligning human decision-making, production efficiency, and cross-border collaboration on a scale never seen before.
AI acts as a catalyst for global economic integration by enabling smarter supply chains, automated financial systems, predictive analytics for trade, and adaptive manufacturing that transcends geographical limitations. From multinational corporations optimizing global logistics to small businesses accessing international markets through AI-driven e-commerce, the influence of artificial intelligence is broad and transformative.
In the following sections, we explore how AI fosters global integration, reshapes economic landscapes, and bridges gaps between developed and developing economies.
1. The Foundation of Economic Integration in the AI Age
Economic integration refers to the process where nations coordinate economic policies, remove trade barriers, and align market systems to promote free flow of goods, services, capital, and technology. Historically, it evolved in stages — from free trade agreements and customs unions to common markets and economic unions.
Now, AI adds a fifth dimension to this progression: intelligent integration. This stage is marked by the use of machine learning, automation, and data analytics to:
Synchronize economic data across borders
Predict market behavior
Improve trade efficiency
Foster innovation in global industries
AI creates digital bridges that are faster and more accurate than political treaties or traditional trade mechanisms. It ensures that integration is not just about policy coordination but about real-time decision alignment across continents.
2. AI and the Transformation of Global Trade Dynamics
Global trade is the lifeblood of economic integration. Traditionally, logistics inefficiencies, fluctuating demand, and geopolitical uncertainties hindered smooth trade flows. AI is eliminating these barriers through advanced analytics and automation.
a. Predictive Trade Analytics
AI can analyze large datasets of global demand, pricing trends, and shipping routes to forecast trade movements. This helps exporters and importers anticipate shifts in demand, reduce wastage, and optimize production levels.
For instance, platforms like IBM Watson and Google Cloud AI provide supply chain optimization solutions that monitor real-time trade conditions and suggest best routes and timings.
b. Smart Logistics and Supply Chains
AI-driven supply chains are becoming self-learning systems. Algorithms can monitor port congestion, weather disruptions, or political instability and automatically reroute shipments. Autonomous vehicles and drones further enhance delivery speed and cost efficiency.
Global logistics firms like Maersk and DHL already use AI for predictive maintenance, route optimization, and fuel management — all of which make global trade more seamless.
c. Cross-Border Payment Automation
AI-based fintech systems enable smoother international transactions. Machine learning helps detect fraud, optimize currency conversion, and reduce transaction time. Digital banks use AI algorithms to assess risk and facilitate instant credit approvals, making it easier for small and medium enterprises (SMEs) to engage in global trade.
3. AI Empowering Emerging Economies
One of the most promising aspects of AI in global integration is its potential to level the playing field between developed and developing nations.
a. Access to Global Markets
AI-driven platforms such as Alibaba’s AI commerce tools or Amazon’s recommendation systems allow small producers from Asia, Africa, or Latin America to reach global customers efficiently. AI translates languages, automates marketing, and predicts consumer demand, enabling local entrepreneurs to compete internationally.
b. Digital Skill Development
AI-based education platforms are providing upskilling opportunities across the world. Through adaptive learning systems, even remote communities can gain technical and financial literacy. This democratization of knowledge promotes workforce integration into global value chains.
c. Agriculture and Manufacturing Uplift
In regions where agriculture and low-cost manufacturing dominate, AI tools enhance productivity. Smart sensors, predictive weather models, and AI-based quality control enable local producers to meet international standards, expanding their market access and economic integration.
4. Financial Integration through AI Innovation
The financial system forms the backbone of economic connectivity. AI is revolutionizing banking, investment, and insurance sectors by creating faster, safer, and more intelligent systems.
a. Global Digital Payments
AI powers the infrastructure behind cross-border digital payments through real-time fraud detection and transaction optimization. Tools like SWIFT GPI and RippleNet use AI to provide near-instant settlements and transparent tracking — reducing the friction of international money transfers.
b. Algorithmic Trading and Market Efficiency
Stock exchanges and investment platforms rely on AI algorithms for predictive modeling, market sentiment analysis, and risk management. These systems help maintain liquidity and transparency in international markets, aligning capital flows across countries.
c. Financial Inclusion
AI-driven mobile banking platforms such as M-Pesa in Africa or Paytm in India extend access to global financial systems for previously unbanked populations. This inclusion accelerates integration by increasing participation in international commerce and remittance flows.
5. Redefining Global Supply Chains
The pandemic and geopolitical tensions have highlighted vulnerabilities in global supply chains. AI is addressing these by introducing resilient and adaptive systems.
Predictive supply chain management: AI forecasts disruptions before they occur.
Automation of inventory control: Smart sensors and robotics balance supply-demand mismatches.
Decentralized manufacturing: AI enables localized production through 3D printing and robotics, reducing dependency on a single country or supplier.
By distributing production intelligence globally, AI ensures that integration is both efficient and sustainable. Companies can collaborate seamlessly across continents with synchronized production schedules and data-sharing platforms.
6. AI and Global Labor Market Integration
AI is not just transforming how businesses operate; it’s reshaping how people work globally.
a. Remote and Cross-Border Collaboration
AI-driven communication tools like Zoom AI Companion, Microsoft Copilot, or ChatGPT enable remote teams from different countries to collaborate effectively. Natural language processing (NLP) tools overcome linguistic barriers, promoting global teamwork.
b. AI in Talent Matching
Platforms like LinkedIn Talent Insights and Indeed AI Recruiter use machine learning to match employers and job seekers across borders. This global labor fluidity supports economic integration by ensuring that talent can flow to where it’s most needed.
c. Productivity and Skill Shift
While some jobs are being automated, AI is simultaneously creating demand for new skills in data analytics, robotics, cybersecurity, and digital marketing. Global labor mobility is increasingly based on AI literacy, encouraging educational institutions and governments to align skill frameworks internationally.
7. Policy, Governance, and Ethical Coordination
As AI-driven integration accelerates, international policy alignment becomes critical.
a. AI Regulation Frameworks
Organizations such as the OECD, EU, and UNESCO are developing AI ethics and data governance standards. Harmonizing these regulations ensures safe and fair use of AI across borders, fostering trust in international trade and data exchange.
b. Data Sharing and Security
Global data flow is the currency of AI-driven integration. Establishing secure and transparent mechanisms for cross-border data exchange is essential for maintaining economic stability and protecting privacy.
c. Collaboration between Nations
Multilateral initiatives like Global Partnership on AI (GPAI) promote research collaboration, resource sharing, and collective policymaking. This cooperative model strengthens the foundation for a globally integrated AI economy.
8. The Role of AI in Sustainable Global Growth
Economic integration today must balance profit with sustainability — and AI is central to this balance.
a. Energy Efficiency
AI optimizes energy consumption in manufacturing, logistics, and transportation. Global initiatives use AI to reduce carbon footprints while maintaining economic growth.
b. Climate Monitoring and Green Trade
AI models help predict climate patterns and assist governments in designing sustainable trade policies. International collaboration on AI-driven environmental technology promotes green integration across markets.
c. Inclusive Growth
AI enables equitable access to technology, finance, and education — reducing inequality and promoting balanced global development.
9. Challenges in AI-Driven Integration
Despite its potential, AI-driven integration faces several challenges:
Digital Divide: Unequal access to AI infrastructure widens the gap between advanced and developing nations.
Job Displacement: Automation threatens traditional employment sectors if reskilling is not prioritized.
Ethical and Data Privacy Concerns: Differing regulations across nations may hinder seamless data flow.
Algorithmic Bias: AI systems can perpetuate inequality if trained on biased data.
Addressing these issues requires a coordinated global strategy emphasizing inclusivity, transparency, and shared innovation.
10. The Road Ahead: Building a Unified AI-Enabled Economy
The next decade will witness the evolution of “AI Globalization 2.0”, where human intelligence and artificial intelligence co-develop economic ecosystems. Nations investing in AI education, digital infrastructure, and ethical frameworks will lead the global integration movement.
Partnerships between governments, corporations, and academia will create a globally interoperable AI network — a system where data, ideas, and innovations move across borders as freely as goods and capital once did.
Ultimately, AI will not just integrate economies but align human progress with technological intelligence, ensuring that globalization evolves toward shared prosperity and sustainability.
Conclusion: Intelligence as the New Currency of Integration
AI has become the central nervous system of the global economy. It drives efficiency, enhances collaboration, and democratizes opportunity. As the world becomes more interconnected through intelligent systems, economic integration will no longer depend solely on trade treaties or capital flows — it will depend on data intelligence, digital cooperation, and shared ethical values.
In essence, Artificial Intelligence is not just a tool of globalization — it is its new architect. It is redefining what it means for nations, businesses, and individuals to be connected, and guiding humanity toward a more integrated, innovative, and inclusive global economy.

AMZN — Earnings Base Case: Short-Term Correction Before Next LegAmazon reports earnings tomorrow, and expectations look well-balanced. Fundamentally, the base case suggests in-line results near guidance — roughly $177–$178B revenue and ~$18B operating income. AWS growth likely holds steady around 17–18% YoY, and Ads should remain strong but may decelerate slightly.
Technically, AMZN appears to be trading within a descending channel after forming a major value area between $210–$245. A pullback toward the lower bound ($205–$210) or the point of control from the previous leg could offer a solid re-entry zone before continuation toward the $260+ region later in Q4–Q1 2026.
If earnings are solid but not spectacular, this measured correction fits the current market structure—absorbing supply before the next expansion phase. Watch for volume confirmation at support to validate the next swing higher.
Key Levels:
Support: $205–$210 (POC / lower channel)
Resistance: $240–$245
Target: $260+
Bias: Neutral-to-bullish | Base Case Scenario

$AMZN is going to run up to earnings. Target #1 $134 then Target #2 $238 and could reach new ATH for earnings.

AMZN Break Out -- Bullish1HR time frame paints a good picture of what's to come in the short term...at least from my perspective.
AMZN finally broke through the sideways chop today with momentum and pushed to the 1.618 fib (from the closed peak of the last wave on 10/3 to the closed low on 10/6).
RSI showing momentum and in an upward trend despite the recent choppiness since 9/25.
RSI peaked at about 77, and looking to cooldown after the breakout. I suspect we'll see price revisit mid $223 before continuing upwards. Will most likely see stair stepping up to the $230's.

AMZN cash flows are strong despite capital expendituresAMZN is valued not on earnings but on operating cash flow. Cash flows are strong with FCF and net operating income remaining robust. Capital expenditures are high in 2025 as the company invests in infrastructure needed for future competitive edge. This may be temporarily leaning on valuations.

$AMZN💼 NASDAQ:AMZN Trading Review
I believe NASDAQ:AMZN is still a strong company. They control a significant share across multiple markets, from e‑commerce and cloud computing to logistics and advertising.
Looking at our charts, the RSI indicates that sellers aren’t willing to push below $220 many seem to prefer holding and selling at higher levels.
Right now, it’s a patience game. If you allocate capital here, emotions need to be left out this is a stock to sit on and let grow until Amazon decides to “turn the pipe on” with catalysts like Prime promotions, cloud growth, or AI expansion.
Key takeaway: Strong fundamentals + disciplined chart behavior = a hold for the patient investor.

AMAZONAMAZON has started the push up after the complete correction, let's see if it holds this upside momentum and breaks the top one more time.
Disclosure: We are part of Trade Nation's Influencer program and receive a monthly fee for using their TradingView charts in our analysis.

AMZN Poised for a Friday Momentum Play: (Oct. 24 Outlook)Will $223 Breakout Trigger a Squeeze Toward $227? 📦
1. Market Structure (1H & 15M)
Amazon’s current market structure shows controlled bullish accumulation following a textbook CHoCH-BOS rotation from the $215–$217 demand base. On the 1-hour chart, AMZN reclaimed structure with a decisive Break of Structure (BOS) near $220, confirming higher-timeframe buyers stepping in. Price remains inside a clean ascending channel, indicating continuation as long as the lower trendline (around $217.5) holds.
The 15-minute chart further refines this structure:
multiple BOS and CHoCH sequences show smart money defending liquidity each time price dips under $218. Recent intraday CHoCHs appear as normal retests within a broader bullish framework — not full reversals yet. Momentum is consolidating right beneath short-term resistance at $223, suggesting the market is coiling for a potential Friday breakout.
2. Supply and Demand / Order Blocks
* Demand Zone (High Confluence): $215–$217. This aligns with previous BOS zones and serves as a high-volume reaccumulation pocket. Expect responsive buyers on any intraday flush into this level.
* Immediate Support: $218–$219 (fair value gap + EMA confluence). If price holds here overnight, it strengthens the bullish case.
* Supply Zone (Key Liquidity Cluster): $223–$226 — heavy liquidity and prior distribution level where sellers could initially react. A break and close above $223.5 could open the door to a squeeze toward $227–$230.
3. Indicator Confluence
* 9 EMA / 21 EMA: Both EMAs have maintained bullish alignment on the 15-minute and 1-hour charts. The slope remains positive, indicating strong momentum with short-term pullbacks being bought.
* MACD: On the 1-hour, MACD is regaining momentum after a brief reset — histogram turning green again, suggesting the next impulse wave could start soon. The 15-minute MACD shows flattening, meaning a buildup of energy before the next move.
* RSI: 1-hour RSI sits near 67, consistent with bullish control but not overextended. The 15M RSI oscillates around 55–60 — a healthy reset zone before a possible expansion move.
* Volume: Stable, with stronger inflow during the breakout above $218 and tapering during sideways consolidation — classic continuation behavior.
4. GEX (Gamma Exposure) & Options Sentiment
Friday’s GEX chart reveals $223–$225 as the highest positive gamma zone, marking the near-term resistance ceiling. The HVL (High Volume Level) support sits around $212.5, perfectly aligned with the lower demand range. Below that, the PUT wall at $210 is a key defensive line for bulls, while above, the CALL walls cluster around $223 and $227, suggesting limited overhead resistance once $223 is cleared.
With IVR at 37.3 and IVX avg at 44.5 (-4.28%), implied volatility is cooling off, often preceding price expansion. The options flow leans 46% toward calls, confirming growing bullish sentiment without extremes — the ideal conditions for a controlled breakout move.
Dealers remain net positive gamma around $220, meaning price action should remain stable until it breaches that $223–$225 zone, where hedging flows could accelerate upside momentum into $227+.
5. Trade Scenarios for Friday, Oct. 24
Bullish Setup 🟩
* Entry Zone: $218–$219 on intraday retest or breakout above $223.3
* Targets: $225 → $227 → $230
* Stop-Loss: Below $217.5
* Confirmation: Hold above 9 EMA on 15M, MACD histogram green, RSI > 60
Bearish Setup 🟥
* Entry Zone: $223–$225 rejection area
* Targets: $219 → $216 → $212
* Stop-Loss: Above $226
* Confirmation: MACD crossdown on 15M + CHoCH below $218 with volume
6. Closing Outlook for Oct. 24 (Friday)
Friday sets up as a momentum continuation day for AMZN — the structure is bullish, EMAs aligned, and gamma positioning supports a controlled grind higher unless $217 breaks. If buyers defend $218 overnight and premarket dips get absorbed, the stage is set for a break-and-run above $223, potentially triggering dealer hedging and a squeeze into $227+.
However, if price fails to reclaim $223 or shows clear rejection with declining volume, expect a controlled drift back toward $215–$217 before buyers attempt again next week.
My take: AMZN looks technically strong and primed for follow-through, but $223 remains the gatekeeper. Momentum is building quietly — if the wall breaks, expect quick movement and thin resistance above.
💬 Final Thought:
“AMZN’s structure looks tight and ready. If $223 snaps, watch it glide through $227 fast — if not, $217 reload zone will likely be retested before the next push.”
This analysis is for educational purposes only and not financial advice. Always do your own research and manage your risk before trading.

Amazon and AWS: The Outage That Paralyzed Half the WorldBy Ion Jauregui – Analyst at ActivTrades
From the early hours of Monday, October 20, 2025, Amazon Web Services (AWS) —Amazon’s cloud computing division— suffered a global outage that disrupted thousands of companies and users worldwide. The disruption, originating in AWS’s Northern Virginia (U.S.) data centers, took down websites, applications, payment systems, and everyday platforms.
The failure, described by several experts as one of the company’s most serious in recent years, triggered a chain reaction that temporarily paralyzed much of the digital economy. Among the affected platforms were Canva, Asana, Perplexity AI, McDonald’s, Roblox, and Crunchyroll, as well as numerous financial and communication services.
One of the most visible effects occurred in payment systems: many card readers stopped working, preventing electronic payments, while ATMs and services such as Bizum also went offline, making it impossible to withdraw cash or send instant transfers. For several hours, many businesses were forced to accept only cash or close their points of sale.
AWS acknowledged the incident through its official service status page, confirming “network operation issues in the Northern Virginia region.” Technical teams worked urgently to restore connectivity, and although services gradually returned to normal throughout the day, the event highlighted the global dependence on Amazon’s digital infrastructure.
With over 30% of the global cloud services market, AWS underpins a large portion of internet operations, from streaming and gaming platforms to payment systems, banks, and public administrations. Its outage reignites the debate on technological centralization and the need for greater diversification among cloud providers.
Technical Analysis – Amazon (Ticker AT: AMZN)
Amazon shares (NASDAQ: AMZN) fell 2.3% following AWS’s technical issues, though they managed to recover part of the losses, closing the session around $216.48. Despite the reputational setback, the financial impact is expected to be short-lived and does not alter the company’s positive long-term trend, driven by sustained growth in its e-commerce, advertising, and web services divisions.
Since Friday, October 10, the stock had corrected below the $217.96 support level after the 50-day moving average crossed below the 100-day, amplifying downside pressure. However, Monday’s move showed a technical rebound at the 200-day moving average, suggesting potential short-term support.
At present, the price appears to be forming a technical floor above the $211.03 lows. The Point of Control (POC) stands at $222.08, a key level to break in order to confirm a sustained rebound. Should this threshold be surpassed, the next target lies at $232, followed by $238.35, whose breakout could lead to a new bullish impulse.
Conversely, a loss of support could drive the stock to retest the $202 area, signaling a possible trend reversal. The RSI, around 43.49%, indicates slight oversold conditions, while the MACD shows signs of lateral movement, consistent with the “Risk Off” sentiment prevailing in recent sessions, as reflected by the ActivTrades US Market Pulse indicator.
Clouds on the Horizon
The incident leaves one clear conclusion: in an increasingly digitalized world, a cloud failure can turn into a global storm. AWS has pledged to strengthen its redundancy and security protocols, but the October 20 outage will remain a reminder that even tech giants are not immune to vulnerability.
*******************************************************************************************
The information provided does not constitute investment research. The material has not been prepared in accordance with the legal requirements designed to promote the independence of investment research and such should be considered a marketing communication.
All information has been prepared by ActivTrades ("AT"). The information does not contain a record of AT's prices, or an offer of or solicitation for a transaction in any financial instrument. No representation or warranty is given as to the accuracy or completeness of this information.
Any material provided does not have regard to the specific investment objective and financial situation of any person who may receive it. Past performance and forecasting are not a synonym of a reliable indicator of future performance. AT provides an execution-only service. Consequently, any person acting on the information provided does so at their own risk. Political risk is unpredictable. Central bank actions can vary. Platform tools do not guarantee success.
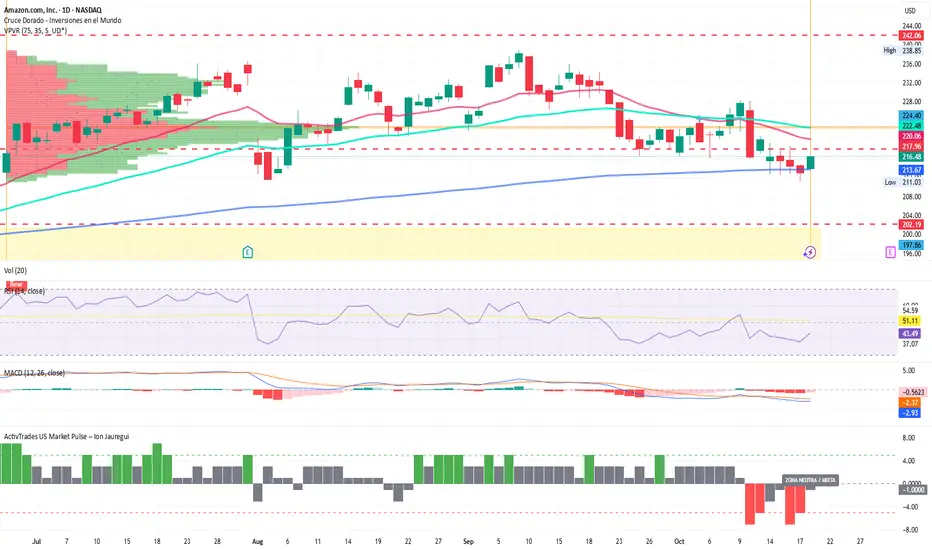
AMZN - Could it?2.618 price target, roughly 700-800 USD
Wonder if it could happen
Not financial advice
