AMZNNASDAQ:AMZN
Already up 7+%
can go towards 120 on the upside
but a bit skeptical for after ER hrs.
can test towards 105
AMZN trade ideas

Amazon - watch 106106 is the magic number for me on AMZN - both daily BB and structural trendline resistance is there and we have steep hidden bearish divergence on the daily charts (yellow lines on price and rsi). AMZN doesn't always get to it's BB but I think this time it will, we'll see. Either way, I think it pulls back from there. 106 can be reached with FOMC reaction or with earnings this week. Good luck!

Falling Wedge - Earnings Play AMZN has been holding a massive falling wedge for quite some time, and with buyers finally starting to step in as AMZN approaches earnings, definitely will be keeping a close eye on this one. Bollinger bands are squeezing (Not Pictured), Bullish ABCD Elliot Wave, some bullish hidden divergence on the RSI, and a double bottom all pointing to a breakout. However, a bit wary to enter given Powell will be live at 2:30 today. Bullish and will be looking for a breakout from this wedge (Broader Market Conditions Permitting)- Just some FIB levels to watch along with some RSI-based supply and demand zones to keep an eye on in the meantime
--See Attached PT's & Previous Charts Below--
PT1- $103.17
PT2- $105.34
PT4- $107.11
PT4- $109.56 +
--Previously Charted--

AMZN earnings todayAMZN Q4 earnings are today, 2/2 at 4pm. Amazon (AMZN) reported Q3 September 2022 earnings of $0.28 per share on revenue of $127.1 billion. The consensus earnings estimate was $0.22 per share on revenue of $126.4 billion. Revenue grew 14.7% on a year-over-year basis. The company said it expects Q4 revenue of $140 billion to $148 billion. Here's an AMZN 1 week chart with the past 8 earnings reports PE, EPS, revenue, cash & debt data indicators. Plus 2/3, 2/17 and 3/17 expiry options data.
Q4 December 2022 Consensus:
EPS = 0.15
Revenue = $145.40B
P/E = 96.5
Q3 September 2022:
EPS = 0.28 beat +35.53%
Revenue = $127.10B miss -0.29%
Cash = $35.17B
Debt = $128.25B
Q2 June 2022:
EPS = -0.20 miss -270.72%
Revenue = $121.23B beat 1.76%
Cash = $37.7B
Debt = $124.577B
Q1 March 2022:
EPS = -0.38 miss -190.58%
Revenue = $116.44B miss -0.53%
Cash = $36.6B
Debt = $113.287B
Q4 December 2022:
EPS = 1.39 beat +657.12%
Revenue = $137.41B miss -0.13%
Cash = $36.48B
Debt = $116.395B
2/3/23 expiry options data:
Put Volume Total 91,854
Call Volume Total 141,512
Put/Call Volume Ratio 0.65
Put Open Interest Total 232,469
Call Open Interest Total 286,708
Put/Call Open Interest Ratio 0.81
2/17/23 expiry options data:
Put Volume Total 35,737
Call Volume Total 130,457
Put/Call Volume Ratio 0.27
Put Open Interest Total 368,246
Call Open Interest Total 646,114
Put/Call Open Interest Ratio 0.57
3/17/23 expiry options data
Put Volume Total 20,571
Call Volume Total 55,465
Put/Call Volume Ratio 0.37
Put Open Interest Total 402,933
Call Open Interest Total 659,330
Put/Call Open Interest Ratio 0.61

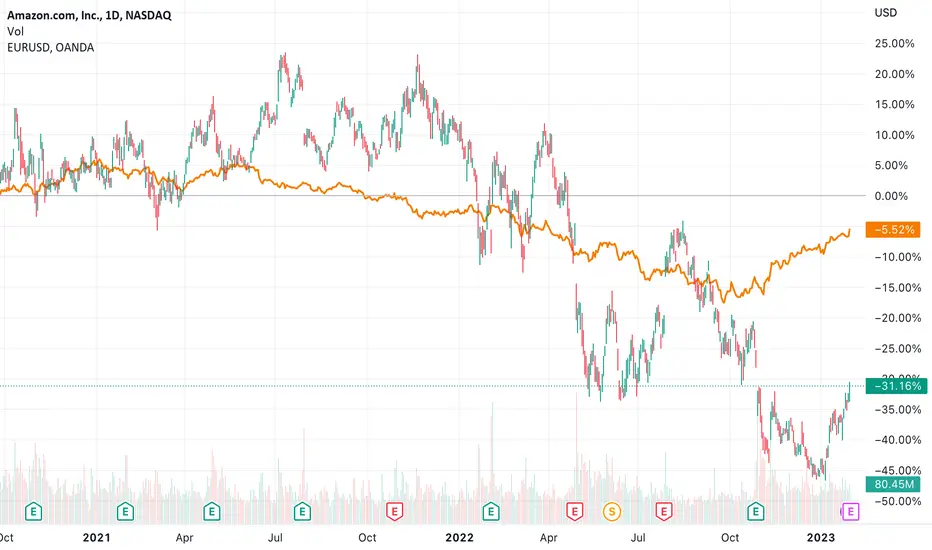
Workforce strikes come at a dangerous time for AmazonAmazon.com, Inc. (symbol ‘AMZN’) is still trading at a loss compared to the beginning of the last quarter of the year and is currently at 12% loss. The company’s earnings report for the fiscal quarter ending December 2022 is set to be released on Thursday 2nd of February, after market close. The consensus EPS for Q4 is $0.17 compared to Q4 2021’s $1,39.
‘The e-commerce giant is facing the first ever UK warehouse workers strike which is expected to increase delays in the delivery of products and possibly affect the share price if the strikes escalate. This comes after the massive layoff of around 18,000 workers in 2022 while company officials stated that the cuts are not part of cost reducing measures but more of efficiency improvement.’ said Antreas Themistokleous at Exness: ‘Even though EPS is lower than the respective one of Q4 in 2021 its is at an average compared to previous 2022 quarters. Only thing remaining now is to see if there will be a significant surprise on the actual EPS and how it would affect the share price’
From the technical point of view the stock has performed poorly over the last quarter but is on the move to gain back some of those losses. The price made continuous closures above the daily bearish trendline and is currently finding resistance on the 23.6% of the Fibonacci retracement level.
If the price manages to break above the strong psychological resistance of the $100 mark we could expect a bullish continuation with a first point of resistance around the $106 price area which consists of the 38.6% of the daily Fibonacci retracement level and also an inside resistance level since mid October 2022.
In the case of the bears being stronger of the bulls and the price resumes the overall bearish movement we could see some support around the $90 which is made up of the 20 and 50 moving averages and also an inside support since late November.

Amazon EarningsAmazon likely sees a continuation move into the multi factor resistance white trendlines.
If it reaches that level it will likely encounter some sell pressure.

AMZN AnalysisPrice playing out exactly as analyzed last week. Price has reached the target of filling the fair value gap at 109.77. As there are no signs in change of character, I'm expecting price to continue higher following the bullish impulse into the bearish POI at 113.22 as the next target.

Amazon back on the track!Amazon - 30d expiry - We look to Buy a break of 105.11 (stop at 98.39)
We have a Gap open at 28/10/2022 from 110.96 to 97.91.
Bullish divergence can be seen on the daily (the chart makes a lower low while the oscillator makes a higher low), often a signal of exhausted bearish momentum, or at least a correction higher.
Prices have reacted from 81.43.
Short term momentum is bullish.
Short term bias has turned positive.
A break of the recent high at 104.87 should result in a further move higher.
Our profit targets will be 121.88 and 125.88
Resistance: 103.50 / 104.87 / 112.00
Support: 101.00 / 97.50 / 91.52
Please be advised that the information presented on TradingView is provided to Vantage (‘Vantage Global Limited’, ‘we’) by a third-party provider (‘Signal Centre’). Please be reminded that you are solely responsible for the trading decisions on your account. There is a very high degree of risk involved in trading. Any information and/or content is intended entirely for research, educational and informational purposes only and does not constitute investment or consultation advice or investment strategy. The information is not tailored to the investment needs of any specific person and therefore does not involve a consideration of any of the investment objectives, financial situation or needs of any viewer that may receive it. Kindly also note that past performance is not a reliable indicator of future results. Actual results may differ materially from those anticipated in forward-looking or past performance statements. We assume no liability as to the accuracy or completeness of any of the information and/or content provided herein and the Company cannot be held responsible for any omission, mistake nor for any loss or damage including without limitation to any loss of profit which may arise from reliance on any information supplied by Signal Centre.

AMZN Potential for Bullish Continuation | 1st February 2023Looking at the H4 chart, my overall bias for AMZN is bullish due to the current price being above the Ichimoku cloud , indicating a bullish market.
Looking for a pullback buy entry at 98.68, where the 38.2% Fibonacci line is. Stop loss will be at 91.54, where the previous swing low is. Take profit will be at 121.31,where the previous swing high is.
Any opinions, news, research, analyses, prices, other information, or links to third-party sites contained on this website are provided on an "as-is" basis, as general market commentary, and do not constitute investment advice. The market commentary has not been prepared in accordance with legal requirements designed to promote the independence of investment research, and it is therefore not subject to any prohibition on dealing ahead of dissemination. Although this commentary is not produced by an independent source, FXCM takes all sufficient steps to eliminate or prevent any conflicts of interest arising out of the production and dissemination of this communication. The employees of FXCM commit to acting in the clients' best interests and represent their views without misleading, deceiving, or otherwise impairing the clients' ability to make informed investment decisions. For more information about the FXCM's internal organizational and administrative arrangements for the prevention of conflicts, please refer to the Firms' Managing Conflicts Policy. Please ensure that you read and understand our Full Disclaimer and Liability provision concerning the foregoing Information, which can be accessed on the website.

AMZN Potential for Bullish Continuation | 1st February 2023Looking at the H4 chart, my overall bias for AMZN is bullish due to the current price being above the Ichimoku cloud, indicating a bullish market.
Looking for a pullback buy entry at 98.68, where the 38.2% Fibonacci line is. Stop loss will be at 91.54, where the previous swing low is. Take profit will be at 121.31,where the previous swing high is.
Any opinions, news, research, analyses, prices, other information, or links to third-party sites contained on this website are provided on an "as-is" basis, as general market commentary, and do not constitute investment advice. The market commentary has not been prepared in accordance with legal requirements designed to promote the independence of investment research, and it is therefore not subject to any prohibition on dealing ahead of dissemination. Although this commentary is not produced by an independent source, FXCM takes all sufficient steps to eliminate or prevent any conflicts of interest arising out of the production and dissemination of this communication. The employees of FXCM commit to acting in the clients' best interests and represent their views without misleading, deceiving, or otherwise impairing the clients' ability to make informed investment decisions. For more information about the FXCM's internal organizational and administrative arrangements for the prevention of conflicts, please refer to the Firms' Managing Conflicts Policy. Please ensure that you read and understand our Full Disclaimer and Liability provision concerning the foregoing Information, which can be accessed on the website.

AMZN BULLISH ENGULFING CANDLE Monthly candle just closed and it looks very much like a bullish engulfing candle, reports will be released Thursday with expected volatility, I see this pushing price higher up to 135.00 -140.00

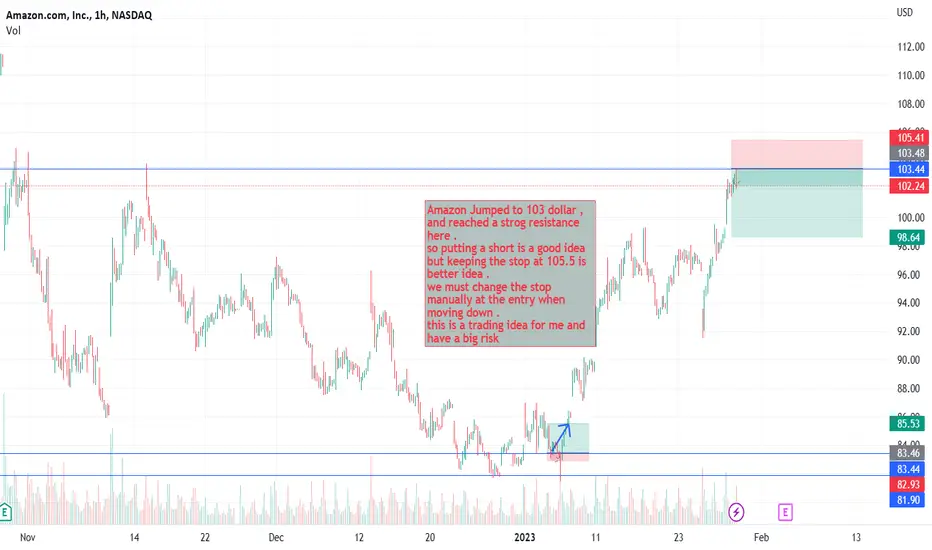
Short on amazonAmazon Jumped to 103 dollar , and reached a strog resistance here .
so putting a short is a good idea but keeping the stop at 105.5 is better idea .
we must change the stop manually at the entry when moving down .
this is a trading idea for me and have a big risk
Trading The Trend Line AMZNTrading the trend line for Amazon. Should ride high into earnings. Use caution when trading & let me know what you think of this upward trend. Will AMZN pop after earnings?

Bearish rallyThe stock completed a Leading Diagonal at wave A and looks set for a minor rally to complete B wave of an ABC Correction.

AMZN earnings setup to burst out of squeezeWith the IFT(CCI) IFT (StocH) in positive territory and Di+ riding top, as price emerges from squeeze burst of energy is released
Earnings catalyst setup

AMAZON Short From Resistance! Sell!
Hello,Traders!
AMAZON is again retesting
A strong horizontal resistance
From where a local pullback
Is likely to happen
Sell!
Like, comment and subscribe to boost your trading!
See other ideas below too!

#Amazon: Bears Will Soon Step In Soon🔥Price is approaching a strong supply zone
Which also goes in line with the 38.20%
Fib retracement level
But wait for a confirmation before
You enter the trade to short price
To the next fib level.

AMZN: Bearish Continuation
The recent price action on the AMZN pair was keeping me on the fence, however, my bias is slowly but surely changing into the bearish one and I think we will see the price go down.
❤️ Please, support our work with like & comment! ❤️

Amazon (AMZN) Updates ---> LONGAmazon (AMZN) Trade Updates
Amazon arrives in the volumetric accumulation zone of the last 2 years.
the price reacted in the best way both on the weekly and on the daily,
Waiting for the Earnings, which in 2022 have not been good for the first time in years, even considering the last quarter positive in cash flow, but negative in net profit margin (-20%).
Now, in the case of neutral data, I will certainly evaluate a further entry, having an average price of about $106, I expect to double the exposure.
My target is all-time highs, although volumetrically one could think of an exit at $160
Happy trading
Lazy Bull

✅AMAZON LOCAL SHORT🔥
✅AMAZON will be retesting a resistance level soon
From where I am expecting a bearish reaction
With the price going down but we need
To wait for a reversal pattern to form
Before entering the trade, so that we
Get a higher success probability of the trade
SHORT🔥
✅Like and subscribe to never miss a new idea!✅

AMZN Possible First Day BreakoutAmzn finally hitting top of bands, curled tight. Could be first day of a run.

AMZN long on covid lows testAMZN just hit covid lows last week and bounced. RSI and MACD are doing positive divergence while price went negative.
Best stop loss would be any close below 81.3
