AmznPulled back to support last 2 days.
Bounced off 21ema yesterday and printed a hammer with strong volume
Target 112 gap close
Stop loss 21ema
AMZN trade ideas

Amazon: Fundamental Analysis + Next TargetIn the last year, the price of Amazon stock has decreased by more than 30%. Following profits that were poorer than experts had anticipated in 2023, the company's shares had a temporary recovery.
However, Amazon's long-term thesis is still compelling, and this could be a terrific opportunity to purchase the company during the current dip. This is due to a number of factors.
The macroeconomic environment may soon improve.
Although it is still too early to say whether the Nasdaq bear market is finished, there does appear to be some hope. Even though interest rates are high right now, inflation is not decreasing. This might persuade the Federal Reserve to loosen its stringent monetary policy without sending the American economy into a downturn, a situation known as "soft landing."
Although Amazon's stock price appears to be benefiting from favorable market factors, the company's recent results for the fourth quarter ended Dec. 31, 2022, leave much to be desired. Net sales rose 9% year over year to $149.2 billion thanks to growth in North American e-commerce and cloud computing, which helped offset a significant decline in international e-commerce. Net income fell 98% from $14.3 billion to just $300 million.
That's a very troubling result. But investors should look at the situation in the right context. Amazon's business is cyclical, which means it is very sensitive to changes in macroeconomic conditions -- including inflation and rising interest rates, which can hurt consumer confidence.
And while the global economy may weather the recession, many companies are choosing to behave more cautiously, postponing enterprise cloud migrations or moving to cheaper service levels, resulting in slower Amazon Web Services (AWS) revenue growth.
In the long term, e-commerce and cloud computing remain growth opportunities for Amazon. Executives believe public and private enterprises are still in the early stages of moving their computing needs to the cloud.
And in 2023, Amazon plans to bring its e-commerce platform to new markets in Latin America and Africa. The company's scale allows it to achieve cost and network efficiencies to stay ahead of competitors in the industry.
Amazon stock, with a price-to-earnings ratio of 68, doesn't look particularly cheap compared to the S&P 500 average of 22. But investors should keep in mind that, as a cyclical company, its current earnings are unusually low and do not necessarily reflect its long-term earnings potential.
Despite its near-term problems, Amazon remains one of the best bets for long-term e-commerce and cloud computing, and for patient investors, the stock still looks like a buy.

AMZN bum to the penny and now it's time to reverse?AMZN had a nice and strong drop just as it was analyzed in the last report and in our Hot stock pick report. AMZN is still in a huge falling wedge which is a bullish pattern when and if breaking the upper trend line, however last time it touches that trend line it was rejected with a "hammer". Price had a healthy correction to 0.5 FIB, and at the same time, it formed a bullish reversal candle Hammer just as it touches 20 days MA, 0.5 FIB, and the horizontal line. Can it be better than that, it's really a textbook move. Also, it could now be a nice bull pullback targeting again BigRed and the upper trendline.
Volume is neutral, bullish, and bearish due to the strong volume days on both sides.
Price is above 20 and 50 days MA but below 200 days MA / BigRed which is mixed.
RSI did cool down and is in neutral territory.
MACD, however, has smaller and smaller ticks and it seems like are trying to converge or cross over each other which if done would be bearish. But if the MACD line, the blue line, manages to stay above the signal line that would be bullish.
Overall: AMZN did correct/ cool down after an extreme move to the up and after it got rejected from 200 days MA and trend line. Now is ready to move up, but there will be a question does it have the power to move above that 2 major resistance, or will fall again? The issue is it is almost certain, when and if it reaches those resistance levels (blue circle) it will form bearish divergences on both MACD and RSI which will represent strong pressure on price. However, if it finds support in buyers and it breaks above the trend line, it would trigger a massive buy wave from all over due to the breaking out of a bullish pattern. Time will tell. Take small steps. Trading is a marathon, not a sprint!

Amazon heading $65 by end of marchIn my opinion shorting now there's more chance of winning.
They all saying it's a buy but remember always when they say it's a buy it goes opposite way.

$AMZN with a Neutral outlook following its earnings #Stocks The PEAD projected a Neutral outlook for $AMZN after a negative under reaction following its earnings release placing the stock in drift D with an expected accuracy of 60%.
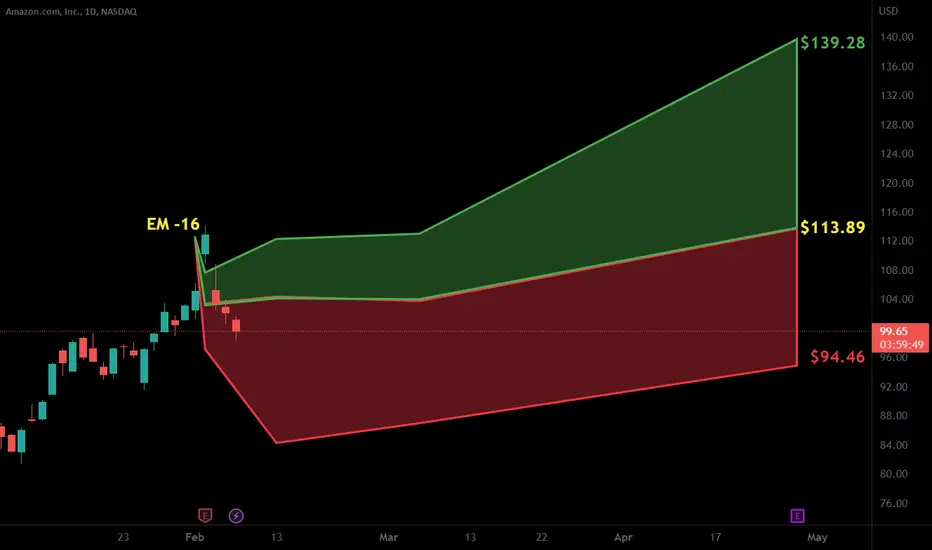
97 by Feb 15 then 120s by AprAMZN has formed a bullish base a is finishing up its sign of strength, however, expect it to get hit post-earnings.
Near-term bearish with target 97 by 2/15/2023
If it finds support there it will markup to 120s by April 2023.

AmazonTargeted Range hit. we have a selling climax creating a range. Looks like we will range here for a while

AMZN - Victim Of Its Own SuccessAmazon, Inc. What's wrong with that title? It's not quite the official name of the company. The company colloquially referred to as "Amazon" by anybody and everybody from my Grandfather to teenage girls at my high school, both looking to shamelessly devolve into consumerism from the nearest smartphone or web browser, has an undeniable grip on the modern world. The correct name for AMZN, as it's listed on the NASDAQ, is Amazon.com, Inc. This title, a remnant of its dotcom era IPO, indirectly serves today to remind investors of Amazon.com, Inc's massively profitable cloud computing division, which operates completely separately from its retail division, and which pushed its common stock to almost a 1.7 Trillion dollar valuation at the end of 2021.
It's hard to say anything bad about Amazon.com, Inc's cloud computing business. Its market share is larger than Google and Microsoft's share combined in the same industry (Q3 2022 Data according to Statista). Big names like Netflix, Facebook, and Twitter use their services. Their service quality is high and has data centers around the globe. Its growing extremely fast.
The Catch: Current macroeconomic headwinds are causing many businesses to cut back spending, and AWS is seeing this effect their bottom line. AWS still grew 20% year over year in Q4, but short of the expected 27.5%. This moderate slowing in its massive growth might be normally acceptable by investors to some degree.
Except, it's not. AMZN trades at a sky-high PE of 68; After already losing more than 700 Million dollars in market cap since its peak in 2021. This ratio relies heavily on aggressive growth models for the company.
AMZN's PE ratio has always been this way. Overzealous investors have been willing to pay this premium to get ahead of the massive profits AWS consistently posted. In many tech companies, excessive growth valuations have often been justified by certain rock solid keystone statistics (think: META's daily user count). Yet, growth is in practice finite, and a peak in these statistics forces multiples return to earth. The current market conditions and complex nature of the cloud computing industry could make the peak more difficult for investors to identify, but barring explosive cloud growth in future quarters, the multiple normalization process will take place.
Disclaimer
The information and publications here are not meant to be, and do not constitute, financial, investment, trading, or other types of advice or recommendations. Conduct your own research and consult a financial advisor before making any investment decisions.

AMZN_AMZN | www.tradingview.com
--> Calls above 105 | Puts below 103
**AMZN with the weak price action after ER Test the daily gap fill and rejected. Will be looking for this name to see if price holds the gap fill entry at $103 or fails to hold and continues pulling back with relative market weakness.**

HTF Amazon PerspectiveNot a whole lot of commentary on this. It looks like we are in a wave 4 of 5 of a higher degree 3rd on Amazon. I would look for a buy opportunity if it hit those confluences around $60-65. Would look at a possible 5 of 3 inbound at that point.
Just my perspective.


Amazon WeeklyThe Fibonacci channel is a technical analysis tool that is used to estimate support and resistance levels based on the Fibonacci numbers. It is a variation of the Fibonacci retracement tool, except with the channel the lines run diagonally rather than horizontally.
Downtren CHannel.

AMZN daily - sell signalAMZN after the solid ride for the upside went to resistance and got smashed very hard. Resistance is too strong for now and likely for some time. There is BigRed plus a falling upper trend line from the pattern. It is in a falling wedge pattern which when it breaks out will be very bullish. Because of that hard rejection from resistance, it is a sell signal for AMZN.
It is above 20 and 50 days MA which BigRed is still too big resistance for AMZN, especially for such weak financial results.
Volume was explosive and represented pure capitulation on the upside.
RSI did start to cool down after extremely overbought territory.
MACD is in overbought territory and starts to cool down.
Overall: for now resistance is too strong for AMZN. For any bull chance to break out of the falling wedge price should fall to the 94 to 98# area or 0.618 and 0.5 Fib retracement before it tries to break again. There would also be 20 and 50 days MA which could act as support and which could help AMZN to start moving up again.
If support doesn't hold next one is low at 81.6$.
There is an 80% chance we will see a lower low during the first half of the year.

amazon stock amazon holder don't panic hold for 1 to 2 month
old buyer dont exit ( wait for good news )
new investor ( wait for dip if brake this level )
so game is 80-20 % so amazon can take a more spot if they take a spot then you can more buy
if Monday favour our technical you can see more profit

Will we get a 20% bounce out of Amazon?The cheap can always get cheaper, but the last couple of times Amazon has had a drop like this sending the RSI into lows we have ended up with a 20% or so bounce. Will be interesting to see if it happens again this time around or whether it continues its downward slide without the recovery rally.
One to watch.

Amazon with bonus Bitcoin Line ChartIf #Amazon goes down, so does #Bitcoin.
Buckle up my #crypto friends!

Amazon Monthly Log ChartAmazon has one of the most OMINOUS looking charts.
Really looks like market could implode... SOON and BIG TIME.
#fintwit #amzn $arkk #nasdaq #bitcoin #meta

Amzn amazon Amazon to retest the 1.618 before moving higher.
Financial report didn’t not help the stock to break out. Time to short and see where the bottom might be.

AMZN WEEKLY TRADEHello
fundamental issue
job cuts
company stability
underpaid
My trading strategy isn't intended to be used as a signal service. It's a process of gaining knowledge of market structure and improving my trading abilities.
Like and subscribe and happy trading to all

AMZNNASDAQ:AMZN
now back to business as usual.
will do its grind upwards and try to climb those channels towards POC
if positive sentiment, needs a big push to take out 120 which is the next major level
else rangebound

AMZN // Flag formationAlthough there is a flag formation in the chart, the targets are determined according to Fibonacci.

Moving DOWNWe are in dangerous territory right now. Okay here's what's happening:
1. We just hit the 200-day moving average, so that gives us resistance at this moment.
2. We also hit the support line that has supported Amazon ever since Dec 2018, which broke down last October. Now it will act as a serious resistance level.
3. We are at an overbought RSI level on a daily chart. Pretty much every time it goes above RSI it moves down $20. That means there's pressure.
4. Earnings Report was the one news that could've moved Amazon stock above the 200-day moving average but it didn't.
Given these, we are going down hard in the next couple of days.

AMZN Price may move up to weekly resistance in coming weeksPrice trading inside 3M resistance zone. However there are still 2 months to go to close the 3M candle. Therefore price can be a bit insensitive towards that resistance and continue to move higher.
However, the weekly resistance above definitely going to pose challenge for the price. This also coincides with the downward trend line the price has been push against since the downward movement in the end of 2021 started.
